
Abstract
In order to optimize the real-time crushing effect of 6-DOF robotic crusher, a model of energy consumption and a multi-objective optimization control method for 6-DOF robotic crusher are proposed. In optimization function, the optimization objective are total energy consumption, mass fraction of crushed products below 12 mm, energy consumption ratio, and throughput, and optimization variables are position of suspension point, rotational speed and precession angle of the moving cone. Among them, the function of total energy consumption and effective energy consumption is established and the function of total energy consumption is verified in this paper. The function of mass fraction of crushed products below 12 mm is based on previous research. Taking the full load working condition and chamber size of PYGB1821 crusher as an example. The solution of optimization is obtained. Compared with the traditional cone crusher under the same feed size distribution and chamber size, each objective can be effectively optimized, which can effectively reduce energy consumption and increase the crushing efficiency. This method is universal and can be used for the design and control of other crushing equipment.
Keywords
Introduction
The cone crusher has the main advantages of large crushing ratio, uniform product size and wide application range. It is widely used in mining, metallurgy, construction and other industries. The structure of traditional cone crusher is shown in Figure 1(a).

Structure of the traditional cone crusher and 6-DOF robotic crusher: (a) structure of the traditional cone crusher, (b) structure of the 6-DOF robotic crusher.
Its working mode is that the spindle 1 drives the eccentric sleeve 2 to rotate eccentrically, so that the lining plate on the moving cone 3 and the fixed cone can extrude the materials in the crushing chamber. The working conditions of main parts are high speed, heavy load and vibration, so they are easy to be damaged. Therefore, its design of size, structure and strength are conservative, and it will cause high weight, high energy consumption, low efficiency and other consequences. As shown in Figure 1(b), the structure of the 6-DOF robotic crusher is obtained after the structural optimization design of the traditional cone crusher. Compared with the traditional cone crusher, the biggest difference is that the actuators with adjustable moving cone position replace the eccentric sleeve with non-adjustable moving cone position, and the compression ratio can be adjusted automatically. Its working mode is different from the traditional cone crusher. The motion mode of the traditional cone crusher is shown in Figure 2:

Motion mode of moving cone of cone crusher: (a) side view, (b) axonometric projection.
As shown in Figure 2(a), in the side view, the moving cone swings around the suspension point. The limit position angle of left and right swing is precession angle. As shown in Figure 2(b), the whole motion can be seen as the combination of the oscillations of the xOz plane and the yOz plane, with a phase difference of 90°. In traditional cone crusher, the relative position of main shaft, eccentric sleeve and moving cone is fixed, which cannot be adjusted when working, that is, the position of suspension point and the compression ratio of each layer are fixed. The precession angle of the cone crusher is small, so the previous research on the kinematics of the moving cone1,2 is based on the eccentric motion of the cross section. In the 6-DOF robotic crusher, the actuators replace the above parts, and the relative position between the actuator and the moving cone is variable. That is, the compression ratio of each layer is variable, so the position of the suspension point is not fixed, and may even be located under the moving cone. The position of suspension point, rotational speed and precession angle can be adjusted in real time. So the former kinematic model is not suitable, and the corresponding kinematic and power (i.e. energy consumption) model should be established.
There are some researches on energy consumption of crusher. In terms of disc crusher, J.M. Zuñiga 3 calculates the total energy consumption of disc crusher by studying the dynamics of parts. In terms of cone crusher, Liu 4 puts forward an energy consumption model, which shows the influence of working conditions and structural parameters of crushing chamber on energy consumption. The existing researches are all aimed at the total energy consumption of crusher, rather than the effective energy consumption of particle crushing. The research on energy consumption of single particle crushing5–7 is also limited to the process from the beginning of loading to the particle breaking, which is different from the situation that the crushed products continue to break after the particle breaking in the actual case. Therefore, it is necessary to study the effective energy consumption, that is, the energy consumption of particle crushing. The main researches on optimization aim at performance, life and strength of main parts. Zhang, 8 Cheng, 9 Huang, 10 have researched the optimization of the dimensions of thrust plate, lining plate, wear plate and other parts. In terms of material parameters, M Bengtsson, 11 E Lee, 12 Wang, 13 have researched the optimization of parameters such as output, discharge particle size, needle slice rate, etc. In terms of size, structure and shape of crushing chamber, Lee, 14 Dong et al., 15 have studied about these aspects. In recent years, with the development of computer science, automatic control, machine learning, artificial intelligence have been widely used. In terms of cone crusher related aspects, Asbjörnsson 16 has developed the cloud based solution to achieve stable production. Ostroukh 17 has presented an automated cone crusher control system to achieve efficient operation of the technological line for the crushing and screening plant. Hulthén 18 has proposed Evolutionary Operation (EVOP) to find an operating point closest to the optimal. Abuhasel 19 has used adaptive neuro fuzzy inference system (ANFIS) to simulate the cone crusher output. Therefore, the intellectualization of cone crusher is an important research direction. The related research is still based on traditional cone crusher. For the 6-DOF robotic crusher, in addition to the above aspects, it also needs to optimize its unique intelligent control, so as to optimize the crushing products and energy consumption.
In this paper, the energy consumption model suitable for 6-DOF robotic crusher is established. Combined with the existing research results, 20 the optimization function with total energy consumption, mass fraction of crushed products below 12 mm, energy consumption ratio, and throughput as the optimization objective and position of suspension point, rotational speed and precession angle of the moving cone as the optimization variables is established. Combining the model with the experimental data of Anshan Iron and Steel Group, the optimization results are obtained by genetic algorithm. In the evaluation of optimization results, the final optimization results under different evaluation methods can be obtained by giving different weight coefficients to each optimization goal. The corresponding independent variable is the optimization result. Compared with the traditional cone crusher, each objective can be effectively optimized. The results can provide control strategy basis for 6-DOF robotic crusher control, 21 self-adaptive adjustment strategy for high-pressure roller mill and other crushing equipment, and can be used as design reference for traditional crushing equipment.
Model of total energy consumption
Power model of moving cone
The stress and velocity at a point on the moving cone are shown in Figure 3.

Stress and velocity at a point on the moving cone.
The power P at this point is

Where,

That is the surface integral of the power of each point on the surface of the moving cone, which can be calculated by using the cylindrical coordinate, so that the suspension point is 0 point in the moving cone coordinate system. The integrand function is determined by z coordinate and the polar angle θ, and the above surface integral can be converted into

Among them, z0 and zn are the z coordinate of the lowest point and the highest point of the material position, and R(z) is the function of the radius of the moving cone changing with the z coordinate.
Size parameters of moving cone and crushing chamber
The dimension parameters of crushing chamber are shown in Figure 4.

Dimension parameters of crushing chamber: (a) limit position of moving cone, (b) original position of moving cone, and (c) polar coordinates of moving cone.
In Figure 4(a), b is the length of open side, cs is the length of closed side. In Figure 4(b), cr is the original compression thickness. The length of b, cs and cr is intersection between the vertical line made from a point on the moving cone contour line to the fixed cone contour line. s is the stroke on the moving cone, which is the stroke of a point on the moving cone swinging from the original position S0 to the current position S. It is also specified that the stroke is positive when pressing and negative when loosening. In Figure 4(c), it is specified that the close side direction of the moving cone is the polar axis (x axis) direction of the polar coordinate of the moving cone, and the polar angle of any point S on the moving cone is θ. The function relationship of stroke s and polar angle θ is

Where, RO is the distance between a point on the moving cone and the suspension point,

Compression ratio of each point η is

Stress of a point on the moving cone
The velocity direction and the normal stress distribution of a cross section of the moving cone at a certain moment is shown in the Figure 5.
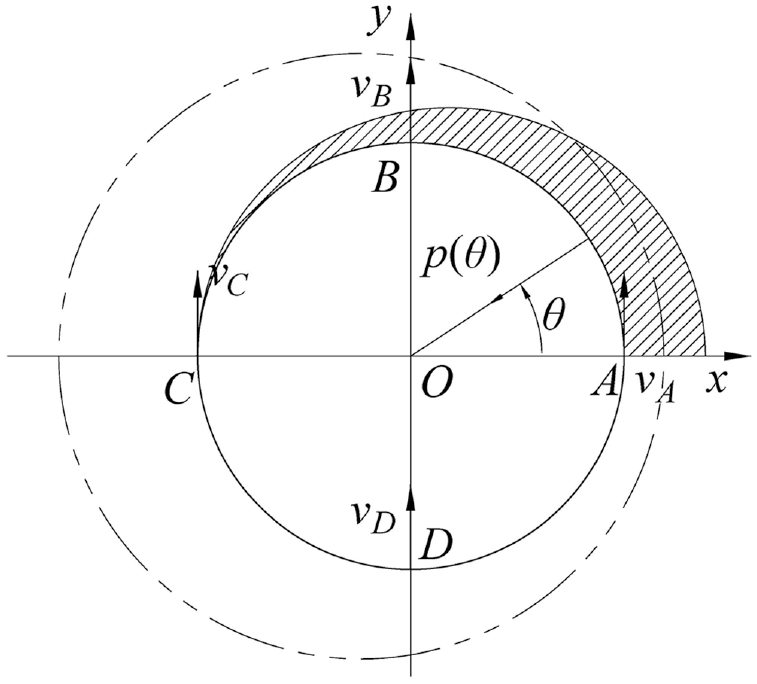
Normal stress distribution of moving cone.
From Figure 4(c), the position of the closed side is the polar axis direction of the moving cone coordinate system. Then the velocity direction of each point on the moving cone is perpendicular to the polar axis as shown in Figure 5. In the moving cone coordinate system, when
The side view of normal stress direction is shown in Figure 6.

Side view of normal stress direction.
α is the angle between the tangent line of a point on the moving cone and xOy plane. So the azimuth of the normal stress is α.
The tangential stress distribution of the moving cone is shown in Figure 7.
Tangential stress distribution of moving cone.
The tangential stress is f = μp. Where, μ is the friction coefficient. The azimuth of tangential stress is the same as the linear velocity. When
Relative velocity of any point on the moving cone and the fixed cone
The moving cone coordinate system and the fixed cone coordinate system are as shown in the Figure 8.

Coordinate system of moving cone and fixed cone.
In Figure 8, xOzf, yOzf, xOzm are xOz and yOz planes of fixed cone coordinate system and xOz plane of moving cone coordinate system respectively. When t = 0, the rotation angle between xOzf and xOzmθmf = 0, then the azimuth of the fixed cone coordinate system φmf = φp, polar angle θmf = ωt can get the moving cone coordinate system, where ω is angular velocity of moving cone. When the moving cone moves, each point on the moving cone moves around its balance point in a circle. The linear velocity of a point on the moving cone in the fixed cone coordinate system is ROωsinφp, the azimuth angle is φp, the polar angle is
Power function of a point on a moving cone
In Formula (1), the power of normal stress Pn is
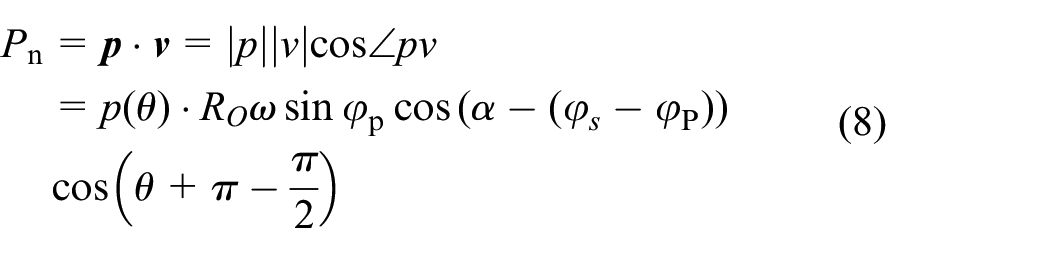
Where, φs is the azimuth of a point S on a moving cone in the spherical coordinate system of moving cone. According to the conversion of spherical coordinate to cylinder coordinate.

Then the power function of the normal stress can be expressed as a function of z and θ.

The power function of the tangential stress Pt is

Combined with Formulas (1) and (4), the power moving cone can be obtained.
Normal stress function of moving cone
In Formula (5), the normal stress is a function of compression ratio, so it is necessary to determine the functional relationship between normal stress and compression ratio. There have been some researches on normal stress (Bengtsson
22
) and the results show that the stress is a function of compression ratio and particle size distribution coefficient. However, since the experimental condition is confining pressure loading, and the influence of moving cone size and rotating speed is not considered, so the above dimensions and material parameters need to be considered and the model need to be remodelled. EDEM has been used for eccentric compression simulation. The granular material is iron ore, the critical crushing compression ratio ηc is 0.0153. The basic conditions of simulation are as follows: rotational speed nbasic=300 rpm, particle size Ed,basic=28 mm, material height hbasic=150 mm, moving cone diameter Dm,basic=1080 mm, actual compression ratio ηa,basic = 0.25, original compression thickness crbasic=110 mm. The simulation is carried out by changing one condition without changing other conditions. Under this condition, the stress pbasic = 0.7102 Mpa. The simulation results show that the functional relationship between particle size Ed, actual compression ratio ηa and original compression thickness cr and stress p can be expressed as exponential function. When rotational speed n, material height h and moving cone diameter Dm changes, p will not change significantly. For eliminating the influence of order of magnitude and dimension, the relative value of each variable are introduced. Let,

Functional relationship between stress and parameters: (a) stress and particle size, (b) stress and actual compression ratio, and (c) stress and original compression thickness.
When considering the variance of particle size, the particle size distribution coefficient σd is introduced,

Functional relationship between stress and particle size distribution coefficient.
In summary, the moving cone stress under different conditions is

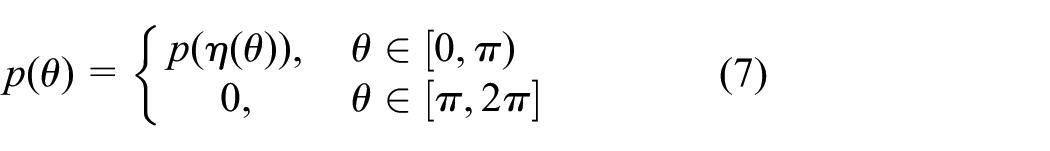
The relative stress distribution in the circumference direction is defined as pθ(θ), where

Relative stress distribution under different actual compression ratios.
The distribution of stress in the circular direction and polar angle θ can be described by exponential function, that is pθ(θ) = aexp(bθ). And
The coefficient a under different actual compression ratios.
This curve can be expressed by Formula (13)

To sum up, the stress at each point on the moving cone can be obtained. Combined with section 2.1 and 2.5, the total power can be obtained when the material is iron ore.
Effective crushing energy consumption
Single particle effective crushing energy consumption
The stress in the whole process of single particle crushing is shown in Figure 13.

Stress in the whole process of single particle crushing.
Where, ηs is single particle compression ratio, ηc is critical compression ratio, and Fs is the force acting on a single particle. When ηs < ηc, particles cannot be broken. Iron ore is brittle material. The stage of ηs < ηc can be simplified as elastic stage. The effective crushing stage is the stage of ηs > ηc. The energy consumption in the effective crushing stage after EDEM simulation is shown in Figure 14.

Energy consumption of single particle crushing process.
Where, Ws is energy consumption of single particle crushing. The particle size d = 28 mm. The energy consumption can be described by a cubic polynomial, which is proportional to the third power of particle size d, then the energy consumption of single particle crushing is
Total Effective Energy Consumption
According to previous research, 20 the probability density function of single particle compression ratio ηs with different particle sizes di under the determined actual compression ratio is lognormal distribution, that is

After EDEM simulation under the condition in section 2.6, expectation and variance of single particle compression ratio of each size can be expressed as Formula (16).

Where, Ebasic and Dbasic is expectation and variance of single particle compression ratio under the basic conditions in section 2.6, Ebasic = 7.147 × 10⁻², Dbasic = 6.473 × 10⁻⁴. So

The crushed mass fraction of particle size di is

Where f(di) is the input particle size mass distribution function.
The crushed mass fraction of the total material Mcr is

The total effective energy consumption of crushing Weff is as follows:
Where Ws is determined by Formula (14).
The total effective power of crushing Peff is

Experimental verification of power model
Taking PYGB1821 cone crusher as an example, rotational speed n = 300 rpm. After 10 times of crushing, the material is discharged. 23 Size parameters of each crushing layer are shown in Table 1.
Size parameters of each crushing layer.

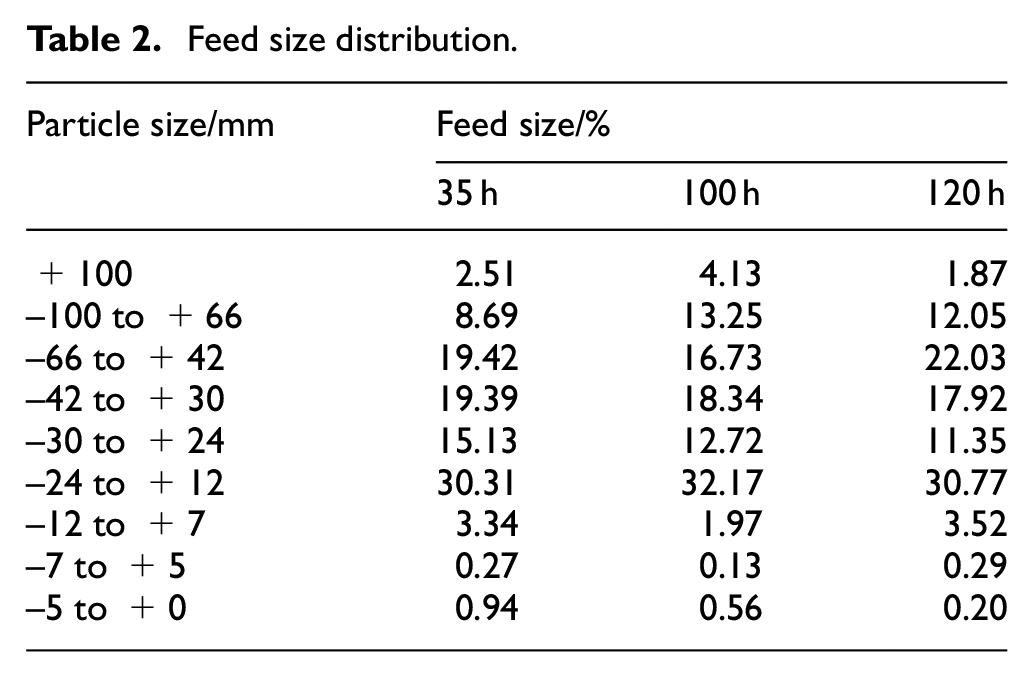
Feed size distribution is shown in Table 2. 23
Feed size distribution.
Using the parameters in Tables 1 and 2 and Formula (12)-(17), the crushed products size distribution of each crushing layer can be obtained. The flow chart of calculation of crushed products is shown in Figures 15 and 16.

Calculation flow of crushing product distribution.
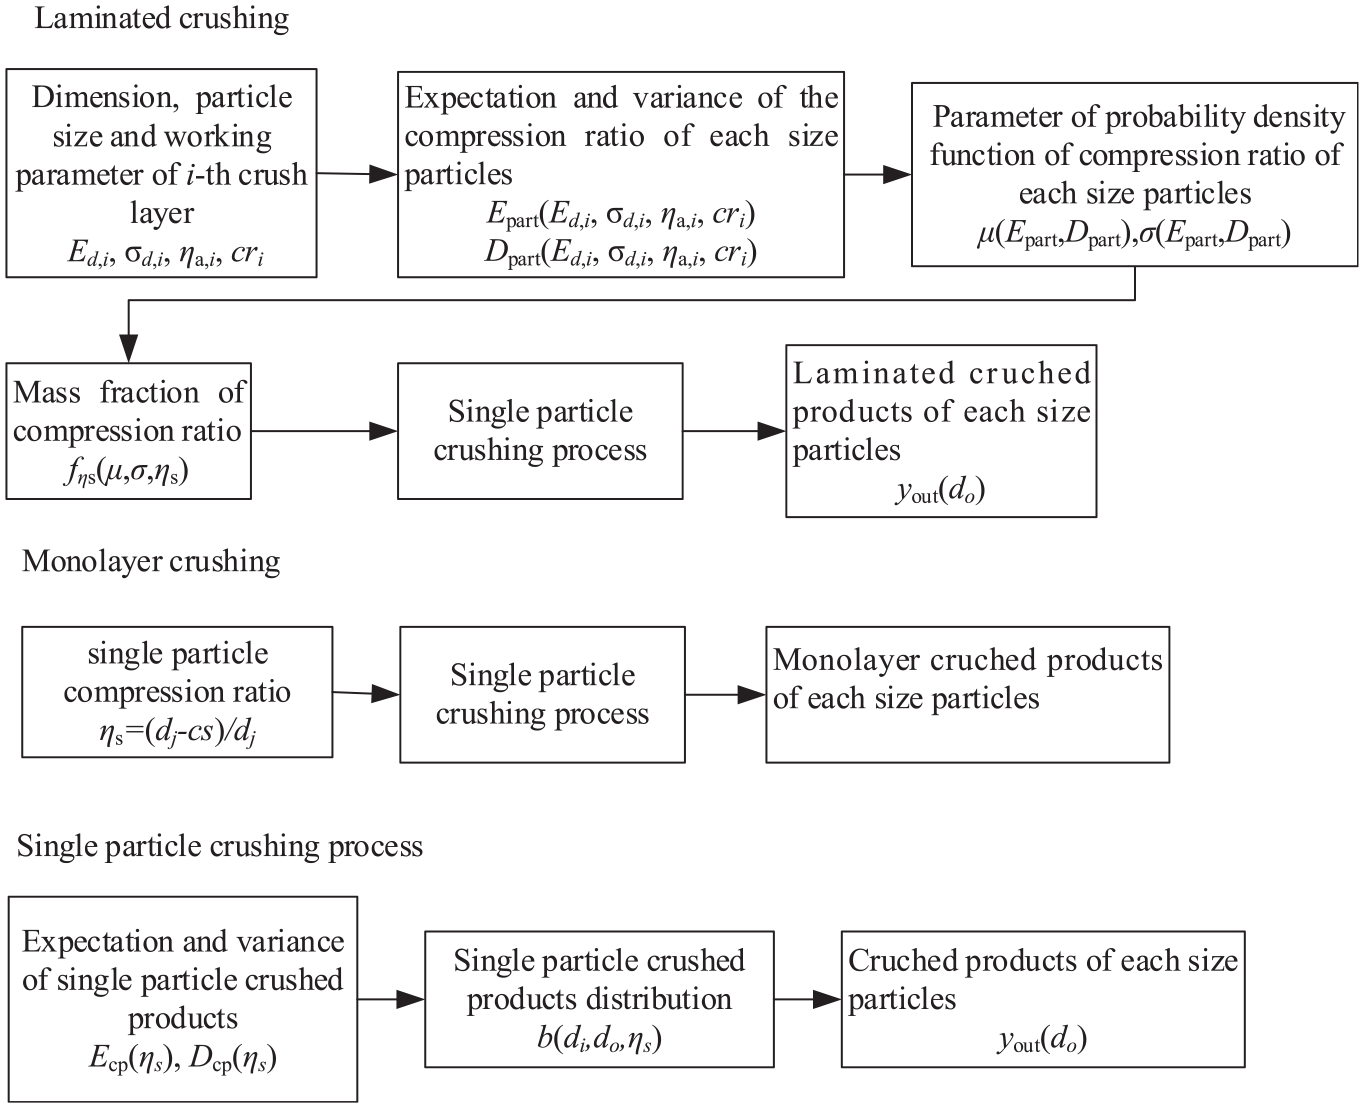
Calculation flow of laminated and monolayer crushed products.
From the above calculation process, the expectation of particle size Ed and particle size distribution coefficient σd of each crushing layer are obtained. And Ed and σd changes with z coordinate can be obtained by interpolation. As shown in the Figure 17.
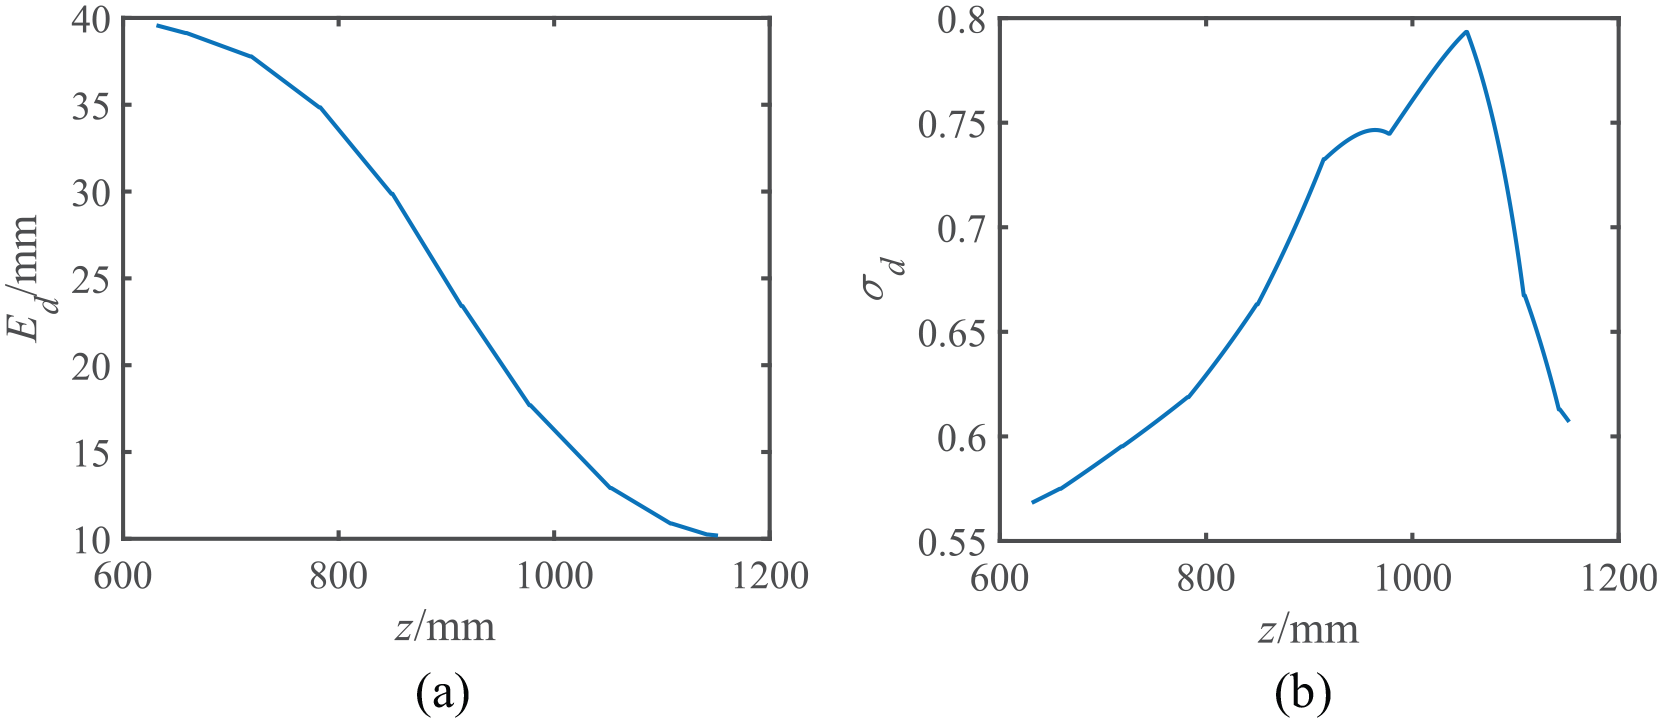
The function relationship between expectation of particle size Ed and particle size distribution coefficient σd and z coordinate: (a) expectation of particle size Ed and z coordinate, (b) particle size distribution coefficient σd and z coordinate.
The original compression thickness cr and actual compression ratio ηa changes with z coordinate as shown in the Figure 18.

The function relationship between the original compression thickness cr, actual compression ratio ηa and z coordinate: (a) original compression thickness cr and z coordinate, (b) actual compression ratio ηa and z coordinate.
According to the Formula (10)–(13), and Figures 17 and 18 the power of each point at different z coordinate and polar angle θ can be obtained as shown in the Figure 19.

The power of each point at different z coordinate and polar angle θ: (a) power of normal force Pn., (b) power of tangential force Pt, and (c) total power P.
From Section 2, theoretical total energy consumption per hour Wsum=158.0 kW. From Section 3, theoretical effective energy consumption 34.15 kW. To verify the model of energy consumption, industrial experiments were conducted on a PYGB1821 cone crusher at Anshan Iron and Steel Group Mining Co., Ltd. (Anshan, China). Energy consumption, feed size distribution, and structural parameters of the crushing chamber were measured. The actual average hourly energy consumption of empty-load is 241.06 kW, average energy consumption of full-load is 386.85 kW, maximum energy consumption of full-load is 424.33 kW, and minimum energy consumption of full-load 360.04 kW. So The actual average total energy consumption per hour is 145.79 kW, maximum total energy consumption 183.27 kW, minimum total energy consumption 118.98 kW. 4 The relative error is 8.38% compared with the theoretical value.
Establishment of optimization function and optimization results
The purpose of optimization is to minimize the total energy consumption per hour Wsum, mass fraction of crushed products below 12 mm M12, the energy consumption ratio ηW = Weff/Wsum, and the throughput V. By adjusting the rotational speed n, the precession angle φp, and the relative position of the suspension point O’ (the reference is the suspension point position of PYGB1821 cone crusher), the crushing effect can be optimized, so the optimization function is established as follows:

M 12, Wsum and ηW cannot be expressed as analytic formula. The numerical solutions under different conditions are shown in the Figure 20.
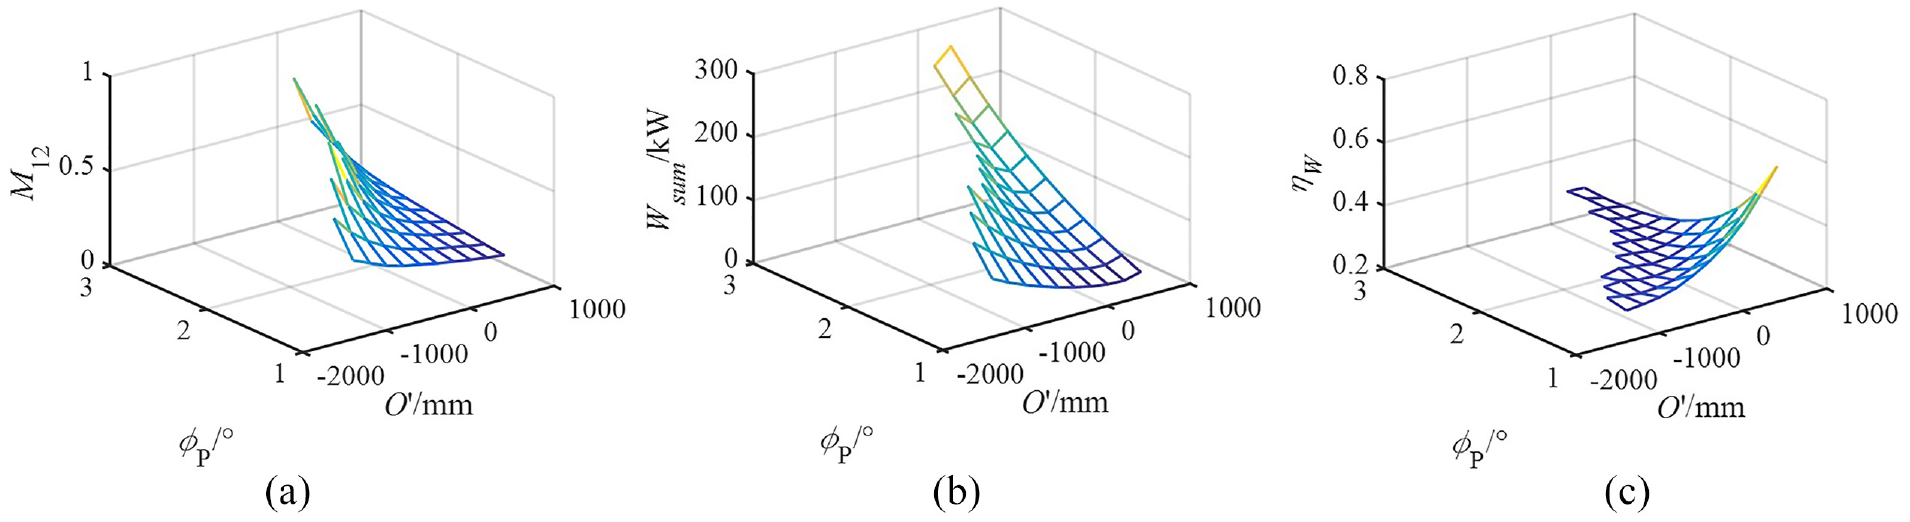
The numerical solutions of M12, Wsum and ηW under different conditions (n = 340 rpm): (a) M12, (b) Wsum, and (c) ηW.
The range of variables is as follows, −1600 mm ≤O’≤ 400 mm, 1°≤φp≤ 3°, 240 rpm ≤n≤ 340 rpm. There is a large difference in the order of magnitude of the calculation results of each objective function, so the optimization results need to be dimensionless. Based on the working conditions of PYGB1821 crusher under full load, the rotational speed n = 300 rpm, and the precession angle φp = 2.5°, and the relative position of suspension point O’ = 0 mm. Under the circumstances, M12,basic=0.6285, Wsum = 158.0 kW, ηW,basic = 0.2247. Let

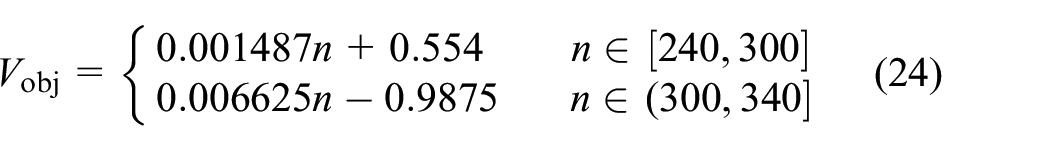
Previous studies 10 have shown that when the rotational speed n = 340 rpm, throughput V is 1.265 times of that at 300 rpm. When the rotational speed n = 240 rpm, the throughput is 0.9108 times of that at 300 rpm, which can be expressed by piecewise linear function, that is
Taking 340 rpm as an example, using the genetic algorithm in MATLAB, the non-inferior solutions and Pareto front are shown in Figure 21.

Optimization calculation results: (a) non-inferior solutions, (b) Pareto front.
The weighted method is used to verify the solutions. Formula (23) is transformed into

Where ki is the weight of each optimization objectives. In theory, there are infinite solutions about weight, and there is no algorithm to solve the general Pareto optimal solutions for all possible weightings. 24 When the preference is different, the weight will take different value. Taking the same importance of each optimization objective as an example, that is, k1= k2= k3 = k4 = 1. The optimal solution is n = 340 rpm, φp = 1.22°, O’ = −1595mm, and M12,basic = 0.7468, Wsum = 161.57kW, ηW = 0.3065, Compared with PYGB1821 at full load, mass fraction of crushed products below 12 mm increased by 11.83%, total energy consumption of the same throughput reduced by 19.16%, the energy consumption ratio increased by 8.18%, throughput increased 26.5%.
Conclusion
The control optimization method of cone crusher is put forward, taking total energy consumption, mass fraction of crushed products below 12 mm, energy consumption ratio, and throughput as the optimization objective, the position of suspension point, rotational speed and precession angle of the moving cone as the independent optimization variables, and size of chamber as the constraint, the optimization function is established.
Based on the existing research results, the energy consumption model of 6-DOF robotic crusher is established. The experimental energy consumption data of PYGB1821 cone crusher are used to verify the theoretical energy consumption. The error of calculated theoretical energy consumption and the experimental value is within 10%.
Compared with the traditional cone crusher, under the same chamber size and particle size distribution, mass fraction of crushed products below 12 mm increased by 11.83%, total energy consumption of the same throughput reduced by 19.16%, the energy consumption ratio increased by 8.18%, throughput increased by 26.5%, which can effectively reduce the energy consumption and improve the crushing efficiency.
The results in this paper are related to the size parameters, working parameters and material parameters of the crusher. The calculation model can be extended to the intelligent control and design calculation of other crushing equipment such as jaw crusher disc roller mill and high pressure roller mill.
Footnotes
Handling Editor: James Baldwin
Declaration of conflicting interests
The author(s) declared no potential conflicts of interest with respect to the research, authorship, and/or publication of this article.
Funding
The author(s) disclosed receipt of the following financial support for the research, authorship, and/or publication of this article: This work was supported by the National Key Research and Development Program of China (no. 2016YFC0600805).