
Abstract
In order to study the mechanical properties of new iliac vein stents in different stenotic vessels, the release process of four stents in iliac vein with different stenosis rates (normal, 30%, 50%, 70%) was simulated by finite element method, the influence of stenosis rate on the mechanical properties of stents was analyzed, and the safety of stents was verified by animal experiments. The results showed that the high stress-strain regions of the four stents were all located in the stenosis area. With the increase of the stenosis rate, the equivalent stress and elastic strain of the stents tended to increase. After fatigue calculation, the safety factor of the fatigue strength of the stent is more than 1, which meets the requirement of 10 years fatigue life. To establish an animal model of iliac vein stenosis, the endothelial cells were covered on the surface of the stent 90 days after stent implantation, the intima was proliferated obviously, and the mechanical properties and biocompatibility of the stent were stable. The new type of stent for iliac vein stenosis could be used as the main experimental instrument in later animal experiments.
Introduction
Iliac Vein Compression Syndrome (IVCS) is a disease that causes the left iliac vein to be compressed and stimulated by the posterior lumbosacral vertebra and the anterior right iliac artery. This can result in a chronic injury, adhesion and also narrow the vein. The appearance of stent implantation provides a safe and effective treatment for patients, so it is a good option for clinical practice, adopted by doctors and applied in. 1
The process of finite element analysis of dilation process after stent implantation into stenotic vessels has been a hot topic among the medical community. Lei et al. 2 proposed a finite element model considering both atherosclerotic plaques and physiological deformations. Moreover, the fatigue behavior of stents under different conditions was quantitatively and qualitatively analyzed by four comparisons, 2019. Meoli et al.3–5 analyzed the fatigue behavior of Ni-Tinol stents subjected to cyclic axial compression and bending during full dilation and deployment. This process of examination, helped to find that the interaction between stents and blood vessels must be considered, and the excessive dilation of stents and blood vessels should not be neglected, 2012 to 2014. Dordoni et al.6,7 evaluated the effect of atherosclerotic plaques on the anti-fatigue performance of stents by defining three models of stenotic arteries with different plaque sharpness and stenosis rate, also adding to the process a periodic axial compression and bending deformation. It was found that plaques played an important role in predicting the fatigue life of stents, 2014 to 2015.
Later on, Murphy 1 shone a light at the current problems of vein stent technology in the United States, compared the four existing vein stents in the American territory and designed an experimental design of Investing Device Exemption, 2019. Feng et al.9,10 also studied the fatigue behavior of iliac vein stent in different scales of normal blood vessels, and verified the safety of the stent by theoretical study and experiment. The studies showed that fatigue strength of stent is affected by material, structural size, dilatation ratio and pulsatile circulatory load, but also pointed out that the effect of vascular stenosis on fatigue strength cannot be ignored, 2018 to 2019.
At present, there are many studies on arterial stenosis due to atherosclerotic plaques, but a study on stent implantation for venous stenosis using compression has not yet been reported. For this research, the deformation behavior and mechanical properties of a new type of iliac vein stent with different diameters were studied by finite element method, and the safety of the stent was properly verified by animal experiments, providing a new scientific reference for further clinical treatments.
Materials and methods
Geometric model
The central object of study is a new Ni-Ti alloy stent11,12 for iliac veins, mainly composed of a dense grid structure that can be used to deal with the obstruction of the vein compression, and can greatly reduce the incidence of thrombosis. The whole stent consists of three parts: positioning section, central support section and terminal support section. A sparse corolla structure was arranged at the front end of the stent, and a developing mark is set at the connection between the corolla and the central support unit with small mesh. The central unit has high supporting force and the terminal unit has increased levels that help to reduce the damage of the stent to the vein wall. The stent has a unique structure, multi-specification diameter design and, therefore, can meet the needs of different patients. The bracket part has four specifications, with diameters of 10, 12, 14, and 16 mm, rib width of 0.16 mm, and wall thickness of 0.22 mm, as shown in Figure 1.

Stent configuration: (a) the appearance of stent, and (b) the unfolded plane geometry of stent.
The ideal iliac vein model was constructed using Solidworks 2016, a type of three-dimensional modeling software. Based on clinical 1.1 × diameter ratio release experience, the diameters of iliac veins were 9, 10.8, 12.6, and 14.4 mm. The structures of the four blood vessels were basically the same and each vessel had four different stenosis rates – normal, 30%, 50%, and 70%, as shown in Figure 2. Iliac vein stenosis is caused by compression and has nothing to do with the plaque, so the vascular parameters are consistent, different from the narrowing effect caused by atherosclerotic plaques.13–15 The rate of vascular stenosis is calculated with the percentage of vascular area, not the percentage of diameter, respectively, and the vessel thickness was set to 1 mm. To facilitate comparison and calculation, the models were numbered differently, for example, S10-0 indicated that the stent with a diameter of 10mm was released into the normal vessel and S10-30 indicated that the stent with a diameter of 10 mm was released into the vessel with a stenosis rate of 30%. The system model is displayed in Figure 3.

Four stenosis rates of vessels: (a) iliac vein, (b) normal, (c) 30%, (d) 50%, and (e) 70%.
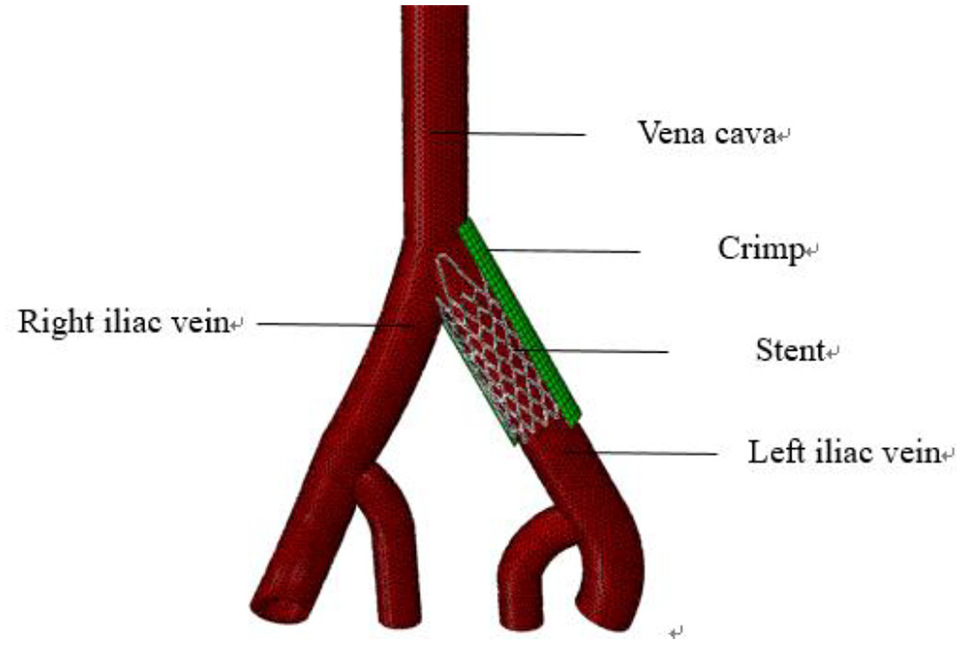
Figure of stent system.
Material properties and mesh generation
Ni-Ti alloy was selected as the scaffold material, the Poisson’s ratio was set at 0.33, and the stress-strain curve of Ni-Ti alloy obtained by uniaxial tension test. Figure 4 depicts the stress–strain curve obtained by the uniaxial tensile test of the nitinol tube specimen, where the tensile test data were fitted with a blue curve, also used in the further FEA (Finite Element Analysis). The vascular materials16,17 had to be linear and isotropic, with an elastic modulus of 1.75 MPa, the clamping shell ideally also linear and isotropic, with an elastic modulus of 300 MPa, and, finally, the Poisson’s ratio of the vessel to the clamping shell was set to 0.499.

True stress-strain curve of nitinolalloy specimens in uniaxial tensile test.
The results of numerical simulation are often affected by mesh quality, density and quantity. Therefore, it is necessary to find a suitable mesh size that can reduce the calculation time and obtain accurate results. In this grid independence test, the mechanical properties of S12 stent after release in normal vessels were taken as an example to find the appropriate grid cell size. When dividing the grid, the maximum element size of the grid was selected as 0.15, 0.2, 0.3, 0.4, 0.5, 0.6, and 0.7 respectively, and then the maximum strain and maximum stress are taken as indicators for finite element analysis.
Table 1 shows that maximum grid size from 0.15 to 0.7 in the process, reduced the grid number and also the reference index of the maximum strain and the maximum stress. When the grid maximum ranged between 0.15 and 0.3, the maximum strain and maximum stress basically became stable, so the new iliac vein stenting could reduce the calculation time, in the calculation of the mechanical properties of different vascular biggest unit size to choose the most suitable 0.3. But, at the same time, it could also get more accurate calculated value, making full use of computer resources.
Grid independence checklist.

The stent and vascular models were imported into Hypermesh 13.0 software for mesh generation. The structure of the scaffold model was a regular symmetrical body, and hexahedral element was used to divide the grid (C3D4R). The structure of the vascular model was irregular, and the meshes are divided by dense tetrahedral elements, also the C3D4R one. The grid division of the stent and vessel is shown in the Figure 5.

Grid division of stent and vessel: (a) grid division of stent, and (b) grid division of vessel.
Finite element model
For the aims of this research, the explicit solution module of ABAQUS finite element software was used to display the dynamic analysis of the support system since it can effectively simulate the large deformation and nonlinear problems. The process of iliac vein stent implantation involves the non-linear coupling among the shell, the vessel and the stent. Based on the generalized variational principle and penalty function method, the dynamic and kinematic constraints of the contact problem are considered as the impenetrability condition, and the equivalent form of the calculation model of the iliac vein stent interventional coupling system is established9,18 as:

Where

In the equation,
In the formula,
Boundary conditions and simulation steps
For the purpose of this research, the influence of blood was not considered as well as the fluid variable pressure and shear stress. According to relevant literature,19–21 blood vessel bifurcation and stenosis may be related to pressure and shear stress, and have a primary role in LDL deposition also under the presence of a stent. 22 However, the experimentation is mainly focused on the mechanical properties of stents.
The mechanical properties of iliac vein stent in stenotic vessels were simulated numerically and the results were divided into three steps.
The first one was the stent radial grip, when the radial compression displacement of the grip shell was set, the upper ends of the stent and the grip shell were fixed, the freedom of circumferential and three rotational directions was limited, and the diameter of the stent became smaller after the radial compression of the grip shell.
After that, the stent in the stenotic vessel was released by implanting the press-grasped stent into the stenotic vessel, and removing the press-grasped shell to make the stent naturally rebound. Six degrees of freedom of the inlet and outlet of the vessel have to be fixed and it limited the upper end of the stent, prevented axial runout of the stent, and did not limit the circumferential, radial and three degrees of freedom of rotation.
The last step was to apply a variable load by putting a pulse circulate load on that inner surface of the stent. During the step, the blood pressure of the iliac vein was 3 to 9 mmHg, and the pressure was 0.0004 to 0.0012 MPa. For the accuracy and authenticity of the analysis result, the periodic loading process had to be cyclic. The detailed simulation process is explained in Figure 6.

The simulation process: (a) assembly of the stent and crimp, (b) process of stent crimped, (c) stent crimp completed, (d) stent implanted into the vessel, (e) stent released in vessel, and (f) applied load.
Evaluation indicators
When evaluating the strength of Ni-Ti alloy stent, the maximum equivalent stress and maximum elastic strain of the stent exceed the stress-strain limit of Ni-Ti alloy super elastic material. It is known from other concepts of the area23–25 that the stress-strain data obtained from uniaxial tensile test of Ni-Ti alloy show that fracture failure may occur if the strain value exceeds 12%.
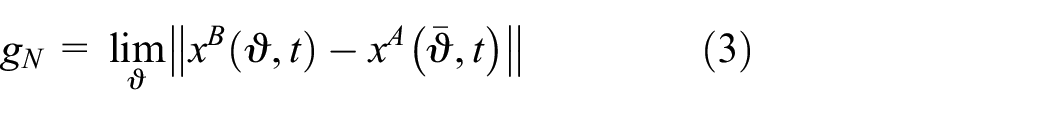
Using the method proposed by Python,
2
the logarithmic strain of each Gaussian point is extracted, the maximum strain


Because of the fatigue strain limit, the Goodman curve is not suitable for evaluating the fatigue strength of Ni-Ti alloy.
26
Therefore, the fatigue life limit curve proposed by Pelton27–29 for a period of 10 years, under sub-cyclic loading unloading for
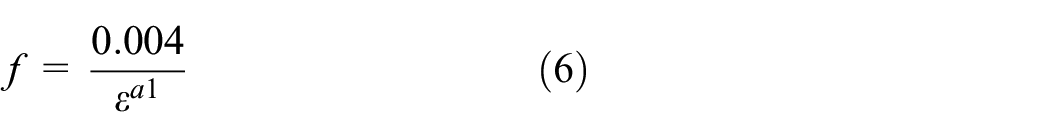
The next step was to calculate safety factor by equation (6).
30
A safety factor
Animal experiments
Balloon angioplasty and stent implantation for iliac vein stenosis were performed on the 30th day after operation and the process of bilateral iliac venography was done the 14th, 30th, 60th, and 90th day. As a result, stent performance, thrombosis, contralateral iliac vein thrombosis, loss of stent lumen and rate of stent lumen loss were some of the phenomena observed after this period. At the end of the experiment, the target vessel was taken out, and both the histological structure, inflammatory reaction, intimal thickness, lumen area, inner elastic plate area and in-stent restenosis rate were observed after staining. The mechanical properties and biocompatibility of the new stent for iliac vein were then finally evaluated.
Results and discussion
Elastoplastic behavior of support
The iliac vein stents were pressed and released into the vessels with different stenosis rates, and the elastic strain of the stents closely analyzed. The stenosis rates marked 0%, 30%, 50%, and 70%, respectively. The maximum elastic strain of the stents was shown in Figure 7. The stents were also compressed from 10 mm, 12 mm, 14 mm, and 16 mm in diameter to 3 mm, and then released into the stenotic vessels of 9 mm, 10.8 mm, 12.6 mm and 14.4 mm in diameter. In this case, the stenosis rates were 0%, 30%, 50%, and 70%, accordingly.

Stress-strain changes of four stents crimp and release in iliac vein: (a) the process of S10 stent crimped and released, (b) the process of S12 stent crimped and released, (c) the process of S14 stent crimped and released, and (d) the process of S16 stent crimped and released.
As can be seen from Figure 4, the stent was radially compressed during the period of 0 to 0.01 s, and the stent released during the period of 0.01 to 0.02 s in different stenotic vessels. During radial compression, the maximum elastic strain increased, when the four supports are pressed to 3 mm, hitting maximum change rates of 5%, 8%, 6.7%, and 6.5%, respectively. After releasing the stent, the maximum elastic strain increased with the increase of stenosis rate. The maximum elastic strains were 1.85%, 2.77%, 3.53%, and 3.79% after S10 stent release but when the S12 stent was released, the maximum elastic strain hit 1.87%, 5.22%, 6.63%, and 9.40%, respectively. Additionally, the maximum elastic strains of S14 were 1.92%, 3.66%, 5.04%, 7.74%, and for S16 the rates were 2.63%, 3.83%, 4.98%, 11.23%.
Since the stent was not affected by the stenosis of the vessel during radial compression, the stress-strain relationship of the stent during radial compression basically remained the same. The maximum equivalent stress and maximum elastic strain of the stent fluctuated due to the stenosis rate of the stent during the simulated releasing process; because the stent is gradually unfolding and it presented slight jumping movements. Influenced by the stenosis rate, the maximum equivalent stress and maximum elastic strain of the stent tended to increase, since the cross-sectional area of the stenosis site was smaller than that of the normal site. So, the larger the stenosis rate was, the smaller the cross-sectional area was, creating a greater the deformation of the stent at the stenosis site.
Stress and strain of bracket
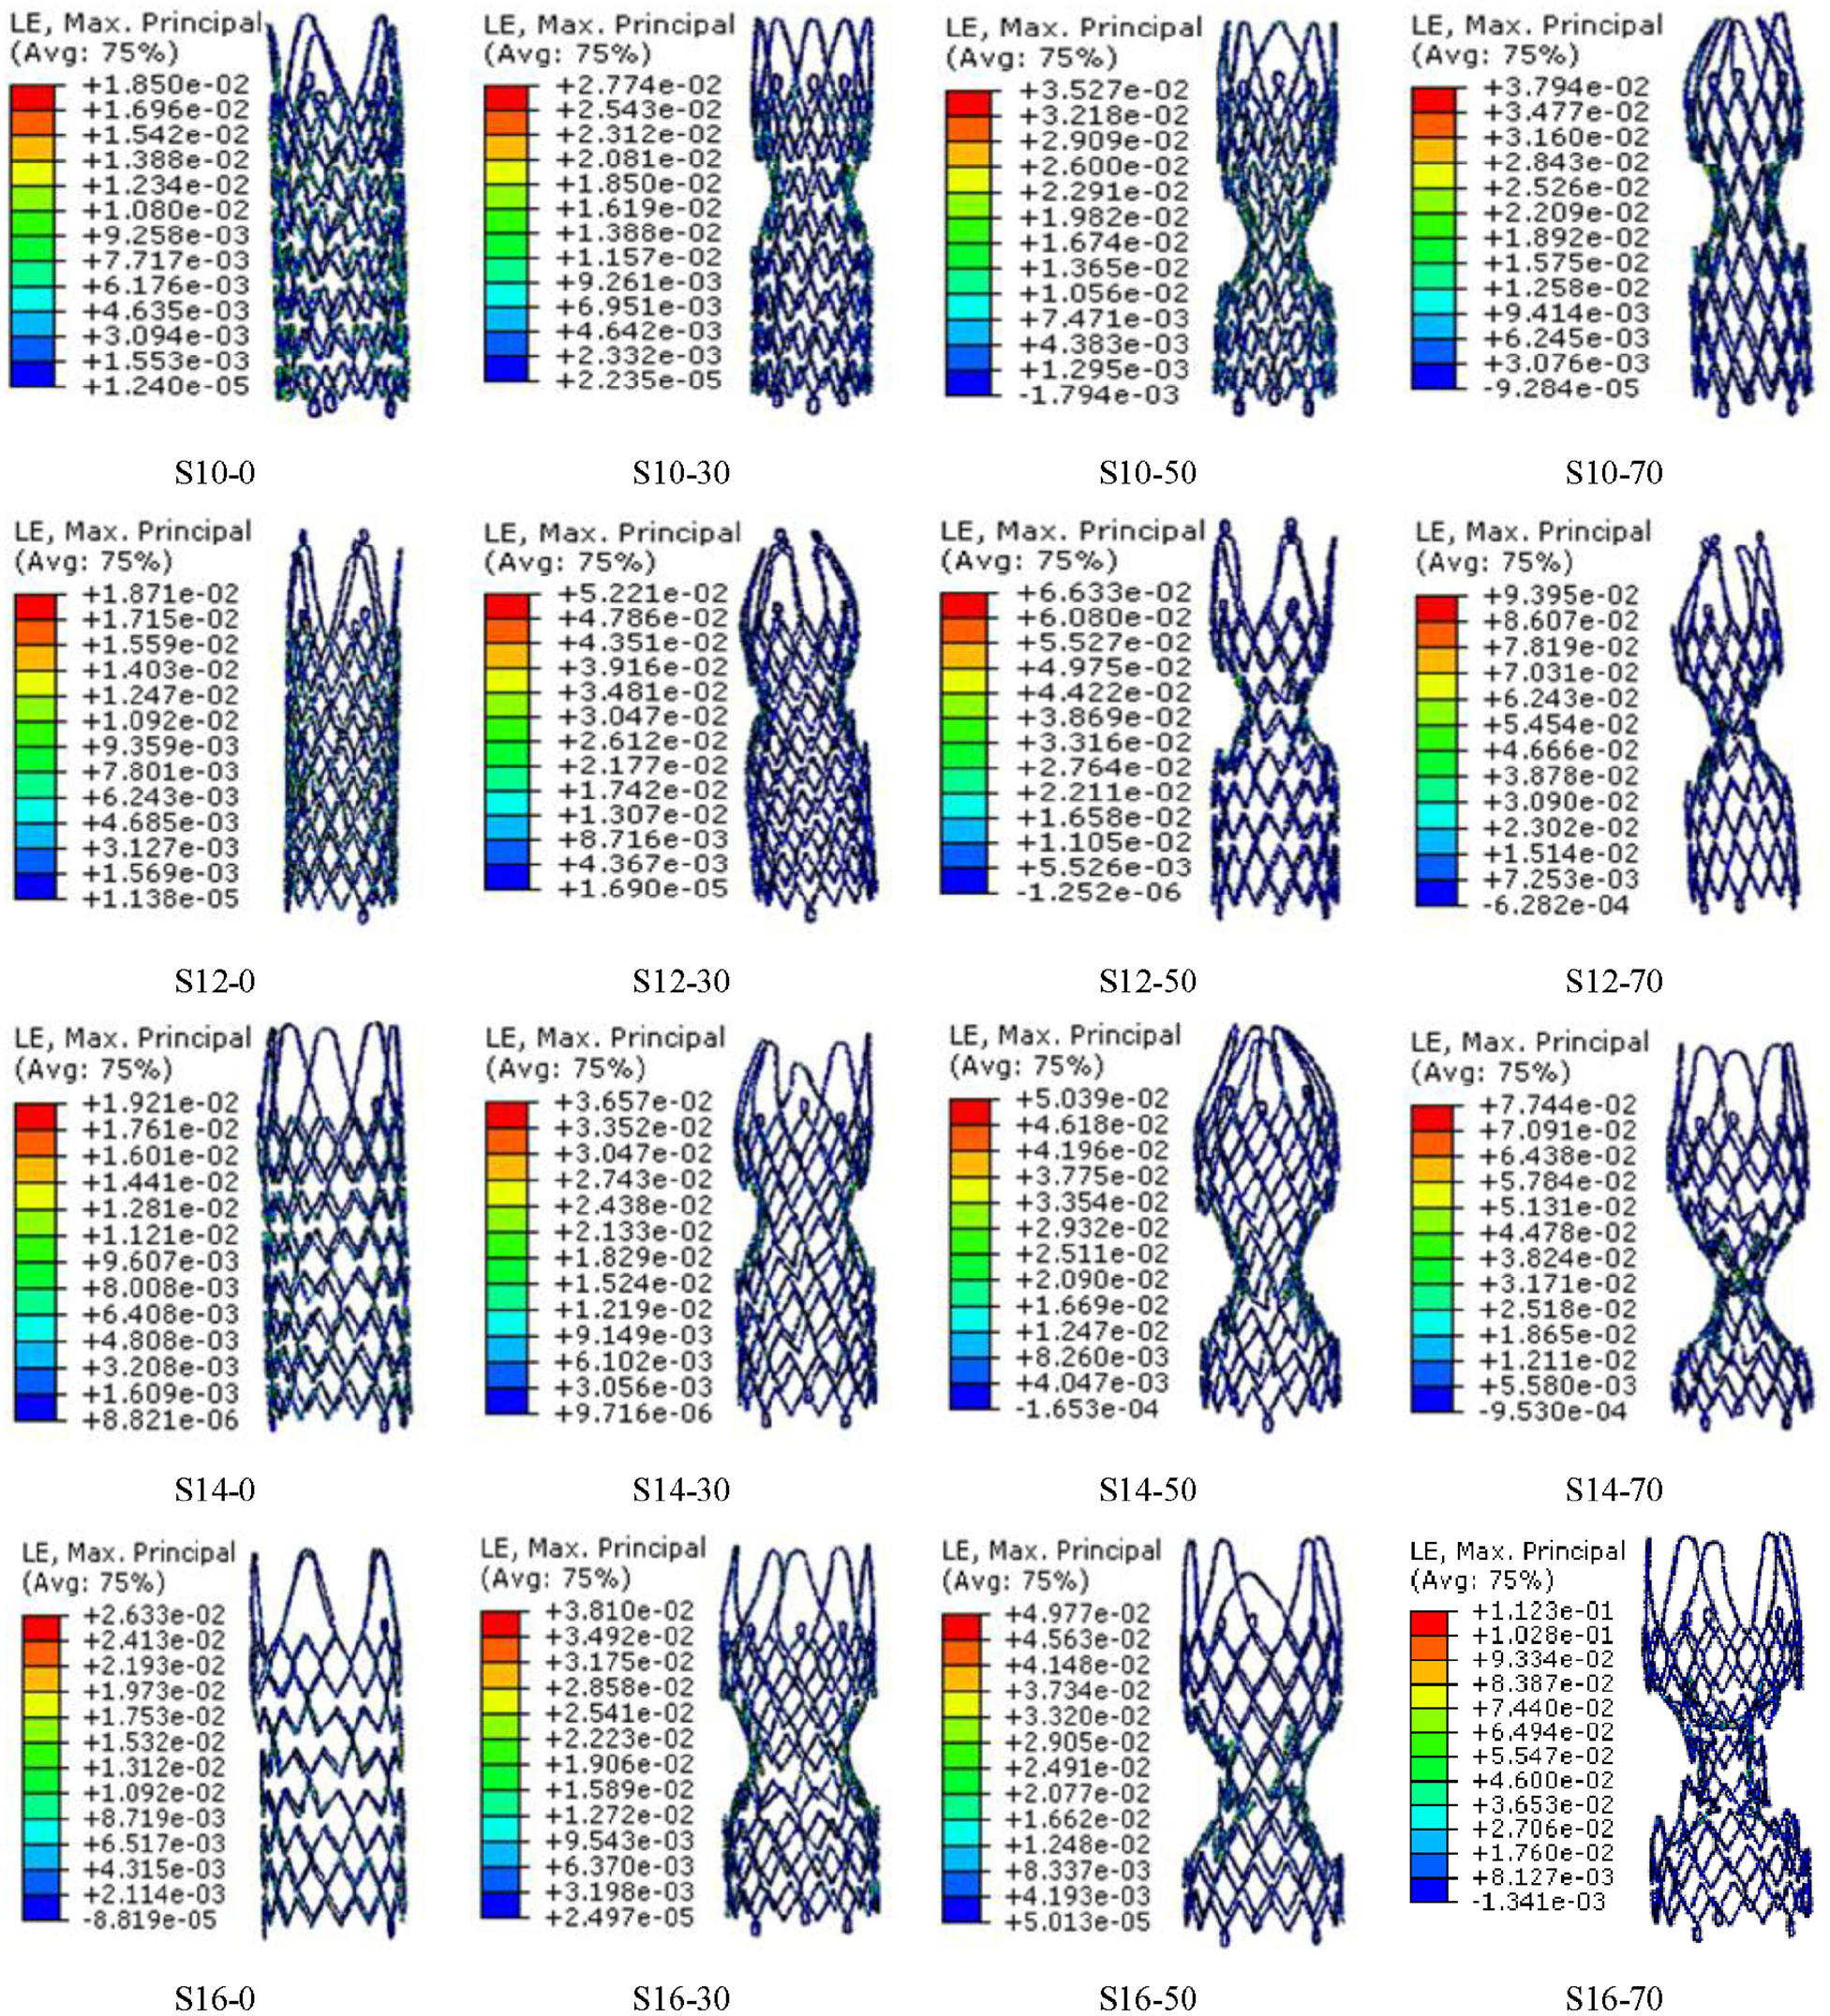
When it comes to the sum of stresses, it shall be proportional to the elastic range of the material. Therefore, the effect of stenosis rate on the mechanical properties of stent was analyzed with the strain after stent implantation as an index. The complete elastic strain profiles of the four stents released in different stenosis rates are shown in Figure 8.
Equivalent elastic strain of the stents.
As can be seen from Figure 8, the strain of the stent after release in normal blood vessels is relatively uniform, but after being released in the stenotic blood vessels, a “dog bone effect” occurred, so that the strain distribution of the stent is not uniform. A high strain region occurred in the stenotic blood vessels, and the elastic strain in that case was relatively high in the inner and outer sides where the stent support rod intersects the arc segment. The stent’s length after being released in normal blood vessels was slightly longer than that before implantation, but it was slightly shorter with the increase of stenosis rate. Therefore, the stenosis rate not only affected the mechanical properties of the stent, but also affected the length measures.
Figure 9 shows that the maximum equivalent stress and maximum elastic strain of the four stents increased directly as the stenosis rate also boosted. The maximum strain of stent S10, S12, S14, and S16 were 1.85% to 3.49%, 1.87% to 9.395%, 1.92% to 7.744%, and 2.63% to 11.23%, appropriately. The stress ranges of the four stents in different stenotic vessels were observed and showed different ranges.

Comparison of maximum elastic strain of four stents in different vessels. (a) maximum stress of 4stents in difference stenotic vessels, and (b) maximum strain of four stents in difference stenotic vessels.
S10 in a 9 mm diameter vessel was between 21.96 M and 45.36 MPa, and the stress distributions of the stents S12, S14, and S16 had the same tendency. Adding to that, the maximum strain of the stents S10, S12, S14, and S16 were between 21.96 and 45.36 Mpa, 22.20 and 117.5 MPa, 22.73, and 97.32 MPa also 31.21 and139 MPa, respectively. When the stenosis rate was the same, the maximum equivalent stress and maximum elastic strain showed no obvious change with the increase of stent diameter because of the different diameter of the four types. Due to the influence of the stenosis rate, the stent is not fully deployed in the stenosis and that lead to a larger deformation at the arc and the top of the support rod, but neither of them exceeded the stress limit of Ni-Ti alloy, showing that a fracture failure might not occur.
Fatigue strength of support
According to equations (4) and (5), the 10-year fatigue limit diagram of four new iliac vein stents is closely explained in Figure 10.
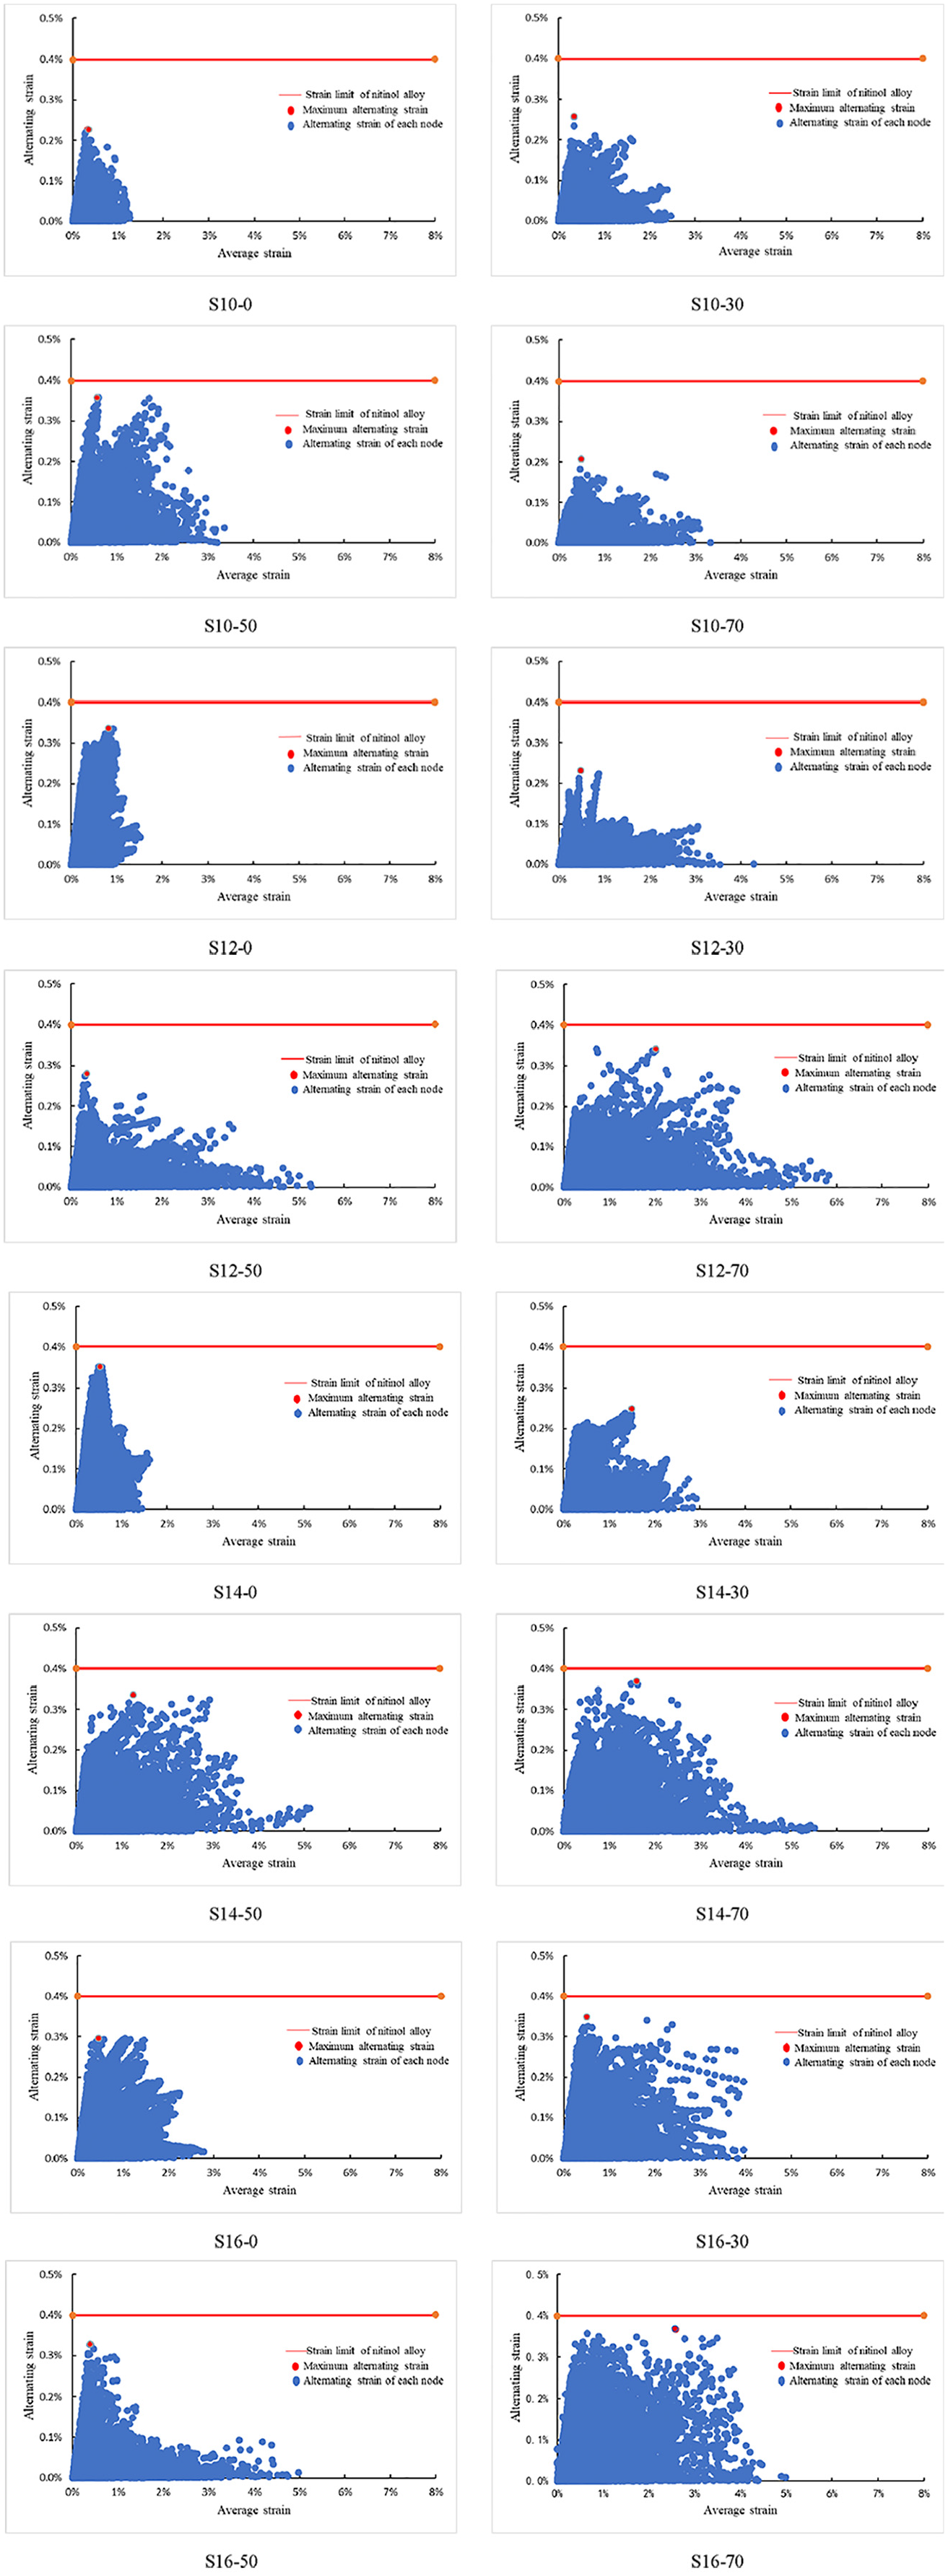
Ultimate strain line diagram of stent fatigue strength.
After four stents were released in different stenotic vessels, the alternating strain of all the stent joints was less than 0.4% of Ni-Tinol’s fatigue limit under pulsatile cyclic loading.
The safety factor for the most dangerous node of each bracket according to Equation (6) was calculated and this operation is detailed in Table 2. The safety factor of all supports was greater than 1, indicating that each support can meet the fatigue strength requirements under the continuous pulsating load and has a fatigue life of more than 10 years.
Safety factor of stents fatigue strength.

From the view of the safety factor of stent, there no changed rules were observed, showing that there is no link between the stenosis rate and the safety factor. The most dangerous points of the stent are mainly distributed in the maximum stenosis, as displayed in Figure 11. The main reason is that the deformation of the stent stenosis is very complicated when calculating the fatigue strength, so the strain change at the stenosis is larger than the normal position, resulting in the alternating strain value becoming larger. Consequently, the calculated safety factor was smaller, but both of them were than 1.
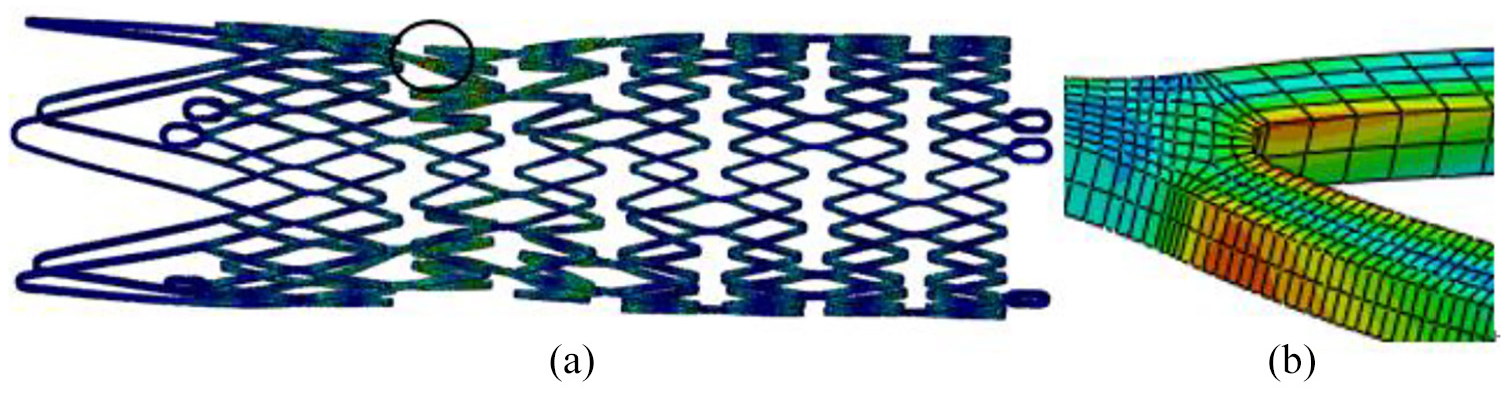
The most dangerous area of stents: (a) integral diagram of stent after loading, and (b) local enlargement of dangerous area.
Findings in animal experiments
It is noteworthy that this Animal Experiment of Iliac Vein Stent System has been reviewed and approved by the Ethics Committee of Soochow University (ECSU). The approval number is ECSU-201800065.
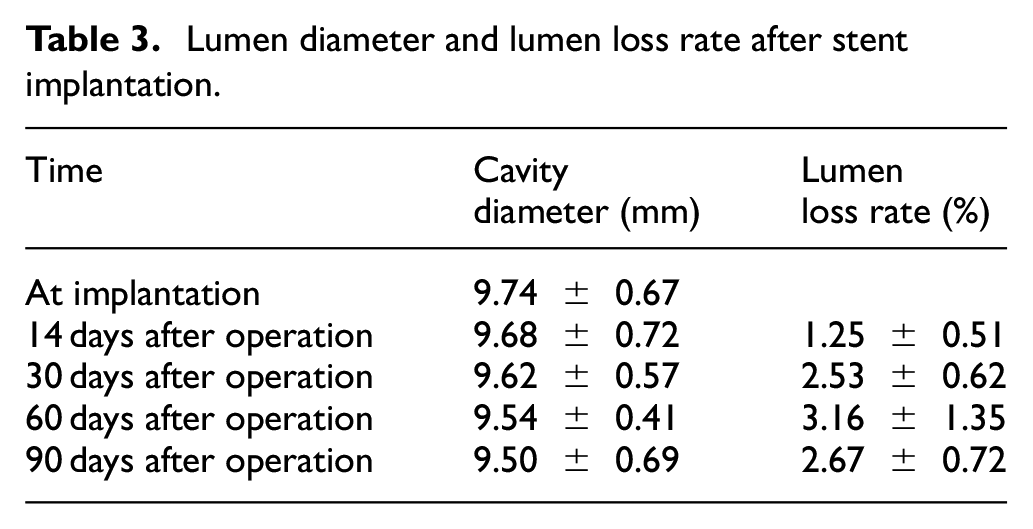
None of pigs have been registered dead before and after the experiment. The success rate of operation was 100%, 6 stents were implanted, the diameter magnification of stents was not significantly divergent (p > 0.05), the diameter of iliac vein and blood samples were not significantly different before and after operation (p > 0.05) and also stent displacement and stent rupture were not found. The stent lumen loss, stent lumen loss rate, intimal thickness, lumen area, inner elastic plate area and in-stent restenosis rate didn’t differ as well (p > 0.05), and the detailed information is shown in Table 3. The intimal hyperplasia was significant only on the 90th day after stent implantation. The endothelial cells on the intimal surface were arranged neatly and monolayer non-columnar and a large number of vascular smooth muscle cells proliferated beneath the endothelium. The extracellular matrix increased highly, and a small number of lymphocytes and monocytes infiltrated. In some areas, the media atrophied or the structure was unclear. There were many vascular smooth muscle cells, fibroblasts and collagen fibers around the wire mesh. The adventitia connective tissue thickened, as Figures 12 and 13 show. Figures 12 and 13 fully illustrate the true changes of the intima, media and adventitia after 90 days of stent implantation.
Lumen diameter and lumen loss rate after stent implantation.

Target vessel specimen H-E dyeing slice (Left × 40, Right × 100).
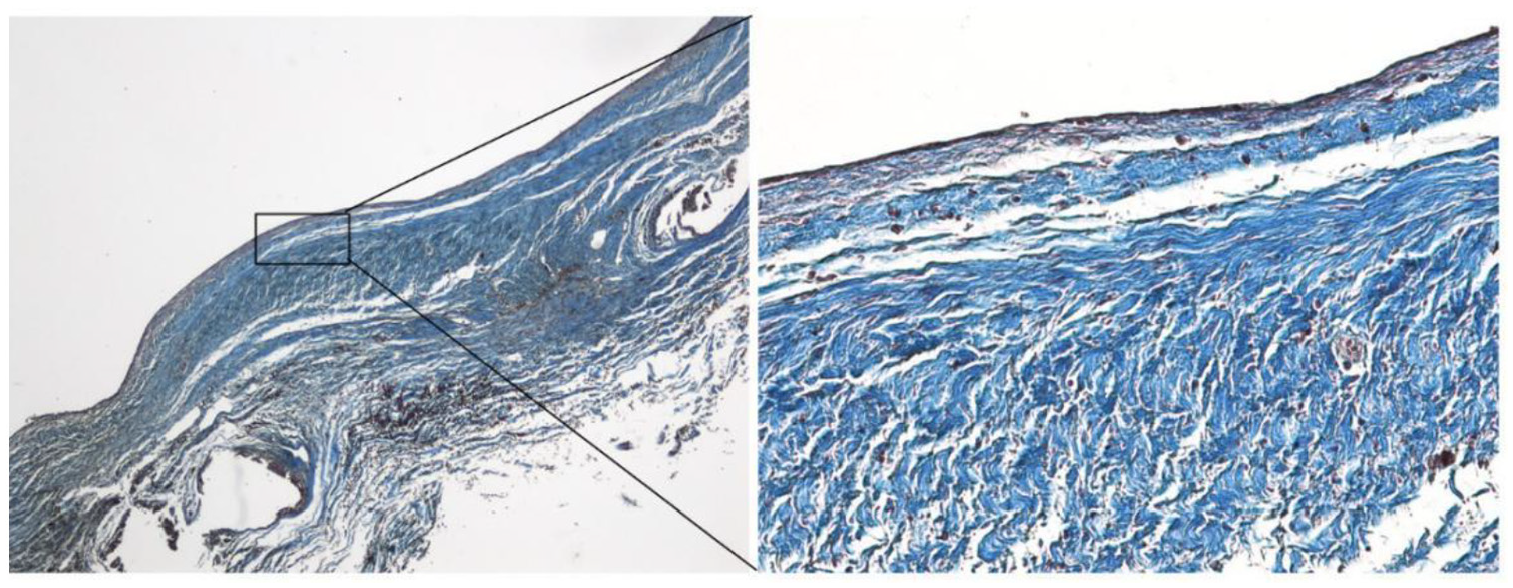
Target vessel specimen MASSON dying slice (Left × 40, Right × 100).
Conclusion
After the experimentation, it was possible to conclude that finite element method (FEM) can simulate the stress behavior, deformation behavior and fatigue behavior of stent release in different stenotic vessels, and the results are verified by animal experiments.
The first relevant finding is that when the stent is released in the stenotic vessel, with the increase of the stenosis rate, the equivalent stress and elastic strain of stent will also increase. The maximum equivalent stress and elastic strain of stent will than appear at the maximum stenosis. So, it is viable to affirm that stenotic vessel has a significant impact on the safety of stent, and the stent implantation causes some damage to the intima.
Furthermore, the fatigue strength analysis showed that all stents could meet the 10-year life requirement under different stenosis rates, and the most dangerous point of stent is the maximum stenosis, proving that the stenosis rate has a significant effect on the fatigue strength of stent.
At last, the radial support performance of the new stent during the trials was satisfactory. No significant displacement of the stent was found on the 90th day after stent implantation, the stent rupture occurred, the endothelial cells on the surface of the stent were covered, making it easier to spot the intimal hyperplasia of the stent. Ultimately, the mechanical properties and biocompatibility of the new iliac vein stent are stable and can be used as the main experimental instrument in later animal experiments.
Footnotes
Handling Editor: James Baldwin
Author contributions
H Q and R S contributed in the model development and numerical simulation, and wrote most of the manuscript. Y G wrote part of the manuscript. Y J performed the animal test.
Declaration of conflicting interests
The author(s) declared no potential conflicts of interest with respect to the research, authorship, and/or publication of this article.
Funding
The author(s) disclosed receipt of the following financial support for the research, authorship, and/or publication of this article: This research was supported by the Inner Mongolia Science and Technology Project, the National Natural Science Foundation of China (No. 51565045) and the Natural Science Foundation of Inner Mongolia (No. 2019MS08176).