
Abstract
A detailed investigation of damage and failure mechanisms of composite laminates under low-velocity impact (LVI) by experimental tests and numerical modeling is presented. Five impact energy levels were investigated on composite laminates by drop-weight tests. Permanent indentations were measured, and delamination areas of each interface induced by each LVI event were captured using an ultrasonic C-scan. The 3D volume elements with a user-defined, material-based finite element model (FEM) has been applied to predict the LVI event considering damage modes, including intra-ply damage and inter-ply damage. The results of the FEM were found to agree well with experimental observations. Internal damage of the laminate during the impact process was analyzed. For thick laminates, the initiation of damage is observed at the first layer, and then spreads from the impact surface to the back, leading to a pine-type damage pattern as the thickness increases. Frequency-sweep vibration tests of composite laminates subjected to LVI events were studied under a “fixed ends” boundary condition. Our results show that it is reasonable to use frequency-sweep vibration experiments to evaluate the damage of laminates subjected to LVI events.
Introduction
Composite materials are being increasingly used in the automotive and aerospace industry due to their excellent mechanical characteristics and low weight. Nevertheless, they are susceptible to low-velocity impact (LVI) events during their manufacture or when they are in service. Composite laminates can undergo complicated damage in terms of matrix cracks, fiber breakages, and delamination.1–3 Such damage is particularly dangerous because it leaves the structure with barely visible impact damage on the surface of the structure, while drastically reducing its residual mechanical strength, especially for compression loading. Therefore, it is essential to develop experimental studies and numerical methods to predict the impact responses of such materials.
Previous experimental studies in this area have focused on the impact energy,4–6 thin laminate,7–12 ply-stacking sequence4,13–15 on the evolution of the impact load as well as the compress after impact (CAI) strength of laminate. It has been demonstrated that peak load, maximum displacement and residual stiffness are functions of the impact energy. It has also been reported that thicker laminates with higher bending stiffness tend to promote higher CAI strength, and the relatively small thickness of the laminates led to the elastic instability of samples during compression tests. From previous studies,16–21 it has been found that the main damage caused by an LVI event is delamination. Recently, nondestructive techniques including ultrasonic C-scan, X-radiography, and infrared thermography are being used to determine the extent of damage. Recently, Tita et al. 22 established an indentation test, instead of a drop-weight test, to analyze the failure of LVI on thin disk laminates. Ghelli and Minak 23 has reported drop-weight impact tests and compression after impact tests on carbon/epoxy thin laminates of two different geometries (rectangular and circular).
While these experimental methods are direct, there some deficiencies. For example, delamination samples obtained from non-destructive inspection are affected by shading each other. Such a superposition makes it difficult to distinguish the delamination state of each ply. These experiments consume time, materials, work forces, and they are easy influenced by uncertain factors. For these reasons, the development and application of numerical methods are deemed less necessary.
From the perspective of numerical simulations, our damage model is the basis and key for studying the impact of damage to composite laminates. Various composite damage models have been presented in the literature in recent years. Most of these investigations24–26 presented a three-dimensional continuum damage mechanics model accounting for both intra-ply damage and inter-ply damage. Intra-ply damage is fiber breakage and matrix splitting, while inter-ply damage is delamination. Tsai and Wu, 27 Puck and Schürmann, 28 Hashin,29,30 and Chang and Chang 31 criteria were used to predict intra-ply damage. Spring element, cohesive element and cohesive contact algorithms were used to predict delamination damage. With these numerical approaches, Hashin and Rotem’s failure criteria have been widely used for predicting the initiation of damage and a cohesive element was developed for describing delamination. Zhang and Zhang 32 established a quasi-static load model with surface-based cohesive contact to predicting LVI damage in laminated composites. Batra et al. 33 established a three-dimensional elastoplastic damage model for analyzing impact response and impact damage of composite laminates subjected LVI events. Gonzalez et al. 34 used a thermodynamic framework to simulate delamination induced by LVI of composite laminate.
Although extensive research has been carried out on the LVI event, the majority of these studies do not focus on the impact process itself. Rather, they tend to report on the final consequences, that is, delamination leading to damage and the reduction of material strength. Moreover, most of these studies targeting impact and CAI behavior are targeted toward thin composite laminates (less than 4 mm). The thick laminates (greater than 4 mm) are mainly used in the skin of airplane wings and stringer and that also may subject to LVI events. Besides, the impact damage mechanism of thick laminates is different from that of thin laminates. Soto et al. 35 point out that thicker laminates lead to larger delaminations while thinner laminates lead to more fiber breakage during an LVI event. This is because in thin laminates, fiber breakage becomes more relevant while matrix cracking effects can be assumed negligible and the consequent induced delamination is practically suppressed. For these reasons, it is also very important to study thick laminates subject to LVI. Nevertheless, there are far fewer results reported for thick laminates. A limited number of studies16,19,36–38 have focused on thickness effects on LVI damage tolerance of composite laminates. To improve the efficiency of predictive calculations, only a few layers of the laminate were considered as an individual part, while the remaining layers were regarded as one part, and the cohesive contact was introduced into the interface of each adjacent part.
In this paper, LVI on composite laminates with 5 mm thickness have been investigated experimentally and computationally modeled. Frequency-sweep vibration tests of composite laminates with various extent of impact damage were studied under fixed end boundary conditions. This was carried out in order to evaluate the damage to the laminates subjected the LVI events. Ultrasound C-scanning and optical microscopy were performed to characterize internal damage of the laminates subjected to LVI events. First-order frequencies of laminates subjected to LVI events were acquired. A 3-D volume element model was applied to predict the intra-ply damage and inter-ply damage based on the Hashin criteria and cohesive elements described above. Additionally, the damage of each layer during the impact process was analyzed, in order to describe the detailed damage evolution processes.
Experiment
Drop-weight impact tests
Following the ASTM D7136 standard for drop-weight impact tests, 39 the sample size was dictated to be 150 × 100 mm. The material used in this study was T700/3234 and the samples were manufactured by unidirectional carbon/epoxy prepregs with a (45/0/-45/90)5s layup. Face-on impact tests were performed using a WANCE136 drop tower system. The hemispherical impactor, had a weight of 5.5 kg and a diameter of 12.7 mm. The impact fixture design was drawn from ASTM standard. 39 The samples were placed into a picture frame fixture having a 125 × 75 mm open window in the center. On the support fixture, four rubber clamps were used to clamp the sample to restrain out-of-plane motion of the sample during the impact process. An anti-impact device was utilized over the fixture to avoid secondary impact on sample. The experimental setup can be seen in Figure 1. The impact point was situated at the central position of the sample. Five levels of impact energy (15, 22, 30, 45, and 60 J) were included in the testing program. The impact energy was adjusted by changing the height of the impactor while keeping the mass and diameter of impactor constant. In order to reduce the influence of the dispersion of the composite material on the test results, five samples were selected at the same energy, and the total number of samples was 25. In these tests, the instantaneous impact forces were measured by the dynamic force sensor.

Setup for impact tests.
After the LVI tests, global deformation vanished, but locally, the deformation component was preserved. The local deformation on the top surface is usually referred to as permanent indentation. Indentation depths at the impact point on each sample were measured using a laser displacement meter. Delamination damage shapes and areas were obtained by ultrasound C-scanning after the LVI events.
Frequency-sweep vibration tests
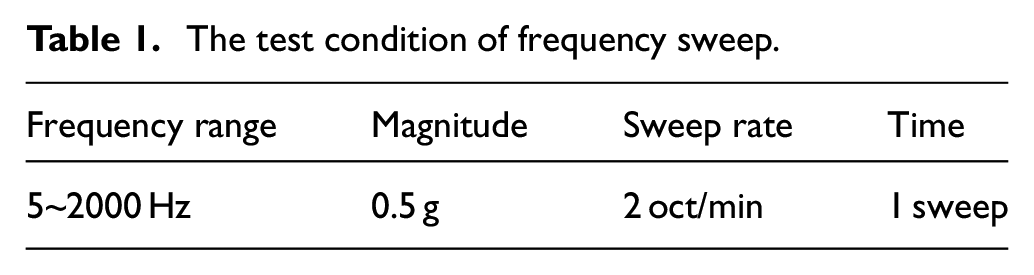
To study the effect of damage from LVI events on the composite laminates, frequency-sweep vibration tests of pristine and damaged composite laminates were performed. An electrodynamics vibration generator (Model V850-440, LDS Test and Measurement, UK) producing 2T of thrust, and a controller (Vibration Research, USA) were used for vibration tests. Single point control, and single point monitoring, were employed in vibration tests. The control point is used to control the vibrostand to provide a pre-set test condition. And the monitoring point is used to monitor vibration response of sample. Sensors made by Beizhi Electronic Technology (China) were models BW13250 and BW11530. The BW13250 sensor was used as the control point, labeled as J5380 with a sensitivity of 52.42 mV/g, and the BW11530 sensor was used as the monitoring site, labeled as J0148, with coordinate sensitivities X = 10.04, Y = 10.17, Z = 10.17 mV/g. The bottom plate of the fixture was connected to the slip table of the vibrostand using bolts. The sample was tightened using a splint on both sides of the fixture, which was equivalent to the fixed ends, as shown in Figure 2. The control point was pasted on the bottom plate of the fixture, close to the installation position of the sample to ensure that the test condition applied to the sample is equal to the pre-set test condition. The monitoring point was glued to the center of the sample to obtain the first-order frequency measurement through transmission between the monitoring point and the control point. Table 1 lists the test conditions for the frequency sweep.
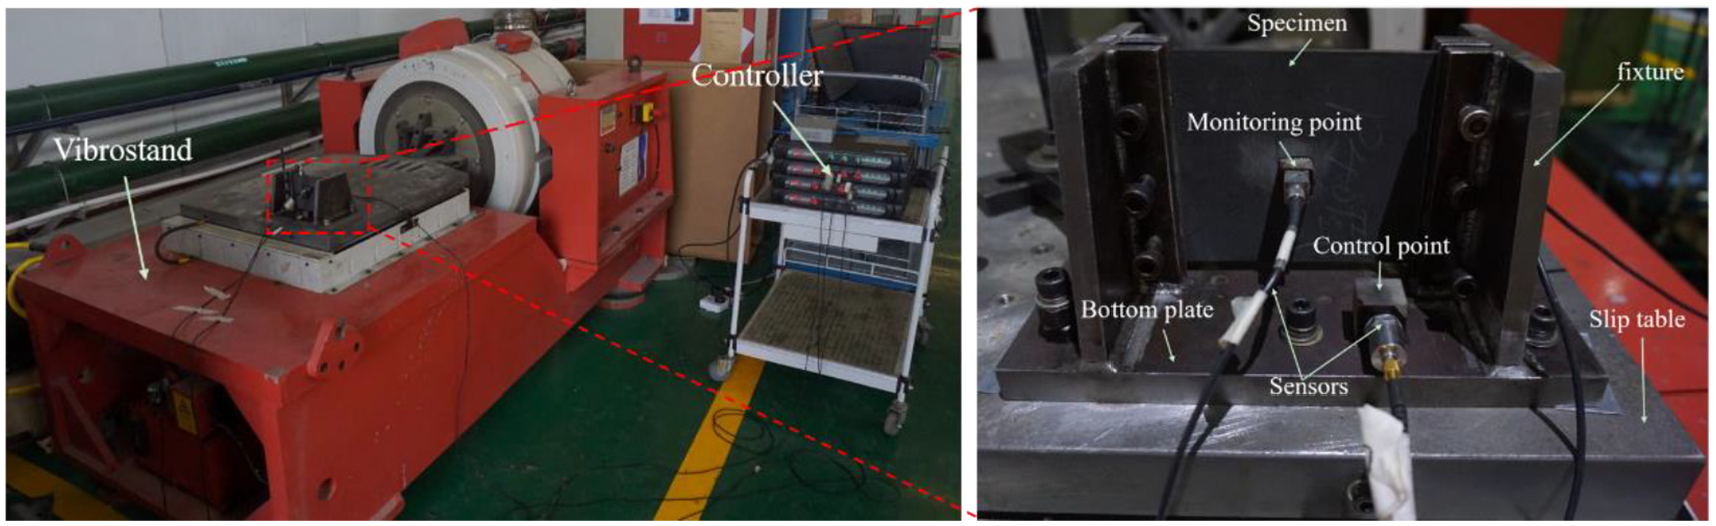
Setup for vibration tests.
The test condition of frequency sweep.
Results and discussion
Impact load
Figure 3(a) shows the impact force-time curves for five impact energy levels (15, 22, 30, 45, 60 J). As the impact energy increases, the impact peak forces also increase, and the oscillations have a higher amplitude for a larger impact energy. This indicates that very serious damage occurs in the laminates. At the initial stage of contact, as a function of the gap between the fixture and the sample, the impact force gradually increases in a fluctuating way until it reaches the peak force. After that, the impactor starts to rebound, the curves become relatively smooth, and the impact force reduces to zero.

Impact force versus time: (a) the impact force-time curves for 15, 22, 30, 45 and 60, and (b) the impact force-time curves for 22, 30 and 45J.
In cases where the impact energy is 22, 30, and 45 J as presented in Figure 3(b), it is seen that the oscillations of the impact forces are similar during the entire impact process, especially at the initial stage of impact (t = 0 to t = 0.5 ms). This indicates that the initial damage occurs at almost the same impact time. In other words, the time when any initial damage appears is not affected by the impact energy. Moreover, we see that the impact durations are almost same (4.2 ms). The most serious oscillations occur from t = 0.5 ms to t = 1 ms, when there is sudden and large (×3) decrease of impact forces, caused by matrix damage and delamination in the impact region. Fluctuations in these curves decrease gradually after t = 1 ms. When the impact force reaches its peak (t = 1.9 ms), the impactor starts to rebound and the impact curves become relatively smooth. Finally, the impact force vanishes when the impactor and the sample have completely separated.
For cases where the impact energy is high (60 J), violent oscillations are observed near the peak force, and a sudden drop occurs at the peak force with the appearance of fiber damage. At later times (t = 4.6 ms) is observed when the impact energy is 60 J. This can be explained by noting that serious matrix damage and fiber damage by impact will lead to the significant stiffness degradation in the contact area. Comparing the curves of the five impact energy levels, we can conclude that the different damage status shows different impact force-time curve characteristics. Delamination and matrix damage occur mainly in cases of low impact energy. Fiber damage appears when the impact energy reaches 60 J.
Impact damage
Contrasting observations of these samples were recorded after LVI events with five different impact energy levels. When the impact energy is 15 J, there is no visible damage, but there is a tangible dent at the impact point. With the impact energy increasing gradually, the dent depth also gradually increases. A circular dent becomes visible on the impact face, but without visual damage and deformation on the impact back face. When the impact energy increases to 60 J, the delamination on one profile face in the thicker direction is clearly visible, indicating the most serious damage.
The formation of circular dent damage is relatively small under LVI, and is in fact barely visible to the naked eye. Therefore, a laser displacement meter was used to inspect the dent depth. Figure 4 shows the corresponding relationship between dent depth and the delamination area and impact energy. Both dent depth and the delamination area increase non-linearly with increasing impact energy. The greater the impact energy, the dent depth increases by smaller and smaller amounts. This is mainly due to the larger contact area of the impactor, and the smaller impact stress.

Delamination and dent depth versus impact energy.
Figure 5 shows images of the delamination damage obtained by ultrasonic C-scans as a function of impact energy and the colored legend shows the thickness. Note that the impact damage footprint is similar and closer to an elliptical shape under low impact energy (15, 22, 30 J). As the impact energy increases, the damage area becomes larger and the delamination shapes gradually change from elliptical (15, 22, 30 J) to a peanut shape (45 J), and finally to a very large and irregular shape (60 J). At 60 J, the internal damage to the laminate is clearly very serious.

Delamination shapes in different impact energies.
To obtain more detailed information about the effect of impact energy, samples subjected to LVI events were cut using abrasive water jet machining. 40 Internal damage from the central cut section was assessed using an optical microscope. Observation of fractured samples showed that the damage induced by impact are consistent with different impact energies. Delamination mainly occurs near the impact region, throughout the entire sample, and has the largest delamination area on the back of the sample.
According to the micrographs of all samples, it is found that the micrographs under impact energy (22, 30, 45 J) are similar to that of 15 J, while 60 J impact energy causes catastrophic damage to the samples and their micrographs are different from other samples. So micrographs of samples subjected to 15 and 60 J impact energies are selected to analyze in Figure 6. Delamination and matrix damage are observed throughout the sample near the impact region. For 15 J impact energy, damage occurs through almost the entire thickness, but the extent of the damage is obviously less than 60 J of impact energy. For 60 J impact energy, severe delamination occurs in the upper and lower section near the impact region, while less severe damage occurs in the middle section. This phenomenon can be explained as follows: Under low velocity impact loadings, local contact leads to visible bending deformation, and the upper and lower sections have larger compressive stress and tensile stress respectively, leading to serious delamination and matrix damage. It should be noted that the damage in the lower section is more serious than in the upper section. This is due to the tensile strength of the matrix being less than the compressive strength, and the matrix is subjected to a higher tensile load in the lower section, for example, bending load by impact.

Images of impacted samples: (a) 15 J, (b) 60 J, and (c) 30 J.
The impact region is compacted due to high out-of-plane compressive stress, creating dents as shown in Figure 6(c). Because of the serious dent near the impact zone, the thickness direction of the sample near the impact zone becomes wider, while far away from the impact zone there is little effect.
Frequency-sweep vibration results
Accelerated evolution curves during the vibration process are presented in Figure 7, while Figure 8 shows peak acceleration (the average value of the five samples) under different impact energies. From Figure 8 we see that peak acceleration does not show any regularity with an increase of impact energy. This is because the structural nonlinearity caused by the impact damage leads to subsequent nonlinearity of the transfer function of the structure. In addition, we find that for the same order of magnitude of the frequency sweep, the peak acceleration of the laminate under 15 J impact energy is largest, which indicates that a 15 J impact energy does not cause extensive damage to the laminate, but the structural dynamic characteristics become worse. So we can conclude that although the 15 J impact energy is small, it is also very dangerous to the laminate when the structure is subjected to vibration and fatigue loads.

Accelerate evolution curves during vibration process under different impact energies.
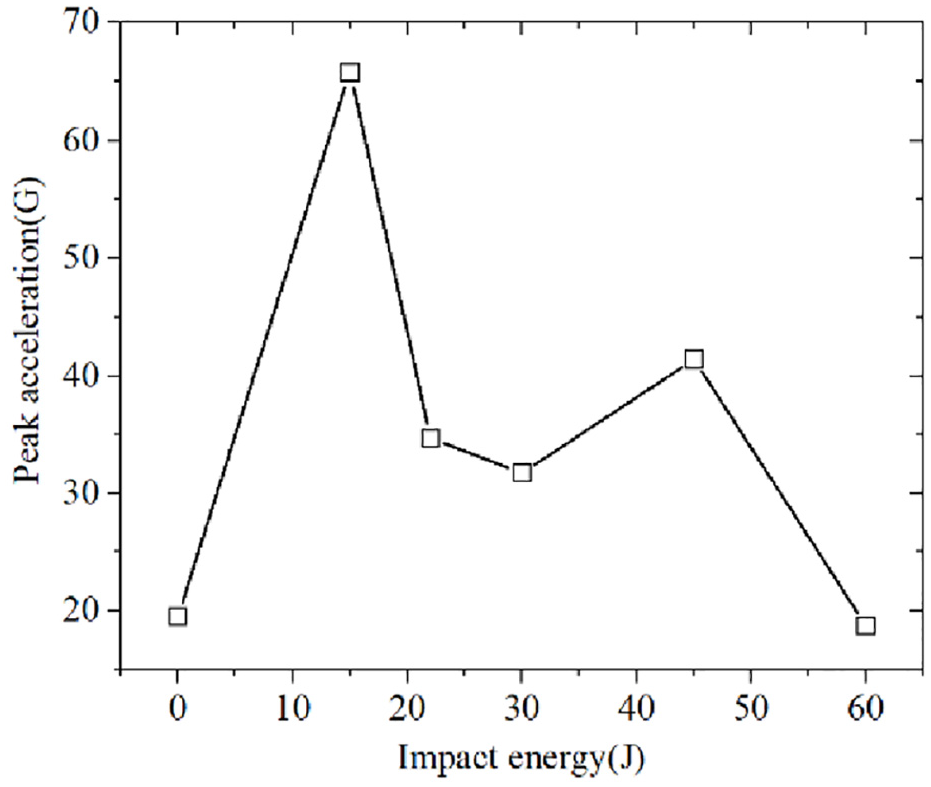
Peak acceleration under different impact energies.
The relationship between first-order frequency and delamination area as a function of impact energy are shown in Figure 9. There is a strong correlation between the first-order frequency and the delamination area of laminate. The first-order frequency decreases with the increase of the delamination damage area caused by impact. It can be seen from the fitted curve in Figure 9(b) that the first-order frequency is linearly related to the delamination area. This is because the lager the delamination area, the more the stiffness of the sample decreases. However, the first-order frequency decreases due to a reduction in sample stiffness. When impact energy is less than 45 J, the delamination area and the first-order frequency vary linearly with increasing impact energy. There is a sudden change in both delamination area and the first-order frequency with under 60 J impact energy, which indicates that the damage caused by the 60 J impact energy is very destructive, beyond the ultimate impact energy value of the laminate.

The relationship between the first-order frequency and the delamination area: (a) the first-order frequency and the delamination area as a function of impact energy, and (b) the first-order frequency versus delamination area.
Numerical simulation
The damage behaviors of composite laminates under low velocity impact include intralaminar damage and interlaminar damage. Intralaminar damage is fiber breakage and matrix splitting, while interlaminar damage is delamination.
Intralaminar damage model
Damage criterion
In order to determine the intralaminar damage initiation and the final failure of composite laminates, 3D Hashin failure criteria 29 were adopted for a numerical simulation. The Hashin criterion identifies four different modes of failure for composite material: fiber tensile failure, fiber compressive failure, matrix tensile failure, and matrix compressive failure.
Fiber tensile failure mode (σ11 > 0):

Fiber compressive failure mode (σ11 < 0):

Matrix tensile failure mode (σ22+σ33≥ 0):

Matrix compressive failure mode (σ22+σ33 < 0):

In equations (1)–(4),
Damage evolution
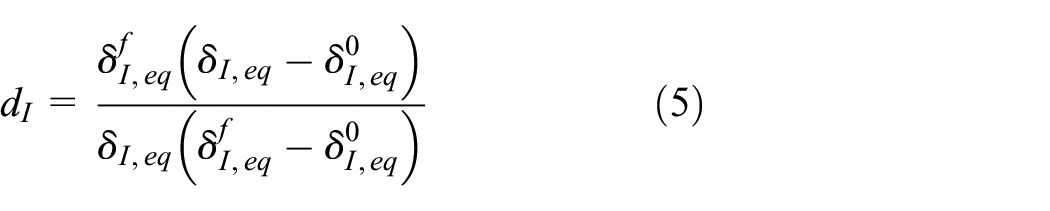
The bi-linear damage evolution law is used after damage appears in the composite material. The evolution law of composite damage is presented in Figure 10. The equivalent stress-displacement relationship can be divided into two steps. From zero (0) to point A in the graph, we observe linear elastic behavior for the material before damage has appeared. Once the equivalent stress meets the initiation failure criterion, the elastic module reduces in a linear way. Point A to point B denotes the process of stiffness degeneration in the material. The area of the triangle formed by the curve and abscissa axis,

Bi-linear damage evolution law.
In equation (5),
Inter-ply damage model
To effectively predict interlaminar damage, a cohesive element having a traction–separation constitutive relation was incorporated into the numerical model. A quadratic stress criterion was applied to simulate the cohesive damage initiation:

Where

Where GS =
Finite element model
This low-velocity impact model was implemented in ABAQUS/Explicit software. The overall FEM model includes the impactor, the sample, and the supporting plate. The impactor and supporting plate were simulated as a rigid body using 4-node 3-D bilinear rigid quadrilateral (R3D4) rigid elements due to the relatively smaller deformation compared with the laminate. A mass of 5.5 kg was assigned to the impactor as a point mass definition. The sample was rectangular (150 × 100 mm) with a total thickness of 5 mm. Each ply had a thickness of 0.125 mm with discrete linear brick elements (C3D8R). The material orientation was defined for each ply to represent the laminate layup. Zero-thickness 8-node 3D cohesive elements (COH3D8) were inserted between layers to model the interface as shown in Figure 11. Red lines represent cohesive location, with 39 layers in total. The cohesive elements and the plies were connected by tie constraints methods. The supporting plate below the laminate was fixed in all directions to best represent experimental constraint conditions. The contact between the supporting plate and impactor with the laminate were modeled using Coulomb-type frictional contact with a frictional coefficient of 0.3. 42 This value has been found to be representative of a composite to steel contact. In the FEM model, initial velocity was given to the impactor according to the impact energy. Mass property was assigned to the impactor. The boundary conditions of the low-velocity impact model are shown in Figure 11. All degrees of freedoms (DOF) other than the z direction were constrained for the impactor. The properties of the laminates are listed in Table 2, and parameters for the damage model are listed in Table 3.

The finite element model.
Material parameters for T700/3234 composite laminates.

Parameters of damage model.

Results and discussion
Validation of the numerical model
To validate the finite model, the data shown in Figures 12 and 13 compare numerical and experimental results of the force-time histories and delamination shapes for the 15 and 60 J impact energies, respectively. The comparison of numerical and experimental results for peak forces and total delamination areas under all impact energies are presented in Figure 14. From Figures 12–14, we can find that most of the predictions are in good agreement with the experimental results, although some slight discrepancies are noted. The first discrepancy is that the force-time curves in the experimental data have larger oscillations than the simulation data at the contact stage. The second discrepancy is that for 60 J impact energy, both the stiffness of the laminate at the rebound stage and its duration are slightly larger in the simulation than in the experimental results. A third discrepancy is that the peak forces in the simulation are consistently higher than in the experimental results, but delamination areas are slightly smaller than the experimental results for all impact energies. These discrepancies arise because not every single damage event and energy dissipation mechanism were captured in the simulation, and no damping was used in the model.

Comparison of impact force histories in LVI.

Comparison between numerically predicted and experimentally measured delamination shapes.

Comparison between numerical and experimental results: (a) force peak, and (b) total delamination areas.
The numerically projected delamination shapes of laminates for the 15, 30, and 60 J impact energies are comparable to the C-scan results shown in Figure 13. To obtain the delamination envelope of the laminate within the finite model, the delamination obtained for each interface is superposed. The projected delamination shape is almost circular, but shows up as ellipses in the C-scan result and are not captured with low impact energy. The main reason for the deviation can be due to a limited prediction of the interaction between the delamination and the matrix failure mechanisms. And this is easily traceable to the delamination at the last interface, which gives its shape due to a long matrix crack in the last ply, has not been captured correctly. However, the projected delamination area in general is in agreement with the C-scan results for each impact energy (Figure 14(b)).
Numerical results
To analyze the internal damage of the laminate during impact process, the 15 J case is selected as an example. Figure 15 shows the delamination and matrix damage footprints at time intervals a–h. Time intervals have been marked on the load-time history in Figure 12. Time intervals range from a to h with each time jump being 0.5 ms. According to Figures 12 and 15, the impact is divided into three stages:
(I) The initial damage stage (0–1 ms), where the impact force increases rapidly from 0. Damage occurs to the contact surface, once contact between the impactor and the laminate is made. With a rapid increasing of the impact force, the damage to the laminate spreads rapidly from the impacted surfaces to the back surfaces, until all the surfaces of the impact zone incur damage in the whole thickness direction. (II) The damage spread stage (1–2 ms), due to the expansion of the damage, where the contact force begins to fluctuate violently and the growth rate begins to slow down. At the same time, the damage areas of each layer gradually increase until the speed of the impactor becomes 0, which is the end of this stage. (III) The unloading stage (2–4.3 ms), the impactor begins to rebound and the impact force begins to unload. The bending deformation of the laminate caused by the impact begins to recover, and the damage is no longer expanding, until the impactor separates from the laminate and the impact force becomes 0.
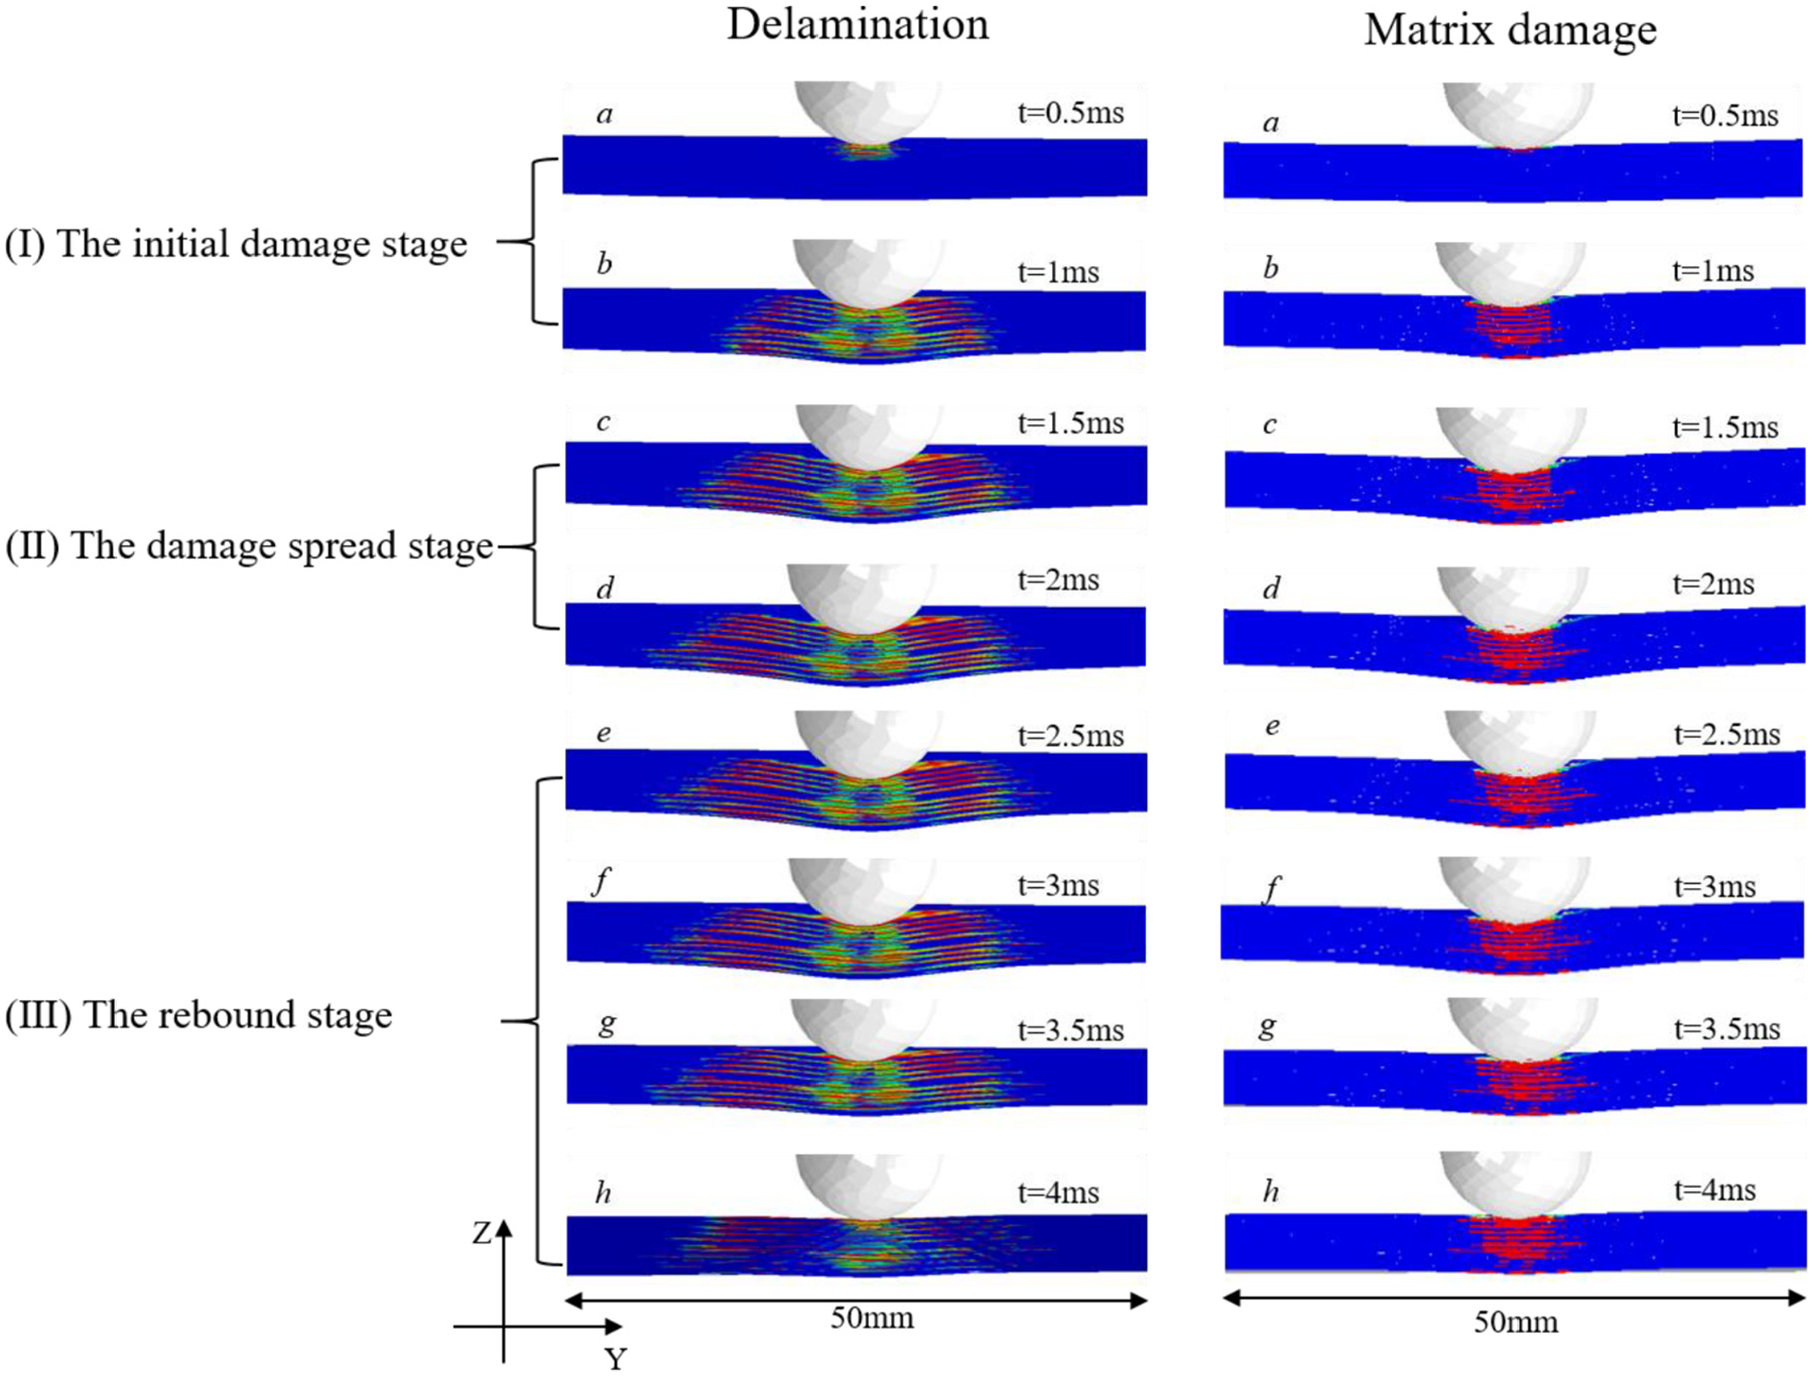
Damage growth shows for a Y-Z plane section.
In the low-velocity impact process, the earliest type of damage is delamination, which is caused by the impactor rapid extrusion of the laminate, resulting in local excessive out-of-plane stress σ33 (Figure 16). Eleven points in the second layer of the laminate near the impact point were selected equidistant along the Y direction to determine the out-of-plane stress value and draw the distribution curve of the out-of-plane stress, respectively, at impact time intervals a-h. From Figure 16, it can be found that the out-of-plane compressive stress starts to increase sharply at a distance of 4 mm away from the impact point, and reaches a maximum value near the impact point, which is distributed in a parabola. The stress at the impact point is largest when the laminate is contacted by the impactor (t = 0.5 ms). With the downward movement of the impactor, the stress gradually expands outward until the displacement of the impactor reaches the maximum value (t = 2 ms), which can explain delamination damage at the initial and spreading stages. With the rebound of the impactor, the stress decreases gradually. As the impactor presses down, delamination expands downward. Because the back of the laminate is not supported, the delamination damage expands in the interlamination and delamination area becomes larger, leading to a pine-type damage pattern in the thickness direction.

Distribution of out-of-plane stress near the impact point at time intervals (a)–(h).
The matrix damage mostly occurs on upper plies, which is mainly caused by the compression of the matrix due to impactor extrusion laminate. It is known that out-of-plane compressive stress can improve the interlaminar shear strength by suppressing delamination initiation and propagation. However, in the lower plies, the contact induced friction force arising from compressive through thickness stress is much lower than is insufficient to restrain the interlaminar delamination onset and propagation. Moreover, the global bending deformation of the laminate occurs by impact, and on the impact back side, σ22 is larger leading to serious damage. The matrix damage area of the impact back side is a bit larger than upper plies. In the middle plies of the laminate, the matrix damage area is largest, which may be caused by bending shear stress.
The growth of delamination footprints during impact are shown in Figure 17. Notably, the delamination area shows an irregular circular shape and the lamination area increases steadily until impact load reaches a maximum (point d). Beyond the peak load, the extent of damage seems to have reached its final extent and is no longer increasing.

Delamination footprint growth during impact.
Conclusion
A damage process analysis for composite laminates under LVI events designed and implemented. Drop-weight tests were carried out, and delamination was detected by ultrasonic C-scan. A numerical model was established based on both intra-laminar damage and inter-laminar damage. By combining experimental and numerical simulation results, delamination distribution characteristics were discussed, and the damage mechanism was further revealed. In addition, frequency-sweep vibration tests were performed to evaluate the damage of different impact energies on composite laminates. Based on this systematic study, the following conclusions can be drawn:
The damage of composite laminate subjected to LVI event is mainly matrix damage and delamination. For thick laminates, the damage occurs at the outer plies first, which make contact with the impactor. The matrix damage is mainly caused by high local contact stress and global bending deformation of the laminate under impact load. The delamination damage occurs at the upper plies and propagate to the inner plies due to the high contact stress value, leading to a pine-type damage pattern in thickness direction. As the impact energy increases, the delamination area increases and the shapes gradually change from an ellipse (15, 22, 30 J) to a “peanut” shape (45 J) to an irregular shape (60 J).
Both impact tests and frequency-sweep vibration tests demonstrate that the 60 J impact energy is quite destructive and is greater than the ultimate impact energy value of the laminate. When the laminate is subjected to 15 J impact energy, there is less damage, however the dynamic response of the structure is the largest and this is also very dangerous to the laminate.
There is a linear correlation between the first-order frequency and the delamination area of the laminate. With an increase in the impact energy, the delamination area increases, which results in a reduction of stiffness, thus decreasing the first-order frequency of composite laminates. It is therefore reasonable to use this frequency-sweep test to evaluate the damage of laminate materials subjected to LVI.
Footnotes
Handling Editor: James Baldwin
Declaration of conflicting interests
The author(s) declared no potential conflicts of interest with respect to the research, authorship, and/or publication of this article.
Funding
The author(s) disclosed receipt of the following financial support for the research, authorship, and/or publication of this article: This work was supported by the Natural Science Foundation of Shaanxi Province (No. 2017JM5018), and National Science Foundation of China (No. 51305351).