
Abstract
To understand the effect of internal leakage on the torque field and characteristics of a torque converter (TC), a transient analysis was performed on the internal flow of a TC and the pressure pulsation characteristics of monitoring points in the convection channel. It was found that dividing the leakage area of the TC into a separate watershed improved simulation accuracy by 4%. When there was a leakage area, there were distinct collision, mixing, and assimilation stages between the leakage flow and the main flow. These phenomena caused energy loss that was highest at low speed ratios. However, the leakage flow always accounted for 12% of the main flow regardless of the speed ratio. At the same time, the leakage flow had a larger influence on pressure pulsation inside the TC and especially the low frequency band was more substantial. This shows that the leakage area has a large influence on the TC performance, energy loss, and flow state. Analysis of the leakage area showed that reducing the leakage area helps to improve powertrain performance and fuel economy.
Introduction
A torque converter (TC) is mainly composed of a pump, turbine, and stator. The working fluid is a hydraulic transmission oil. Torque converters are widely used in vehicle transmission systems and can provide good automatic adaptability, improve vehicle life, and simplify vehicle operation. 1 However, the internal flow and energy loss reduce the efficiency and economic viability of TCs. For this reason, many studies been conducted to investigate the internal flow field of TCs.
Some researchers have used one-dimensional (1D) linear discriminant analysis (LDA) technology to study the internal flow field of a TC under different operating conditions, and have also measured the three-dimensional (3D) steady velocity distribution of different cross sections of the pump.2,3 Numerical theory has been applied to conduct vectorized operations on TCs and to study the interactions between the turbine, pump wheel, and stator at different speeds. 4 As numerical simulation technology has matured, some researchers have used numerical simulations to analyze the transient and steady state flow fields of a TC, and it has been concluded that the steady state calculation cannot calculate the transient characteristics.5,6 A 3D transient flow calculation can more accurately predict the true flow of a fluid. 7 Many researchers have studied TCs using a single runner model.8–11 However, due to the combined effect of the vortex and circulation, the flow field in a TC will experience the phenomenon of merge and split. If the single-channel model is adopted, the confluence and divergence phenomenon will not be considered. 12 Other investigators have performed computational fluid dynamics (CFD) simulations of the full- and single-runner models. The simulation results were compared with the experimental results, and it was found that the results obtained by the full-runner model were closer to the experimental results.13–16 At the same time, many scholars have found that the leakage area has a large impact on the flow field and that turbomachinery leakage flow characteristics can increase energy loss and cavitation effects.17–19 However, the leakage area inside a TC has not been fully investigated, and some researchers have even ignored this area during previous studies.
In this study, in combination with the 3D flow theory of a TC and CFD, the ANSYS-FLUENT software package was used to analyze the flow field of a TC leakage area and the effect of the leakage area on TC performance.
Computational model
In this study, the working oil in the TC circulated in the flow path formed by the pump turbine and stator, realizing the conversion process from mechanical to kinetic energy and then back to mechanical energy. Figure 1 shows a sectional view of the TC. To avoid interference and improve manufacturing accuracy, there was be a gap between the pump, turbine, and stator. The gap enclosed an area containing the pump, turbine, and stator, which was referred to as the leakage flow area. In some previous TC simulations, the watershed was divided into three areas: the stator, pump, and turbine. The stator was stationary, and the speed of the pump was always the same. The leakage area that should have been separated was divided into three parts and merged into three watersheds, as shown in Figure 2(a). If the TC watershed is divided like this, when the pump and turbine rotate at a certain speed, the incorporated leakage area always rotates at the same speed. However, when the impeller rotates, only the main flow and the blades in the flow path of the impeller have the same speed. The impeller blades have no direct effect on the fluid in the leakage area. The flow in the leakage area is caused by the viscous force between the wall surface and the oil, and the internal friction between the fluids obtains kinetic energy to generate rotation. The rotation speed will always be lower than the speed of the pump wheel.

The torque converter.

Fluid domain division model: (a) traditional method and (b) new method.
Therefore, this study considered the leakage area to be an independent area. The flow in the leakage area was mainly dependent on the viscous force of the core ring and the oil, and the internal friction of the three leakage ports for energy transfer, as shown in Figure 2(b). This was consistent with the actual working conditions.
Because the single flow channel model did not consider the phenomena of confluence and divergence between the leakage area and the flow channel, in this study a full flow channel model was applied to divide the watershed in the TC into stators, pump wheels, turbines, and leakage areas. Hexahedral grids can provide better results than tetrahedral grids.20,21 Thus, a hexahedral grid was used. The total number of grids was nine million, as shown in Figure 3.

The grids.
To obtain a simulation result that was closer to the experimental result, a transient calculation was applied to obtain the stable flow field of the TC. The incompressible Navier-Stokes equations were solved using the SIMPLE algorithm, and heat transfer was not taken into account. The RNG K-ε transport model was selected as the turbulence model.22,23 The initial turbulence intensity was set to 3%, and the simulation started from zero fluid velocity. Residual values of 10−5 for the flow continuity, velocity, and turbulent kinetic energy were adopted as the CFD solution convergence criteria.
Reliability verification and independence of the number of grids
To verify the accuracy of the 3D flow field simulation results, a bench experiment was performed on the TC. The area division method shown in Figure 2(a) and (b) was used to simulate the flow field. When the TC leakage area was divided into separate areas, the simulation accuracy was improved by 4%. Therefore, to improve prediction performance, the leakage area was divided into separate areas to ensure higher accuracy. The numerical simulation results were then found to be closer to the experimental results (the experimental device is shown in Figure 4), indicating the reliability of the simulation. The number of blades was NP = 21, NT = 28, and NS = 17. The pump simulation speed was consistent with the experimental motor speed of 1698 rpm. The working fluid was 6# hydraulic transmission oil, with a density of 899.1 kg.m−3 and kinematic viscosity of 0.00189 Pa·s. The specific experimental steps were as follows: The first step started the driving motor and loading motor. The speed of the driving motor was always the same as the rated input speed of the TC. Then, the torque of the loading motor was gradually increased from 0 N.m until the TC reached the maximum output torque. In addition, a torque sensor (No. 6, No. 20) was used to monitor and save the speed and torque data. The speed ratio, torque ratio, and efficiency were calculated by monitoring the data. All equipment was turned off when a complete monitoring cycle was completed. In the simulation, the pump and turbine speeds were always consistent with each experimental speed ratio condition. The torque ratios and efficiencies of different speed ratios were obtained. We compare the simulation results to the experimental results. The results are shown in Figure 5. As shown in Figure 6, when the number of meshes reached a certain value, a further increase in the number of meshes had no significant effect on the calculation results, but did increase the calculation time. Considering the balance between solution accuracy and calculation time, the number of grids selected for this study was approximately nine million.
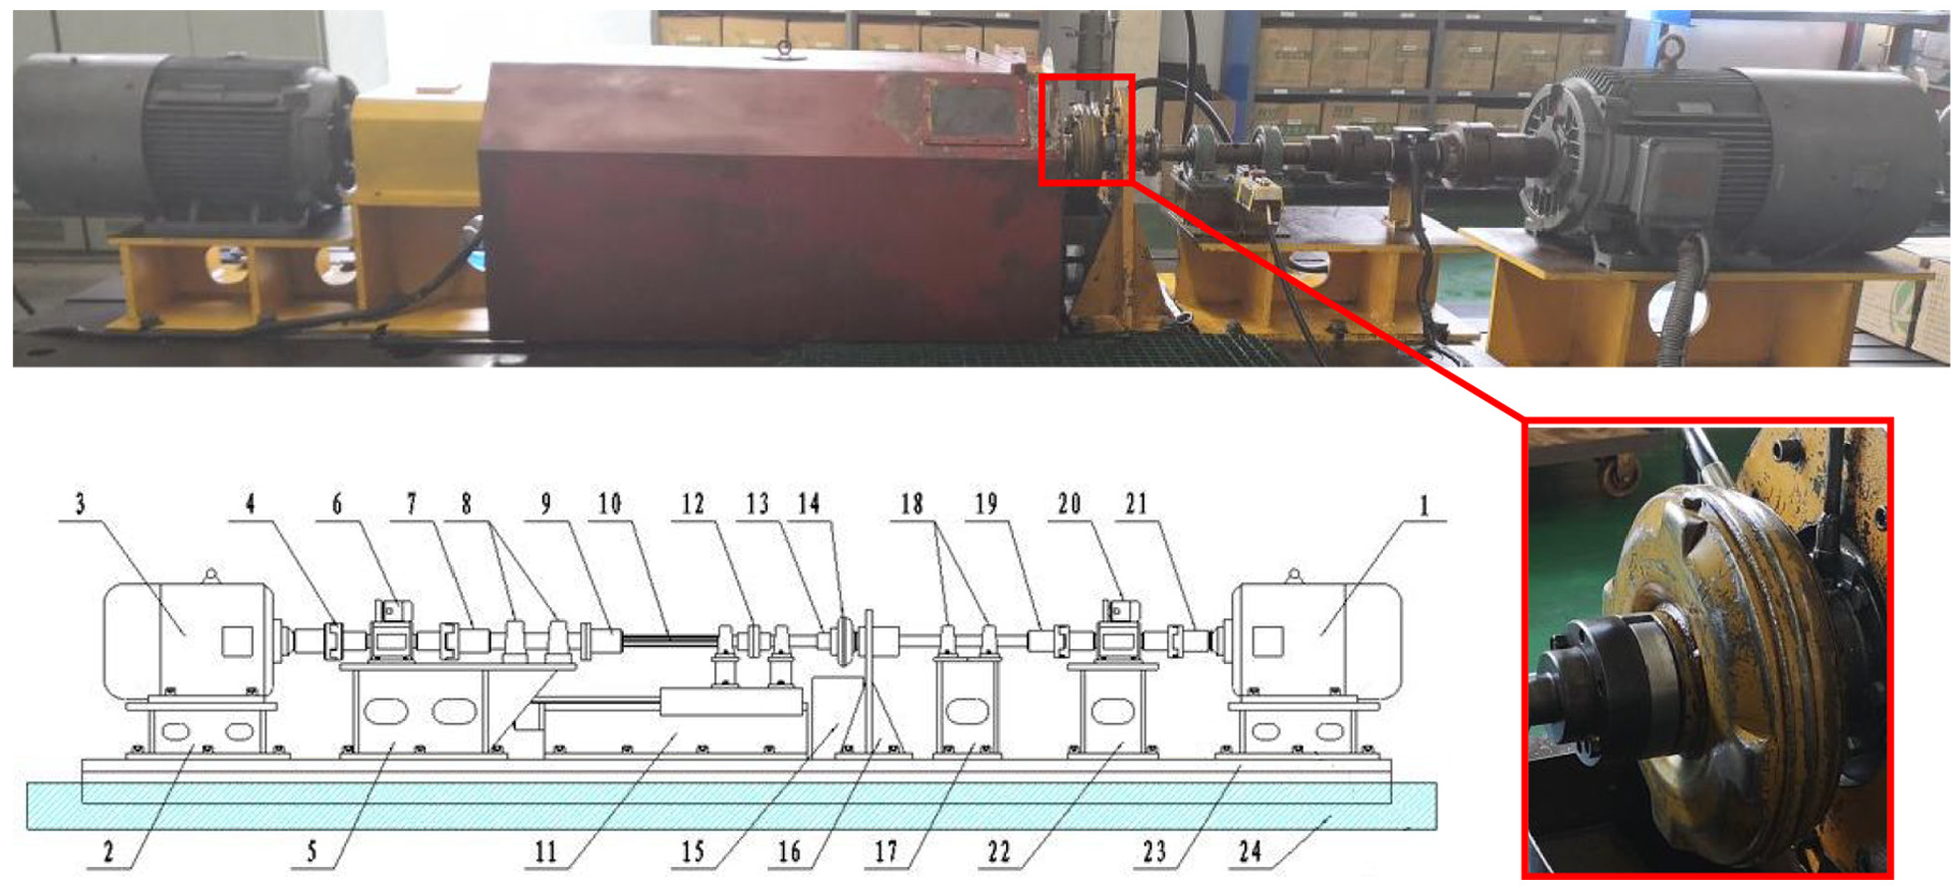
Experimental device.

Torque ratio at different speeds.

Independence of the number of grids.
Results
Leakage area flow analysis
Based on the assumption that there was no leakage in the TC, according to the conservation of mass, it could be concluded that the flow through the stator, the pump, and the turbine was equal:

However, when the leakage area existed, the flow rates in the three separate areas were not equal. In this study, the leakage area was considered to be the fourth watershed, and the working fluid flowed in as a positive flow and flowed out as a negative flow. The difference in flow between each of two watersheds was the leaked flow:

To obtain the relationship between the leakage flow (Qleak) and the main flow, according to the continuity equation, the inflow and outflow in the leakage zone were equal:

Figure 7 shows the magnitude of the main flow and leakage flow at different speed ratios. As the speed ratio increased, because part of the kinetic energy was converted into the mechanical energy of the turbine, the kinetic energy was reduced, the flow velocity through the flow channel was reduced, and the total flow rate was eventually reduced. It can be seen in the figure that QT-S > 0, QP-T > 0, QS-P < 0, which means that LP-T, LT-S is the leakage inlet and LT-S is the leakage outlet. According to the conservation of mass: /QS-P/ = /QP-T/+ /QT-S/ and Qleak = /QS-P/, and regardless of how the main flow changed, the leakage flow always accounted for about 12% of the main flow.

Mass flow at different speeds.
Flow field analysis
Figure 8 shows the XY cross-section velocity trace of the leakage area when the speed ratio was 0, 0.3, and 0.6. It can be seen from the figure that the main flow trajectory near the leak changed significantly due to internal leakage. Part of the high-energy fluid flowing from the outlet of the pump impeller and the outlet of the turbine entered the leakage zone through LP-S and LT-S, and collided with the fluid in the leakage zone. At the same time, the main flow entered the leakage area tangentially from LT-S, and the fluid in the leakage area was rotated under the action of shear to form a vortex. When the main fluid flowed into the leakage area, it entered the main flow area, with the same flow through the LS-P as through the leakage area. It collided with the main fluid and the fluids blended. They were eventually assimilated to flow with the main fluid. As the turbine speed increased, the leakage flow decreased, the cross section of the flow channel did not change, and the flow velocity decreased. The energy of the LP-T and LT-S fluids reduced, and the collisions with the fluid in the leakage zone were weakened. The vortices that were generated were also significantly reduced and the energy loss was reduced.

Traces in leaking watersheds: (a) i = 0.0, (b) i = 0.3, and (c) i = 0.6.
The fluid in the leaking area was subjected to the viscous force of the core ring, which rotated in the same direction as the pump wheel and turbine. The greater the rotation speed of the turbine, the faster the fluid will rotate in the leakage area. Because the stator plays a key role in changing the direction of the fluid, the fluid flowing from the LT-S into the leakage area directly entered the leakage area without changing the flow direction in the stator, which resulted in its direction of movement being the opposite of the flow direction in the leakage area. During this time, the fluid collided in the leakage area, increasing the energy loss. When the rotation speed was low, the inflow energy of LT-S was high, which could overcome the flow resistance formed by reverse flow in the leakage zone. The resistance was eventually assimilated, following the direction of flow in the leakage zone, as shown in Figure 9.

Speed distribution in the Z direction for an XY section (m/s): (a) i = 0.0, (b) i = 0.3, and (c) i = 0.6.
In general, the form of fluid flow loss in the leakage zone could be divided into three categories. First, there was a loss caused by the wide range of vortices in the leakage area, with the degree of eddy current being greater at low speeds, resulting in a greater fluid loss. Second, there was a partial loss of the shunting and confluence formed by the main flow to the leakage area and the leakage area to the main flow. The expansion and contraction of the cross section of the flow caused a sharp change in the direction of oil flow. The energy of the leakage flow was greater at low speeds and local fluid losses were also greater. Third, the fluid passing through the LT-S entered the leakage area in the opposite direction to the flow without colliding with the stator. When the two flows collided, the energy loss increased. The leakage amount was larger at a low speed ratio, and the collision loss was also larger.
The model with and without leakage
From the results of the flow field analysis, it was concluded that the leakage area had a large impact on the flow field. The leakage area could not be completely closed to verify the influence of the leakage area on the TC performance, but the leakage area of the TC model could be ideally closed in a numerical simulation, as shown in Figure 10.

Torque converter schematic: (a) without leakage and (b) with leakage (Figure 2(b)).
Pressure pulsation
To quantitatively analyze the impact of the TC leakage area on pressure, two monitoring points were selected near the leakage area, and pressure pulsation data at each monitoring point were obtained. When i ≠ 0, both the pump and the turbine rotated, and it was more difficult to monitor the point at the same position; therefore, a monitoring point was selected in the stator watershed that always remained stationary (as shown in Figures 10(a) and 11: points A and B). By monitoring the static pressure time-domain diagrams of points A and B at different speed ratios (i = 0.0, 0.3, and 0.6), and then performing a fast Fourier transform (FFT), frequency domain diagrams of the pressure fluctuations were obtained, as shown in Figure 11.
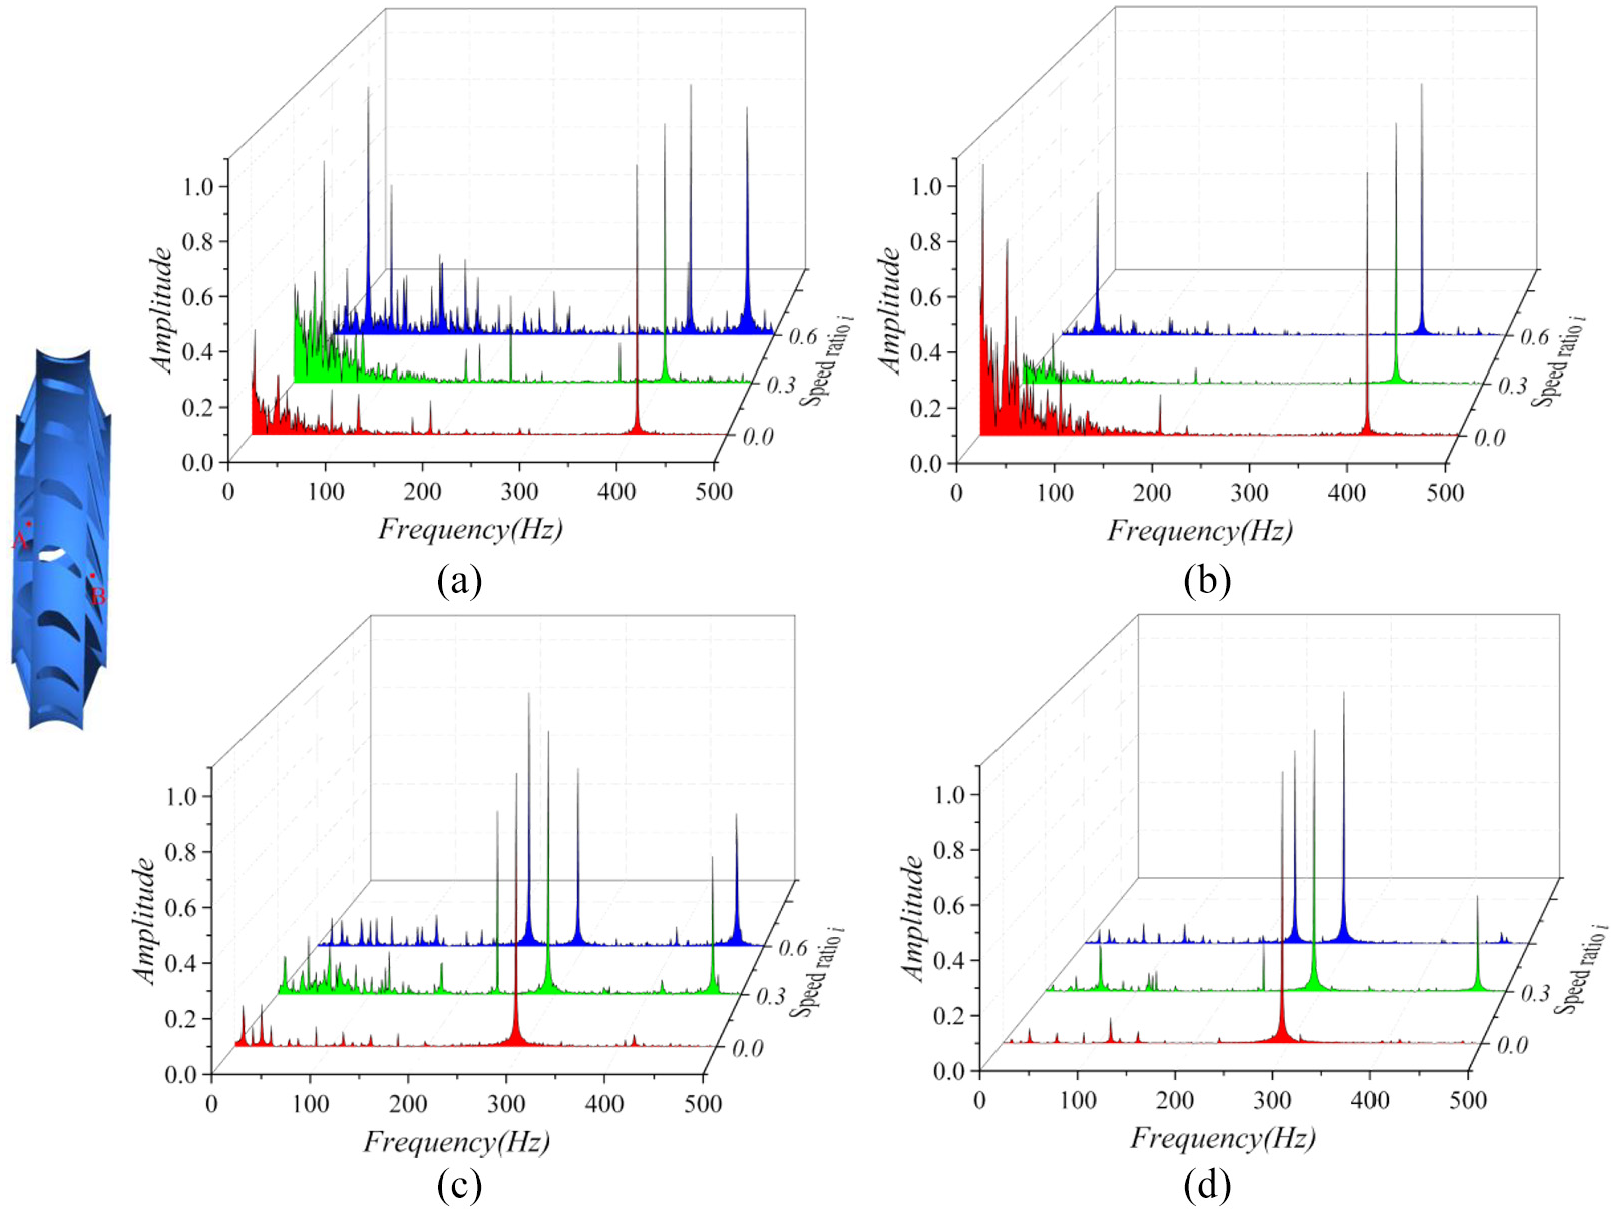
Pressure pulsation spectrum: (a) with leakage: A, (b) with leakage: B, (c) without leakage: A, and (d) without leakage: B.
It can be seen from Figure 11(a) and (b) that because point A was after LT-S, a part of the high-energy fluid flowed into the leakage area and reduced the energy at the turbine outlet fluid, which caused the pressure pulsation to change. When the turbine speed was 0, point A was low. The wideband signal in the frequency band was only obtained from the disturbance caused by the leakage flow. However, as the turbine speed increased, the dynamic and static interference between the turbine and the stator strengthened, which increased the impact of the leaked fluid on the main flow, resulting in a low-frequency broadband at point A. The signal amplitude was then greater. This indicated that the low-frequency pressure pulsation at point A was mainly derived from the combined action of the leakage shunt and the dynamic and static interference between the pump wheel and the stator. The main frequency at point B was the same as that at point A, but when the speed was relatively low, a broadband signal appeared at the low frequency of point B. As the speed increased, the broadband signal at the low frequency gradually weakened, which was because point B preceded LS-P. With an increase in the speed ratio, the dynamic and static interference of the turbine and the stator had little effect on point B, which indicated that the dynamic and static interference of the turbine on the stator was weakened when passing through the flow path of the stator, but the flow at the leakage outlet LS-P gradually reduced and the interference to the main flow weakened. This indicated that the confluence of the leakage outlet was the dominant factor for the pressure pulsation of point B in its low frequency band.
It can be seen from Figures 11(c) and (d) that the main frequency of the monitoring point remained unchanged at different speeds, and when the speed ratio was not 0, there were multiple peaks in the spectrogram because there was no leakage flow. The dynamic and static interference between the impellers were the dominant factors in pressure pulsation. There was a crest with different speeds and different frequencies. Compared to a TC with a leak, the low-frequency pressure pulsation without leakage was significantly reduced, indicating that the leakage had a greater impact on the pressure pulsation. The lower pressure pulsation may have been due to the turbulence of the fluid.
Figure 12 shows a comparison of the performance curves of the two models. It can be seen from the figure that when the leakage area in the TC was removed, the torque ratio was substantially improved. This shows that in the future design of a TC, the performance can be improved by changing the structure of the core ring to minimize the gap between the pump wheel and the stator, which could even eliminate the leakage area.

Effect of leakage flow on TC characteristics.
Conclusion
In this study, the ANSYS-FLUENT software package was combined with CFD and the 3D flow theory of a TC to analyze the flow field of a TC leakage area and the effect of the leakage area on TC performance.
When the TC leakage area was divided into separate areas, the simulation accuracy improved by 4%. Therefore, the leakage area was divided into separate areas to ensure higher accuracy.
When a leakage area was present in the TC, LP-T, LT-S was the leakage inlet and LT-S was the leakage outlet. Both the main and leakage flows decreased as the TC speed ratio increased. In addition, QP-T:Qleak increased and QT-S:Qleak decreased. Regardless of how the main flow changed, the leakage flow always accounted for about 12% of the main flow.
When the leakage flow directly enters the leakage area without passing through the stator, the two fluids flowing in opposite directions will impact, collide, and assimilate, resulting in the formation of a large number of vortices and energy loss. With an increase in the speed ratio, QT-S decreases, energy decreases, the impact on the leakage area decreases, the internal vortex is significantly reduced, and the effect of assimilating the leaking fluid is more obvious.
Frequency spectrum analysis of the pressure in the torque converter showed that the speed ratio had no effect on the main frequency regardless of whether a leakage area was present. However, when a leakage area was present, leakage flow caused a wideband signal in the low-frequency band and speed changes modified this wideband signal. The combined effect of the rotation speed and the leakage flow changed the main frequency, indicating that the leakage flow has more influence on the flow field in TC. When the leakage area is removed, the dynamic and static interference of the impeller plays a major role, and its performance is substantially improved compared with a leaking TC. Therefore, in the design of the TC, the leakage area should be minimized to improve the TC performance and fuel economy.
Footnotes
Handling Editor: James Baldwin
Declaration of conflicting interests
The author(s) declared no potential conflicts of interest with respect to the research, authorship, and/or publication of this article.
Funding
The author(s) disclosed receipt of the following financial support for the research, authorship, and/or publication of this article: This project was supported in part by the National Natural Science Foundation of China (Grant Number 51975425).