
Abstract
Surfaces of gears under combined rolling and sliding motions may suffer a complicated wear process due to the transient time-varying effect along the meshing path. In this paper, a methodology for predicting the wear of tooth surfaces is developed for the spiral bevel gears. In the wear model, the machined surface roughness, mixed lubrication, friction, flash temperature and the dynamic behavior of gears are all considered. Tooth-Contact-Analysis (TCA) method is used to get the time-varying parameters of meshing points along the meshing path. By simulating real movement process, the material is removed according to the Arrhenius equation. First, the distribution of pressure and film thickness is obtained by solving the mixed EHL model. After that, the flash temperature can be computed by the point heat source integration method with the obtained pressure, film thickness and velocity vector. The material removal is based on surface temperature and sliding distance. The numerical results are compared to the ball-on-disk experiments to demonstrate the reasonableness of the present wear model. And it shows that the angle difference between velocity vectors has strong influences on the wear profile. Furthermore, the mechanism of surface wear evolution is investigated systematically in spiral bevel gears. The difference of the wear track between the pinion and gear surfaces is observed. Besides, in the meshing process of tooth surface, the wear along the meshing path is uneven, which appears to be much greater at the engaging-in and engaging-out areas. There is a position with maximum wear rate in the meshing process, and the position is affected by the load and speed.
Introduction
Surface wear is a common failure mode in gear transmission system. Spiral bevel gears, as key components in the transmission of energy and kinematics between two crisscross axes, widely existed in helicopters, heavy truck, etc., mostly operate in mixed lubrication condition. 1 In mixed lubrication, the lubricant oil does not completely separate the rubbing gear surfaces, indicating that asperity contacts happen. Local asperity contact can cause adhesive wear and abrasive wear due to significant sliding velocity in spiral bevel gears. Wear changes the morphology of the tooth surfaces, which may cause a serious impact on the accuracy and efficiency of the transmission. Therefore, the mechanism investigation of surface wear evolution caused by the sliding velocity is very important for transmission performance improvement of spiral bevel gears. Compared to experimental research, numerical simulation is a conductive way to deeply understand the rubbing tooth wear in spiral bevel gear. 2
Finite element method (FEM), based on the assumption of dry contact, were used in the early studies of spiral bevel gears. For example, Park and Kahraman, 3 Kahraman et al., 4 ever combined the FEM with Archard wear theory to predict the wear profile of spiral bevel gear tooth. As the FEM is very time-consuming, some quick prediction methods for wear are proposed. In Schlecht’s work, 5 and also in Park et al., 6 the lapping process was discretized with time, the spiral bevel gear meshing point was considered as a two-cylindrical smooth Hertz contact, and the load tooth contact simulation was executed using BECAL program 7 at each time step to predict surface wear. Similarly, based on smooth and dry contact assumptions, Huang et al. 8 proposed an integrated model, which combined the Archard’s wear equation with a conjugate approach.
Lubrication and surface roughness play an important role in surface wear in the meshing of gears. However, only a few literatures have considered the effects of surface roughness and lubrication in the wear prediction model. Early studies mainly focused on the lubrication and wear in different meshing positions by separating the meshing process of gears to obtain a steady-state solution.9,10 Most of these works are focused on spur or helical gear, but few researches focus on the wear of spiral bevel gear due to its complicated tooth surface geometry. Morales-Espejel et al. 11 ever built a micro pitting fatigue model to predict the wear of spur gears. In their publication, the film thickness is calculated through Grubin’s experience formula 12 and the asperity contact area is calculated by a statistical roughness model proposed by Greenwood and Tripp. 13 Similar work can be seen by Karagiannis. 14 Due to the complexity of the motion of gears, tooth contact analysis (TCA) method 15 is widely used for spiral bevel gears. Shuai and Yidu 16 have established a high-precision surface model of spiral bevel gear considering the machining adjustment parameters. Shuai et al., 17 Mo et al. 18 find that load sharing characteristics are affected by dynamic response. Some scholars have tried to establish the relationship between gear dynamic and tribology, such as Ding and Kahraman, 19 Li and Anisetti, 20 Cao et al. 21 etc. Mohammadpour et al. 22 have combined the TCA method with non-Newtonian thermos elastohydrodynamic lubrication (TEHL) to improve the efficiency of spiral bevel gear pairs, based on smooth surface assumptions. Recently, Pu et al. 23 have proposed a solution for the Reynolds equation at any entrainment angle for the spiral bevel gears. Their model takes into account the real surface roughness, and relevant studies show that the transient squeezing effects of spiral bevel gear caused by load changes, speed changes, entrainment angle, and contact geometry changes can significantly affect the lubrication state.24–26 With the development of nano-tribology, more and more experiments have proved that the wear is related to energy. 27 Spiral bevel gear transmission has a large sliding speed and a high interface temperature rise in high-speed condition. Therefore, the energy wear model combined with the transient mixed lubrication model proposed by Pu et al. 23 may provide a new idea for revealing the wear mechanism of spiral bevel gears.
In this work, a dynamic surface wear prediction model along the meshing path of spiral bevel gear is developed based on the thermal wear theory and the transient mixed lubrication model, and this model is validated by the ball-on-disk experiment. In the present study, the TCA is employed to calculate the time-varying parameters along the meshing path, including the curvature radius, velocity, and contact load, etc. After that, the dynamic variation of film thickness, contact pressure and surface flash temperature are analyzed in the process of engaging-in to engaging-out by the transient mixed lubrication model. With the sliding velocity vector and the flash temperature distribution, the dynamic surface wear model is developed along the meshing path based on the Arrhenius equation, and the evolution of surface topography is obtained due to wear at each meshing cycle. In addition, the effects of speed and load on the surface wear are investigated systematically from engaging-in to engaging-out.
Dynamic wear model for spiral bevel gears
As the tooth surface geometry of spiral bevel gears are very complex, the parameters such as the radius of curvature and surface velocity vector along the meshing path, cannot be expressed by analytical expression directly. The tooth surface parameters of the spiral bevel gears are determined by tooth cutting operation. To obtain these parameters in contact position of the coupling gears, it is necessary to take the two gear parameters into the same coordinate system. The assembly relationship of the pinion and gear is shown in Figure 1.

Contact relationship in spiral bevel gears.
In Figure 1,
Basic equations
The relative sliding speed and entraining speed between pinion and gear can be obtained by the following formula:

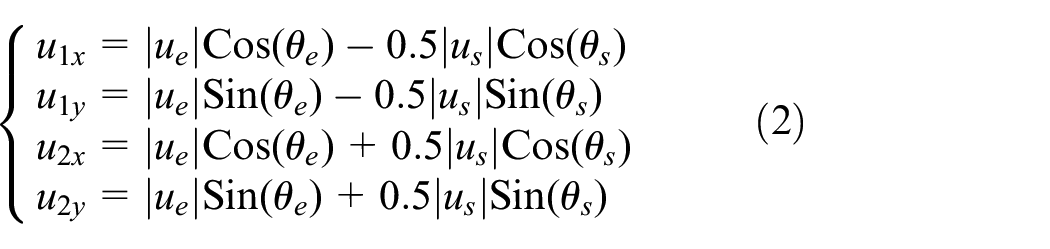
The velocities of the two surfaces in the direction of the elliptical axis can be expressed as:
The following deformation coordination equation and load balance equation are used to get the load distribution.

Where,
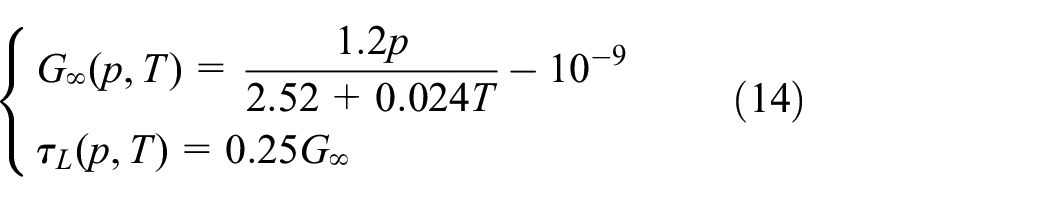
Although the Archard’s wear formula has been widely recognized, with the development of nano-tribology, more and more experiments have proved that the wear is related to energy. Arrhenius-based wear formula has been further developed, such as Bernd and Mark, 27 Risken and Frank. 29 They found that the wear rate can be obtained by the following formula.

The subscripts and indicate the abrasion and abrasive wear, respectively,

Some simplified assumptions are set to calculate wear, (1) Wear occurs where the gap is 0, (2) the wear rate is in accordance with equation (5) and (3) The abrasive particles generated by wear do not affect subsequent wear, and it is will be discharged quickly with relative movement.

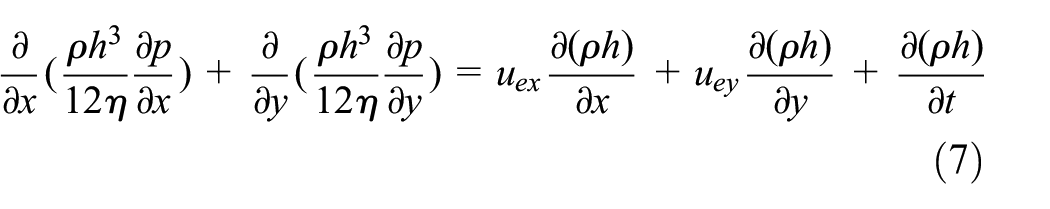
In order to calculate the wear between the surfaces, parameters such as film thickness, pressure, shear stress and flash temperature need to be obtained by solving the Reynolds equation and temperature equation. For spiral bevel gears, the velocity vector is not parallel to the short axis of the contact ellipse, and the entraining speed can be decomposed into
The film thickness (or gap) equation is as follows,
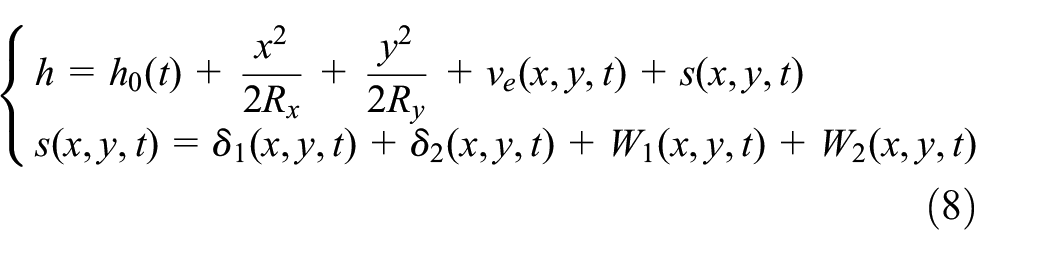
Where
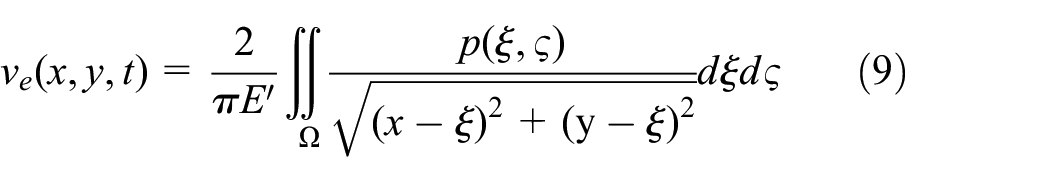
The elastic deformation is as follows.
Isothermal viscosity equation is used in soling Reynolds equation,

The density is also solved using an isothermal pressure density formula

In the formula above,
The load balance equation is as follows

Detail solutions of the Reynolds equations can refer to Pu et al. 23 and Hu and Zhu. 30 The temperature and shear forces can be solved using the pressure and film thickness calculated by Reynolds equation.
In the EHL region, the Bair-Winer’s rheological model is used,

In EHL region, the shear rate is generally considered to be inversely proportional to film thickness. In boundary lubrication region, the friction coefficient is usually set to be a constant (take 0.07–0.15).
A point heat source integration method proposed by Carslaw and Jaeger, 31 which ignores the influence of thermal convection has been widely accepted. The following fast heat source model32–34 is used,

The two surfaces in equation (15) are assumed to be 1, 2, represented by the subscript. So,
The friction calculation formula can be expressed in the following form:

Numerical simulation process
In the present study, in order to consider the transient squeezing actions along the meshing path caused by the variation of speed, contact load and radius of curvature, the wear process in a mesh cycle for one pair of teeth is calculated in a continuous way. The Figure 2 shows the wear simulation process. First, the contact path from engaging-in to engaging-out is divided into

Flow chart of the model.

Three-layer meshes of the contact model.
After that, the lubrication behavior and surface wear at the following meshing point n2 can be calculated by considering the transient squeezing action from the previous meshing point n1. Repeat this process, until the wear at the
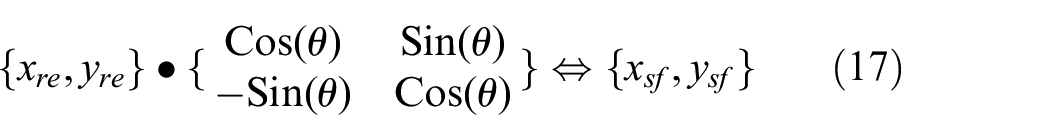
The contact point of spiral bevel gears is an elliptic point contact in the simulation. Three-layer meshes are used in the model, the first one is the discrete grid for Reynolds equation, and the other two meshes are the discrete roughness grids for the two surfaces. Because the speed directions of the two contact bodies do not coincide, in order to save the number of grids and to ensure the continuity of the grid movement under continuous motion, independent coordinate systems are introduced for the three kinds of meshes. The mesh numbers are as follows.
As shown in the figure above, the contact center is chosen as the zero point for the three coordinate systems. For the solution of Reynolds equation, the short axis of contact ellipse is chosen as the
It should be noted that the mesh of the surface should be denser than that of the Reynolds solving region, and different meshes can interact with each other through interpolation and mapping.
Model validation
Because it is difficult to measure the surface wear of spiral bevel gears, and the key of the present wear model is considering the entrainment speed angle, a ball-on-disk wear experiment with a speed angel, 90°, is conducted to verify the present wear model.
Experiment introduction
The surfaces of ball and disk used in the experiments are machined, and the ball has been polished. Diameter of the ball is 38 mm. Materials of the ball and disk are GCr15 bearing steel, and the ball has been hardened after heat treatment. Root mean square roughness of the ball and disk are 0.05

The assembly of test pieces.
The wear experiments are performed for 64 min and 128 min, respectively. The topography of disk surface is scanned using an optical profiler. Since the hardness of the ball is greater, it is assumed that the ball is not worn. The wear coefficient of ball is also set to be 0 in the simulation. Meanwhile, the change of the friction coefficient during the wear process is recorded. More information about the laboratory device. 37
Surface evolution of the disk over time
256 × 256 grids are used in the simulation. The solving domain is −2.0 a∼2.0 a in x direction, and −2.0 b∼2.0 b in y direction, for the Reynolds equation. The verification logic is as follows, the acceleration wear coefficient
The test results are shown in A Figure 5. The 64-minutes wear volume is used to fit the wear coefficient and the wear simulation lasts for 3000 cycles. The simulation cycles corresponding to 64 min is 1000 cycles. The simulation results are shown as follows.
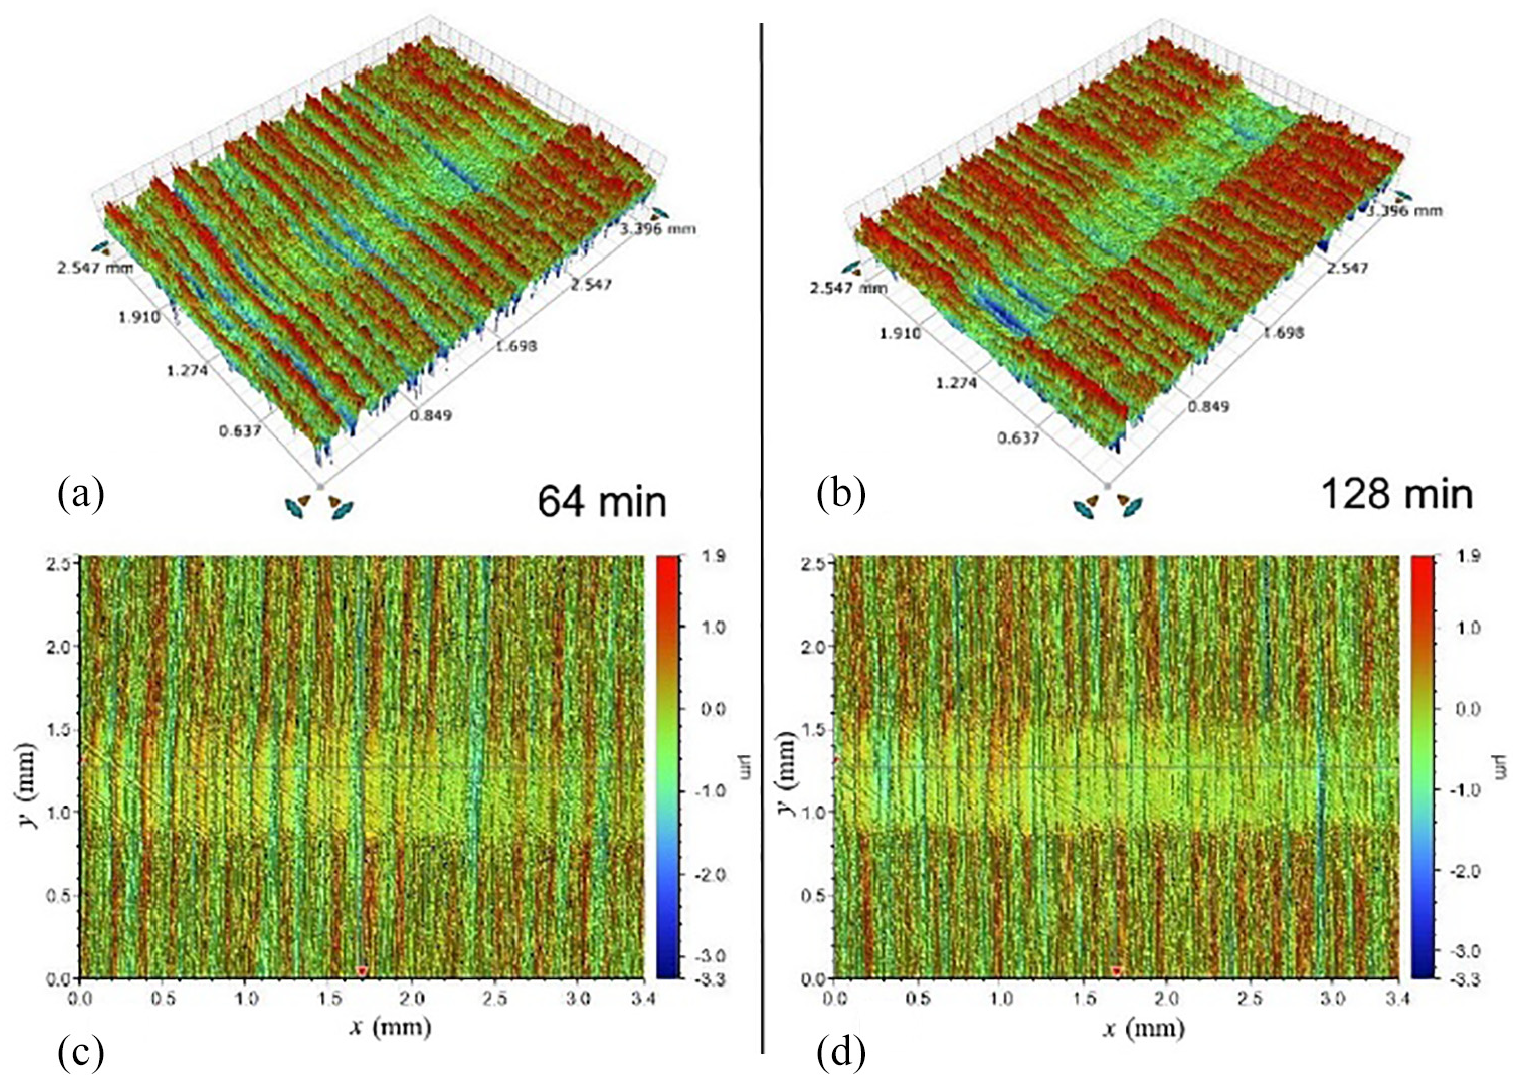
Wear tracks after different running times (speed angle 90°).
It can be seen from Figure 6 that there are scratches inclined to the trajectory direction, which is similar to the experiment results. With the increase of wear simulation cycles, the wear gradually increases, and the inclined scratches become obvious. Because the wear track is shallow, the y-z section is greatly affected by the roughness, so the average cross section is used to show the wear. Average wear profiles in y-z section are shown in Figure 7.

Wear simulation results at different cycles (speed angle 90°).

Average wear tracks: (a) Experiment and (b) Simulation.
It appears from Figure 7 that the wear track is not symmetrical, which is different from the wear track under traditional rolling and sliding contact. 37 And the wear on the left side is greater because of its closer to the exit area. At 1000 wear cycles, the shape of the average wear track is not in good agreement with the experimental results. This may be caused by the random roughness error. Meanwhile, the simplified assumptions made by the model also have a certain impact, but with the increase of wear cycles, the simulation results are getting closer to the experimental tracks. Overall, the wear track predicted by the simulation show good agreement with the experimental results.
Figure 8 shows the evolution of film thickness and surface flash temperature distributions during the wear simulation process. The white area in the film indicates the asperity contact, and the white area in flash temperature indicates that the temperature rise is higher than 65°C. It can be seen that with the influence of wear, the asperity peaks on the disk are worn away, the film thickness will increase, and the flash temperature will decrease. After 3000 cycles of wear, the contact area is still partly in boundary lubrication, and the boundary lubrication area is mostly concentrated on the left entrance area. According to the typical point EHL film distribution for which the velocity in

Film thickness and flash temperature as a function of time.
Figure 9 shows the change of friction coefficient during the wear process. The simulation friction coefficient is very close to the measure ones when the wear is not happened, and the friction coefficient decreases during the wear process. The difference is that the simulation results underestimate the friction coefficient after wear. This may be that the simulation environment is very ideal, and the influences of wear debris are ignored. In the present model, wear is an added term of the film thickness equation, so the film thickness may be overestimated when calculating friction after wear. But in general, the simulation results appear to reasonable.
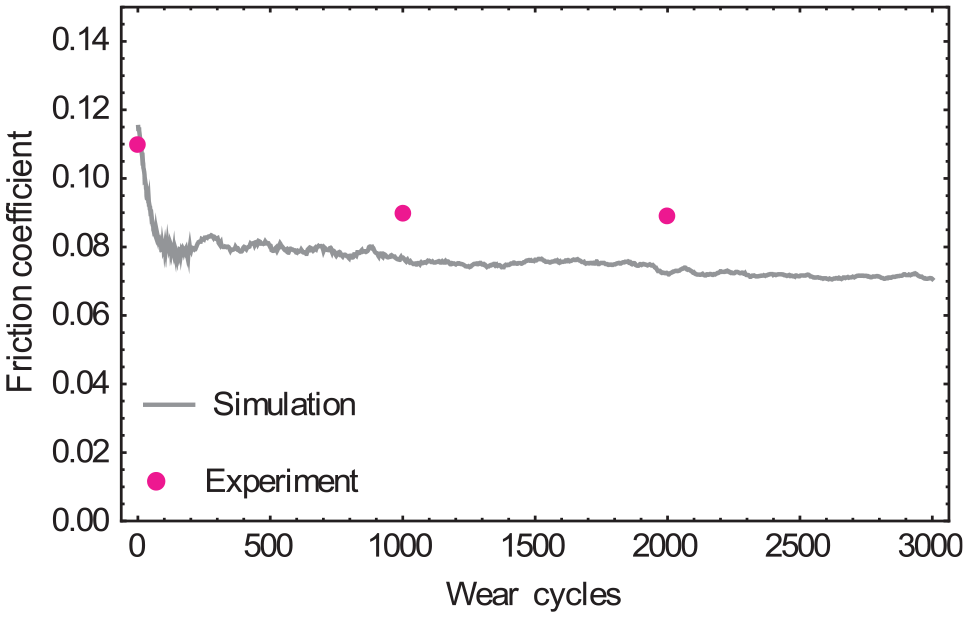
Friction coefficient as a function of time.
Wear analysis of spiral bevel gears
Simulation parameters
The gear parameters for the simulation are shown in Table 1.
Parameters of the gears. 21

Taking the torque of 100 N·m and 25 rpm (gear speed) as an example, the dynamic parameters along the meshing path are shown in Figure 10.

The dynamic parameters along the meshing path: (a) Velocity, (b) Radii, (c) Load and (d) Contact half width.
It can be seen from Figure 10(a) that along the meshing path, the speeds of the pinion and gear are almost the same in the direction of the major axis of the contact ellipse (
According to Figure 10(d), the contact width may be more than double compared to the engaging-in point during the meshing process, if the solving region is not long enough, a large error may occur. Therefore, in the simulation, the solving range is −4.3
According to TCA results, the meshing path is about 9.6 mm. During the single-tooth meshing process, the gear rotates about 0.19 rad. So, dt can be calculated by discretizing the path into 2001 points, and its value is about 0.363 ms. The length of the surfaces should be greater than the sum of the contact path and the half-contact width at both ends. The optical profiler cannot scan such a long path, directly. In present study, a 13 mm×4.2 mm surface is generated by rotation and array of a partial scan. The surface data is composed of 6501×3001 points, the distances between two neighbor points are 0.002 mm (longitudinal direction) and 0.0014 mm (width direction), which is much smaller than the grid gap for the Reynolds equation. Because the gears are processed in the same way, same surface roughness is used for pinion and gear, and root mean square roughness is set to be 0.32

Pinion, gear and the scanned surface.
The speed effect
To study the effect of speed on wear, the torque is fixed at 100 N·m in the simulation, and the rotation speed of gear is set to 25, 100, 400 and 1600 rpm, respectively. The gear meshing at these four speeds is simulated, and the wear coefficient is set as 0.005 in the simulation. A set of cases without wear is also simulated for comparison. Figure 12 shows the change of film thickness ratio along the contact path during three engagement processes at different rotation speeds.
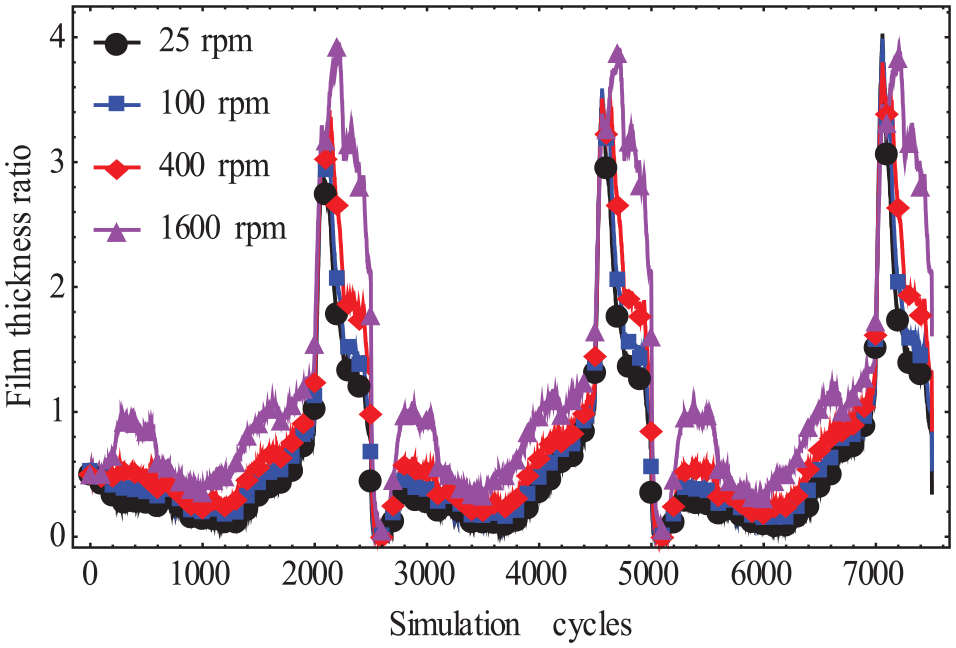
Film thickness ratio as a function of simulation cycles with wear.
In the simulation, the first 500 cycles are used to iterate to convergence, and the next 2000 steps are used to simulate the actual contact process. Therefore, the 500–2500 cycles, 3000–5000 cycles, and 5500–7500 cycles represent the three-meshing process because the contact path from engaging-in to engaging-out is divided into 2000 discrete points as shown in section 2.2. After the wear is introduced, the changing trends of film thickness during each meshing process are basically the same. Figure 13 shows the changes of film thickness during a single meshing process (500–2500 cycles). The film thickness ratio in this research is the ratio of film thickness to the root mean square roughness after deformation.

Film thickness ratio versus gear angle for different speeds: (a) No wear and (b) Wear.
It is clear in Figure 13 that the film thickness ratio increases with the increase of rotation speed in the fixed meshing position. During the meshing process, the film thickness ratio initially decreases and then increases, when the gear rotates to about 0.15 rad, due to the sudden change in load (see Figure 10), the film thickness ratio increases rapidly. Compared to the film thickness ratio curve before wear with that after wear, it can be found that the film thickness ratio has increased after the introduction of wear, especially at the low speed of 25 rpm. But the introduction of wear will not change the evolution trend of film thickness ratio along the meshing path.
As can be seen in Figure 14, it is obvious that the friction coefficient decreases with the increase of speed. During the meshing process, the friction coefficient increases first and then decreases. After the introduction of wear, the overall friction coefficient has decreased. The friction coefficient changes significantly along the meshing path before and after the introduction of wear. Under low-speed conditions, the oil film is thin, and asperity contact shear stress is the main source of friction. When wear is introduced, the lubrication film is enhanced, and asperity contact decreases. So, the trend at low speed becomes closer to the trend at high speed. Similar friction evolution trend can be seen in Cao et al. 38
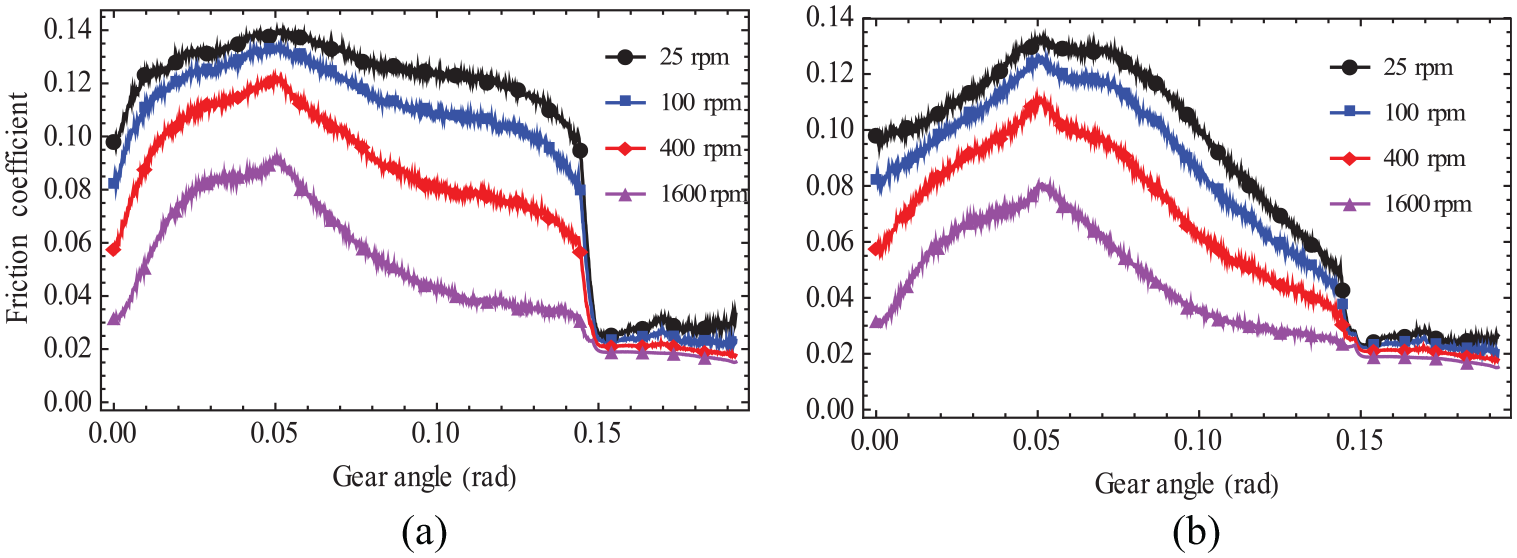
Friction coefficient versus gear angle for different speeds: (a) No wear and (b) Wear.
Figure 15 shows the distribution of film thickness and flash temperature at different rotation angles of the gear during the first meshing process (rotation speed = 100 rpm). The evolutions of film and flash temperatures provide further support for friction and wear mechanism along the meshing path. Obviously, the contact width is affected by the load, and the average film thickness is affected by the combination of load and speed. In the transmission process, when the gear angle is between 0.0 and 0.10 rad, the relative sliding speed shows a trend of decreasing first and then increasing (the turning point is at 0.065 rad), and the load first increase and then remains stable (the turning point is at 0.05 rad). Combining the dynamic parameters with the above figure, it can be concluded that during the meshing-in period (about 0–0.065 rad), due to the continuous increase of the load, the film becomes thinner, and the flash temperature decreases due to the decrease of relative sliding speed. Although the increase of load and the thinning of film may increase the flash temperature, the effect of sliding speed may be greater. During the meshing-out period (about 0.05–0.14 rad), due to the increase of the total speed and sliding speed, the film becomes thicker, and the flash temperature increases. The gear angle at 0.15 rad is the position in multi-tooth engagement, the other tooth takes away some torque, resulting in a sudden reduction in load, the film becomes thicker and flash temperature decreases.

The evolution of film thickness and flash temperature during a meshing process.
Figure 16 is the wear rate of gear and pinion with the rotation of gear during the first meshing cycle (500–2500 cycles).

Wear rate versus gear angle for different speeds: (a) Gear and (b) Pinion.
It should be pointed out that the materials and wear coefficient are the same for pinion and gear in the simulation, so the wear rates are almost identical, which may be different from that in engineering. It can be seen from Figure 16 that the speed has a great influence on wear rate. In a single mesh, the higher the speed, the smaller the wear rate. Generally, the film thickness increases with the increase of speed, thereby reducing asperity contact. It can be found that the wear rate along the gear angle is very uneven. During the meshing-in period (0–0.065 rad), due to the continuous increase of the load and the continuous decrease of relative sliding speed, the wear rate first increase and then decrease. During the meshing-out period (about 0.065–0.14 rad), the load does not change much, both the total speed and relative sliding speed show an increasing trend. The increase in speed will improve the lubrication performance and reduce wear, while the increase in relative sliding speed will increase wear. So, the wear rate also shows a trend that first increase and then decrease. At low speeds, the wear rate does not increase significantly during the meshing-in period. Comparing the wear rate at the four speeds, it can be found that the maximum position of wear rate changes with the speed. At the speed of 25 rpm, the maximum wear rate occurs in the meshing-out period. At the speed of 1600 rpm, the maximum wear rate occurs in the meshing-in period. And at 400 rpm, the maximum wear rate is almost the same in the meshing-in and meshing-out period.
The morphological evolution of the surfaces with increasing meshing cycles (rotation speed = 100 rpm, load = 100 N·m) reveals the mechanism of spiral bevel gear wear (Figure 17). Generally, for spur gears, the wear at the tooth tip and root is greater than that at the pitch. A similar effect is achieved in our simulation for the spiral bevel gears. The wear tracks for pinion and gear are obviously different. The track of pinion is more curved. This may be attributed to that the speed of pinion is higher, and its speed direction changes more with gear angle.

Evolution of surfaces with gear meshing times.
The load effect
To compare the effect of load on wear, the speed is fixed at 200 rpm in the simulation, and the load is set to 12 N·m, 50 N·m and 100 N·m, respectively. The gear meshing at these three loads is simulated. When the gear rotates to 0.145 rad, there will be a sudden decrease in load, resulting in very low wear rate. These little wears may have limited effect on the gear performance. Therefore, the gear angle of 0–0.145 rad during a mesh cycle is analyzed in the subsequent analysis.
Figure 18 shows the changes of film thickness during the first meshing process for different loads. Under light load, the change of film thickness ratio along the meshing path is not obvious, but under heavy load, the film thickness ratio has a downward trend at the meshing-in period. After the wear is introduced, the film thickness ratio under heavy load has increased, while the film thickness under light load remains invariable. This may be because wear is related to the temperature, the smaller the load, the less the shear heat.

Film thickness ratio versus gear angle for different loads: (a) No wear and (b) Wear.
As can be seen from Figure 19(a), there is a rising phase for friction coefficient in the meshing-in process, and the friction coefficient increases with the increase of load. After the wear is introduced (Figure 19(b)), the increase of friction coefficient is scarcely observed under the load of 12 N·m. This may be because that the friction coefficient decreases after the introduction of wear, which offsets the increase trend of friction. It is obvious that large load would cause a greater friction coefficient.

Friction coefficient versus gear angle for different speeds: (a) No wear and (b) Wear.
It is evident in Figure 20 that load has a great influence on wear. Increasing load results in an increase in wear rate. The evolution trends of wear rate under different loads are basically the same in Figure 20. The location of maximum wear rate also varies under different loads, compared to the cases under different speeds.
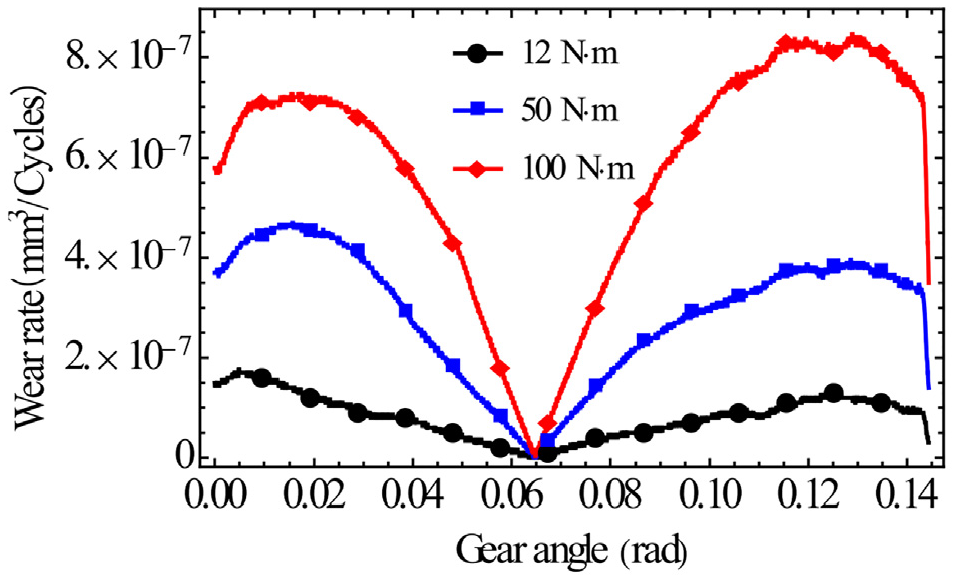
Wear rate of gear versus gear angle for different loads.
Conclusions
A wear model of spiral bevel gears has been introduced in this paper. The model considers the time-varying load, geometry, speeds, lubricant, elastic deformation, real machined surfaces and other factors during the meshing process. And it is verified through ball-disk experiments. Numerical wear simulations are executed to reveal the variations of gap and flash temperature distribution along the meshing path. The influence of rotation speed and load on wear and the evolution of surfaces have been studied. The following conclusions can be drawn.
Under mixed lubrication, when the velocity directions of the two contact bodies are staggered, the distribution of wear tracks will be asymmetric, and the wear are more severe on the side close to the outlet area.
Speed and load have a great influence on wear. Increasing the speed or reducing the load can effectively reduce wear.
Whether it is in the process of meshing-in or meshing-out, the wear rate increases first and then decreases.
There is a position with maximum wear rate in the meshing process, and the position is affected by the load and speed.
Footnotes
Appendix
Acknowledgements
Wei Pu wants to express his gratitude to Prof. Dong Zhu for the guidance in contact and lubrication methods.
Handling Editor: Hui Ma
Declaration of conflicting interests
The author(s) declared no potential conflicts of interest with respect to the research, authorship, and/or publication of this article.
Funding
The author(s) disclosed receipt of the following financial support for the research, authorship, and/or publication of this article: The present study was founded by the National Science Foundation of China (NSFC) Project No. 51875369 and No. 51805505, Central Universities No. YJ201752 and Chongqing Key Industry Project No. cstc2017zdcy-zdzxX0001.