
Abstract
In this study, a four-stroke, naturally aspirated, single-cylinder, spark ignition engine was operated with neat gasoline fuel. In-cylinder pressure, performance, and emission values were obtained at full load and 2400-r/min constant engine speed. Using these values, a single-dimensional theoretical model was calibrated. A Kistler spark plug–type pressure sensor was used to obtain in-cylinder pressure. After validation of this single-dimensional theoretical model obtained by the help of a commercial engine analysis software (AVL-Boost), different levels of ethanol addition (2.5%, 5%, 10%, 15%, and 20%) into gasoline were analyzed and compared with neat gasoline fueled conditions. According to obtained results, NO x emissions increased with incremental amount of ethanol. The CO and total hydrocarbons emissions decreased; however, they can be controlled using after-treatment systems such as three-way catalyst.
Introduction
At the present time, considerable amount of the energy requirement, especially in transportation, is provided from fossil fuels. Sources being limited and emissions which are harmful to human health that are generated by fossil fuels caused researchers to focus on alternative energy sources including ethanol.
Alcohol-based fuels or additives such as ethanol are preferred since they are renewable and can be easily mixed with conventional fuels. 1 Being one of the fuels that can be produced from natural and renewable sources, 2 ethanol is thought to have a role in reducing proportion of fossil fuel used in transportation. In addition, having a higher flame speed in comparison to gasoline, ethanol is predicted to provide increase in thermal efficiency by improving combustion. 3 The US Environmental Protection Agency (EPA) allows ethanol to be used in light-duty vehicles up to 15% by volume (E15) in addition to gasoline. 4
While some researchers experiment with gasoline and gasoline–ethanol mixtures up to high ethanol rates, 2 many researchers argue that low ethanol rates are more advantageous in terms of performance and emission characteristics.1,5,6 Zhang and Sarathy 7 found that 32% ethanol addition provides the highest CO2 reduction among E0–E40 ethanol proportion range.
Low stoichiometric ratio of ethanol causes the stoichiometric ratio to decrease with increasing ethanol in fuel. In cases where amount of fuel sprayed in the fuel system by an adjustment is not increased, ethanol increase causes fuel mixture to become leaner. 8 Due to this depletion of fuel and low energy content of ethanol, the results obtained in some studies in the literature have shown a decrease in peak pressure and temperatures in-cylinder.1,9 It has been concluded that pressure and temperature increase in-cylinder as ethanol content increases in the experiments realized under constant air excess coefficient condition. 5 When high flammability range and relatively high adiabatic flame speed of ethanol is considered, the reason of higher maximum pressure and heat release rate (HRR) values closed to top dead center (TDC) can be explained by combustion completed in a shorter period of time. This effect leads combustion to be completed faster and cycle to show closer characteristics to ideal constant volume combustion and maximum pressure values to increase and efficiency to improve.5,10
Lower stoichiometric ratio of ethanol allows to burn more fuel mass with the same amount of air, while lower vapor pressure and higher heat of evaporation of ethanol increases volumetric efficiency with increasing ethanol content. 11 Hence, for the same cylinder volume, more amount of fuel mass can be taken and burned efficiently thanks to higher flame speed of ethanol. These effects provide slight increase in engine power, torque, indicated mean effective pressure (IMEP), as mentioned by some researchers.2,10–13
Low energy content of ethanol per unit mass causes an increase in specific fuel consumption. However, ethanol can provide lower specific energy consumption in spite of higher specific fuel consumption. 9 Li et al. 13 analyzed the specific energy consumption in their study and concluded that ethanol reduced indicated specific energy consumption (ISEC). Iodice et al. 14 also calculated energy consumption in kJ/km at a driving cycle. They found decreasing energy consumption trend with increase in ethanol content while fuel consumption increases. This result is due to the indicated thermal efficiency, which increases with the burning time shortened due to the high flame rate.
High octane number and heat of evaporation of ethanol also improve knock resistance of engine.1,15 Using this feature, which increases the knock resistance, in some studies where the ignition advance and compression ratio of the spark ignition (SI) engines are increased, significant improvements in performance values such as efficiency and power have been achieved. 16
Low carbon content of ethanol reduces CO emission. Moreover, one of the most dominant parameters affecting CO emissions is the air excess coefficient. 17 In studies where the spray amount is not increased, ethanol makes the mixture leaner providing a significantly reduced CO emission, especially with rich mixtures. 8
Studies have reported that more complete combustion caused by increased oxygen content with ethanol supplement reduces total hydrocarbons (THC) emission. 11 In addition, in studies where the compression ratio was increased by taking advantage of the high octane number of ethanol, it was observed that the increased cylinder temperatures decreased THC and CO.2,16
There is often a consensus in the literature that the ethanol addition reduces CO emissions with its low carbon content and more complete combustion due to its oxygen content. 3 However, some researchers have reported that decreasing in-cylinder temperature and incomplete combustion increases THC emissions due to its lower heating value and high heat of evaporation. 13
NO x emission formation contains complex mechanisms such as thermal NO x , prompt NO x , intermediate N2O, and fuel NO x . 3 The resulting oxides of nitrogen are formed from nitrogen and oxygen in the atmosphere and in general, the most important parameter affecting the amount and the formation is the temperature. For ethanol–gasoline blends, thermal NO x formation is a dominant mechanism. 3
In the literature, there are different opinions and obtained results about ethanol ratio increase in gasoline on the effect of NO x . 3 According to the results of some researchers, NO x formation decreases due to the high evaporation heat of ethanol causes the falling in-cylinder temperatures. 18 According to some researchers, NO x emission depends on the operating conditions of the engine rather than the ethanol rate. 6 However, in cases where engine and ignition advance are not modified, it is reported by Dai et al. 19 and Li et al. 13 who compared ethanol and gasoline and by Costa et al. 12 who compared ethanol and ethanol-gasoline mixture in their studies that ethanol causes lower THC and CO, higher NO x emission. In study of Stump et al. 20 who performed tests on different vehicles at cruise cycles, it is found that HC and CO emissions decrease with ethanol addition while NO x emissions mostly increase. Despite not being as dominant as the temperature effect, the oxygen concentration in the environment also shows an effect that increases NO x formation. 21 Hence, oxygenates of fuel show increasing effect on NO x , while they decrease CO and HC emissions.3,22,23 It is estimated that combustion completed in less time by virtue of high flame speed allows less reversible reactions, thus resulting in more NO x emissions, since forward and reverse NO x reactions have different rate coefficients depending on temperature and NO x formations freeze early in the expansion stroke. 24 Moreover, Iodice et al. 14 observed that ethanol addition considerably improves cold-start emissions during their driving cycle tests with gasoline and E10, E20, and E30 blends.
Particulate number (PN) emission is also a concern especially for gasoline direct injection (GDI) engines. 25 In spite of cooling effect with high heat of evaporation, adequate proportion of ethanol addition has reducing effect on PN emissions since containing –OH bonds contribute to the oxidation of soot precursors. 25 Leach et al. 26 investigated E20, E85, and GEM (a blend of gasoline, ethanol, and methanol) in a highly boosted GDI engine at different operating conditions in terms of engine speed, exhaust gas recirculation (EGR) rate, exhaust back pressure (EBP), air–fuel ratio (AFR), brake mean effective pressure (BMEP), and ignition advance. However, they concluded that E85 PN emission values were very low for all operating conditions, while E20 values were slightly or significantly higher than that of base fuel depending on operation conditions.
Sakai and Rothamer 27 conducted their experimental study by sending premixed and pre-vaporized gasoline and ethanol mixture to the engine, due to the physical mixture of ethanol and gasoline in the liquid phase being problematic. They investigated the effect of equivalence ratio change and ethanol amount on the soot formation. As conclusion, the increase in the ethanol ratio observed that causes less soot formation at the same equivalence ratio.
As can be seen in Table 1, ethanol is used as an additional fuel because of its properties like high adiabatic flame speed, low carbon ratio, and higher octane number compared to gasoline. Although in literature there are many research studies about ethanol, the subject is still open to be developed, since some characteristics highly depend on engine features and operating conditions. In this study, validation was performed between the data from a single-cylinder SI engine and a one-dimensional (1D) model created in AVL Boost software. Afterward, this model is used to compare gasoline and gasoline–ethanol blends at different ratios in terms of emissions and performance at constant engine speed.
Properties comparison of ethanol and gasoline. 3

Benefiting from high octane number of ethanol, except for cases where compression ratio or ignition advance are increased, 16 performance values (power, moment, efficiency, etc.) 5 of ethanol compounds with low rate are more advantageous in terms of emission values like HC and CO8,28 compared to gasoline. Moreover, usage of ethanol mixtures with low rate between 3% and 10% 29 or up to 24% 30 is supported for a long time over many regions of the world. Low ethanol rates can be used without any need for modification in a standard SI engine and is more advantageous at cold start. 28 Taking all these advantages of ethanol in consideration, E2.5, E5, E10, E15, E20 gasoline–ethanol mixtures are observed in this study. Stoichiometry condition is targeted in terms of catalyst efficiency in three-way catalyst engines that are frequently used in emission reduction. 14 In this study, the results were obtained by preserving the stoichiometric condition regardless of the ethanol content.
Material and methods
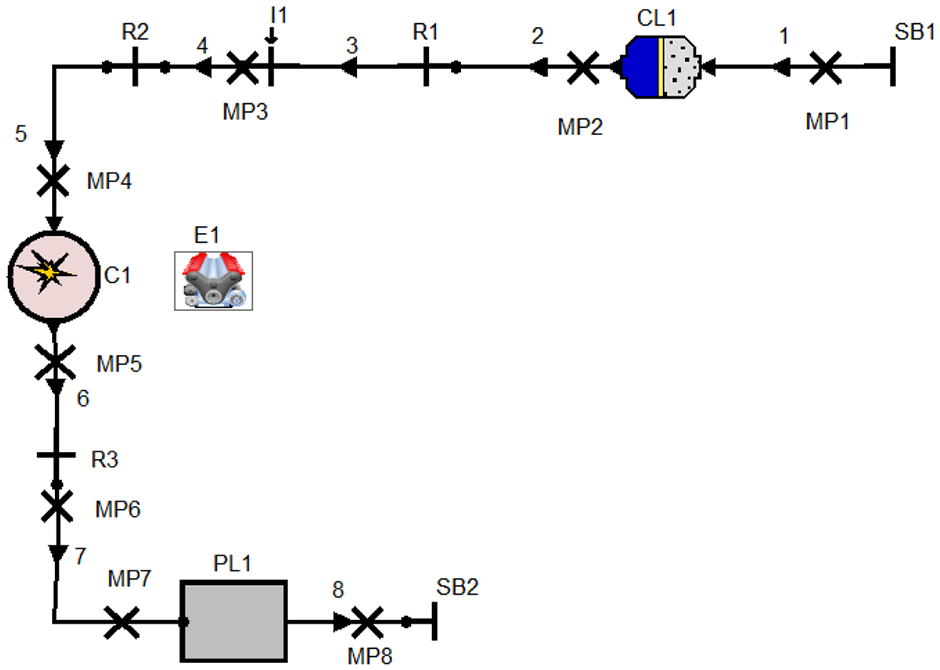
As shown in Figure 1, the test engine is loaded by an 8-kW AC dynamometer which it was connected to. And pressure, fuel consumption, and emission measurements were collected for the post process to be performed.

Schematic view of test setup.
Experimental process was carried out at 2400-r/min engine speed. Both experimental setup and theoretical models are built for the purpose of operating at stoichiometric conditions for neat gasoline and gasoline–ethanol blends. Stoichiometric AFRs of the gasoline and ethanol were assumed as 14.6 and 8.97, respectively. The tests were conducted at Yildiz Technical University, Internal Combustion Engines Laboratory.
Experimental setup
The tests were conducted on a 270-cc, Honda, single-cylinder, air-cooled SI engine. The engine is loaded by an 8-kW AC dynamometer with external resistive load banks.
Pressure data were obtained by the use of a Kistler 6118B in-cylinder pressure transducer, which acts as a spark plug as well. Data collecting by this transducer were sent to Kistler Kibox combustion analyzer device for processing. In order to obtain engine speed and crank angle position information, an incremental-type encoder was used.
A miniature oval gear–type fuel flow meter was installed to the fuel line in order to determine fuel consumption of the engine. An AVL Digas 4000 device was used for the purpose of measuring exhaust emissions. Measurement of mass flow rate of intake air was carried out by the help of a mass flow meter. Afterward, collected data were transferred to personal computer for post-processing.
Since emission measurements were carried out and flow rates of gasoline and intake air were obtained, specific emission values can be calculated by the help of method announced by The Mechanical Engineering Industry Association (VDMA) exhaust emission legislation for diesel and gas engines, which is a guide explaining how to represent emission values measured as base and describing the execution of emission calculations in different regulations in line with the existing standards, such as equations (14), (15) in section “Data reduction.” 31
Engine specs and dynamometer features
Experiments were executed with a 270-cc, single-cylinder, four-stroke, air-cooled, naturally aspirated SI engine. In order to load the test engine, 8-kW AC dynamometer was used with external resistive load banks. Further information about the test engine and dynamometer is shown in Table 2.
Engine specs and dynamometer features.

Modeling of SI engine
AVL boost software was used for modeling of a single-cylinder, naturally aspirated, four-stroke SI engine. In the model, NO x emissions were calculated based on the Pattas and Haftner calculation techniques, which are performed with the consideration and the extension of six Zeldovich equations. CO emission was obtained based on Onorati method, which is widely used for zero-dimensional (0D) and 1D software in the literature. HC emissions were calculated with D’errico model which is the most commonly used model in SI engines. For HC formation, contributions of crevice and HC absorption, desorption mechanisms, and partial/incomplete combustion effects were considered. 32 Created 1D engine model is depicted in Figure 2. Vibe 2 Zone 0D combustion model was also used as a part of the engine model.
The schematic view of the SI engine model.
After validation of the gasoline-fueled SI engine model by comparing the experimental data from tests, the model was configured for gasoline–ethanol fuel blend operation conditions. Gasoline and ethanol fuels were chosen for simulations from Classic Species Setup of AVL Boost which is used by software in order to calculate combustion kinetics and intermediate reactions during combustion and hence emissions. The parameters of the engine model and Vibe 2 Zone combustion model used in the present study were determined by the help of experimental data of gasoline operation. In other respects, Vibe parameters used for ethanol fuel simulations have been previously determined by studies with similar engine geometry by considering ignition delay and combustion duration of different gasoline–ethanol fractions. 33
Data reduction
In order to execute performance, combustion, and emission analysis, measured data collected via transducers and simulation results were used in calculations. Equations are shown in this section.
Indicated engine power equation can be obtained as shown in equation (2) 34 by the help of indicated engine work, calculated as in equation (1) 34


where
By the use of indicated engine power value, indicated engine torque can be calculated as given in equation (3) 15

where
IMEP (MPa) value can be obtained as in equation (4)

where
Ethanol energy content of fuel can be calculated using volume ratios and lower heating values of gasoline and ethanol in the form of equation (5) 15

where EER is ethanol energy ratio in fuel blend (%);
AFR of eventual fuel blend (gasoline + ethanol) can be calculated using equation (6) written as follows 35

where
Performance characteristics can be analyzed using of calculated indicated engine power value and measured pressure and flow rate values.
Total ISEC can be derived as shown in equation (7)

where
Indicated thermal efficiency of the engine was reached using unit conversion of ISEC as seen in equation (8)

where ITE is indicated thermal efficiency of the test engine by %.
Cylinder volume can be calculated as given in equation (9) below 36

where
Rate of heat release was obtained as given in equation (10) 37

where
HRR values were obtained using Vibe function as shown in equations (11)–(13) 32


where
The parameters of Vibe function are approximated also using mass fraction burned equation of Vibe.
While tests were executed, exhaust emissions were measured using gas analyzer by volume. Mass flow rate of total exhaust gases can be given in the form of equation (14) by adding measured flow rate of intake air and consumed fuel. 31 Hence, specific emissions can be calculated as seen in equation (15) 31


where
Kline and McClintock analysis 38 determined the total propagated uncertainty of the Precision and Systematic (Bias) errors measurement as seen in equation (16)

Hence, the total uncertainty
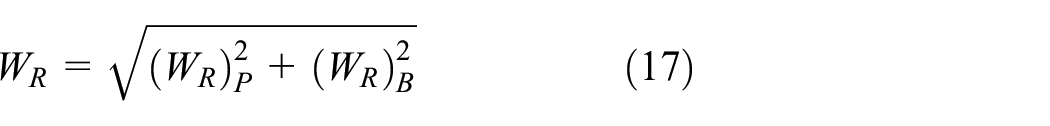
where
Measurement accuracies of the experiments and the calculated uncertainties are given in Table 3. Uncertainties of the numerical model are not investigated since it is not possible to see the entire equation running in the background thoroughly.
Measurement accuracies and the calculated uncertainties.

Test procedure
In this study, experimental and simulated results were examined, respectively, as follows:
Emissions and performance values were measured with a 270-cc, single-cylinder SI engine, under the condition of constant engine speed, using neat gasoline fuel at stoichiometry, and necessary abovementioned calculations were made.
Engine tests were calculated as 2400 r/min under the intermediate speed condition (75% power) as stated in ISO 8187 and Directive 2013/53 EU, and executed at the operating point under these conditions.
Tested engine’s model was created with the help of AVL Boost software under the conditions of 2400-r/min engine speed and at stoichiometry. The results provided from simulation, results and calculations provided from tests were compared, and model was validated.
Simulations were performed on validated model by adding ethanol to the fuel, respectively, 2.5%, 5%, 10%, 15%, and 20% by volume (E2.5, E5, E10, E15, and E20), and combustion characteristics, emissions, and performance values were examined.
Simulations were performed under stoichiometric conditions by calculating excess air ratio for different fuel fraction operations.
Results and discussion
After validation of the model realized, combustion characteristics, performance, and emission results of the present study, which was conducted at Yıldız Technical University, Internal Combustion Engines Laboratory, are discussed in the below part.
Validation
Engine model is built on AVL Boost validated using the pressure and emission data gathered during experimental engine test. From the tests, the maximum pressure was achieved at 35.748 bars at 365.8°CA and in the model results the maximum pressure was achieved at 35.989 bars at 366.00°CA. The error in the maximum pressure values was calculated as 0.674%. As shown in Figure 3, the experimental and model pressure data overlap on a large scale.

Comparison of experimental and simulation results of in-cylinder pressure.
As seen in Figure 3, high relative difference between theoretical and experimental in-cylinder pressure variations observed during intake stroke and beginning of compression stroke. It is assumed not to be caused by numerical model but experimental data, since expected pressure values are obtained from numerical model during intake process of the engine. In-cylinder pressure data collected during this period of time were low values; however, the pressure sensor was designed in order to be accurate at high in-cylinder pressure values. Moreover, sensitivity to pressure fluctuations caused by vertical positioning of the pressure sensor due to constructive restrictions, such as cooling ribs, led measured values to occur higher than real experimental values during intake stroke and beginning of compression stroke. It is predicted that combustion process, performance, and emission characteristics were not affected from abovementioned error, since the differences occurred at intake stroke and beginning of compression stroke.
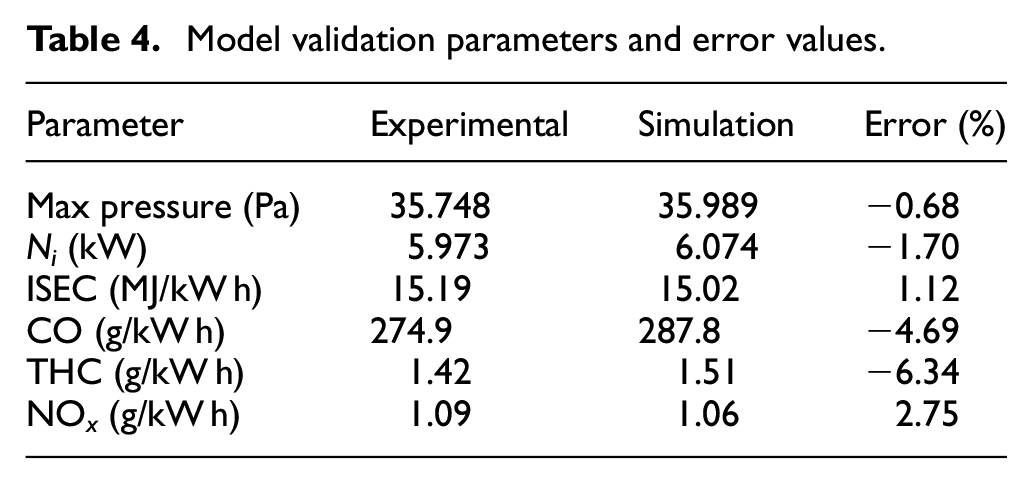
Indicated engine power (Ni), ISEC, and specific emissions (CO, THC, and NO x ) values which were calculated via tests and gathered from simulation results, and error percentages are shown in Table 4. The maximum error percentage between the test and simulation results is 6.34% for THC emissions and compared values considered sufficient to verify the built model.
Model validation parameters and error values.
Combustion
Pressure values of gasoline, E2.5, E5, E10, E15, and E20 fuel conditions that were gathered from simulations shown in Figure 4. Maximum pressure values gathered are 35.989 bar (at 366.00°CA), 36.105 bar (at 365.90°CA), 36.548 bar (at 365.85°CA), 36.585 bar (at 365.65°CA), 36.997 bar (at 365.50°CA), and 37.160 bar (at 365.15°CA), respectively.

Variation of in-cylinder pressure with different ethanol fractions.
HRR results of different fuel conditions are shown in Figure 5. In the data gathered from simulations, maximum HRRs for gasoline are E2.5, E5, E10, E15, and E20 are 0.036729 1/°CA (at 360.8°CA), 0.037392 1/°CA (at 360.7°CA), 0.038473 1/°CA (at 360.6°CA), 0.038532 1/°CA (at 360.4°CA), 0.039314 1/°CA (at 360.2°CA), and 0.039440 1/°CA (at 360.1°CA), respectively.
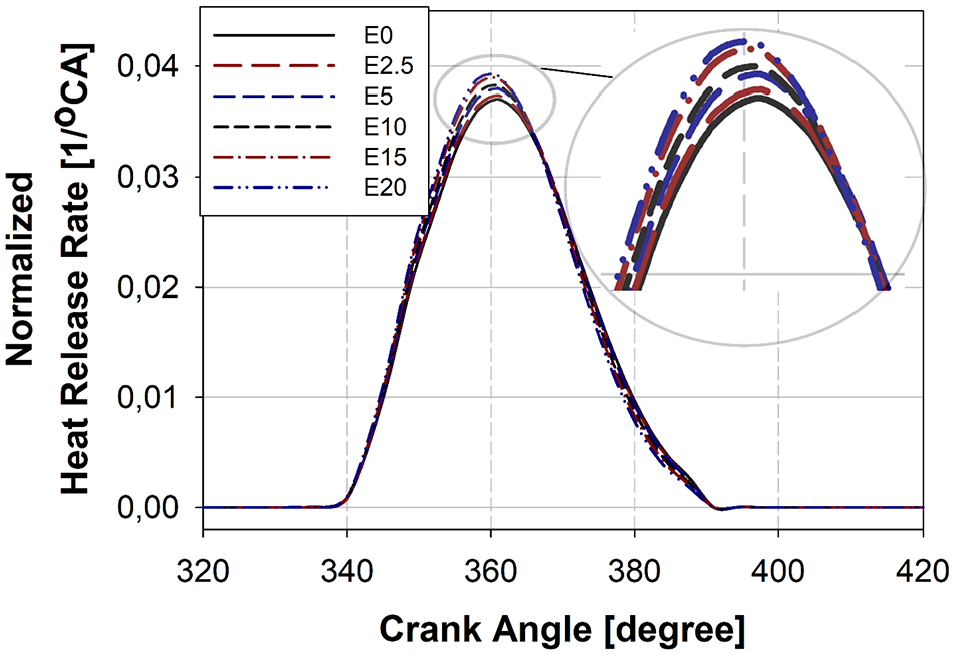
Variation of heat release rate values with different ethanol fractions.
When high flammability range and relatively high adiabatic flame speed of ethanol is considered, the reason of maximum pressure and HRR values are higher and more closed to TDC can be explained by combustion to be completed in a shorter period of time. This effect leads combustion to be completed faster and cycle to show closer characteristics to ideal constant volume combustion and maximum pressure values to increase and efficiency to improve. 10 In-cylinder pressure–volume diagram of the engine is given in Figure 6 and increase in closed area of the diagram and hence, increase in mechanical work done per cycle can be seen as a result of abovementioned effects of ethanol. Similar trends in HRR with increasing ethanol content were reported in research paper by Schifter et al. 8 This HRR variation characteristic also explains increasing maximum in-cylinder pressure which occurs at earlier crank angle.

Indicator diagram with different ethanol fractions.
Performance
Indicated power (Ni) values were improved from 6.07 to 6.13 kW, with slight increasing trend, as seen in Figure 7, with the increase in the proportion of ethanol in the fuel. For gasoline, E2.5, E5, E10, E15, and E20 fuels indicated power values are 6.074, 6.09, 6.10, 6.12, 6.126, and 6.13 kW, respectively. Although, ethanol has less lower heating value, power improvement with higher ethanol content can be explained by lower stoichiometric AFR and higher vapor density of ethanol. Lower stoichiometric ratio of ethanol allows to burn more fuel mass with the same amount of air. Moreover, lower vapor pressure and higher heat of evaporation of ethanol increases volumetric efficiency with increasing ethanol content. 11 Hence, for the same cylinder volume, more amount of fuel mass can be taken and burned efficiently thanks to higher flame speed of ethanol.

Variation of indicated engine power versus ethanol content.
Similar to indicated engine power tendency, indicated torque (Mi) values also increased with the increase in the proportion of ethanol in the fuel. Indicated engine torque values were increased from 24.17 to 24.39 N m, with slightly increasing trend for gasoline to E20 fuels, respectively. Figure 8 shows indicated torque results of gasoline, E2.5, E5, E10, E15, and E20 fuel operations.

Variation of indicated engine torque versus ethanol content.
Effects of ethanol fraction on IMEP values at stoichiometric conditions are seen in Figure 9. Analyses results showed that IMEP values were increased using higher ethanol content in fuel at stoichiometric condition. Trends of IMEP variations by different ethanol fractions showed similarity with those of engine torque and power values since IMEP is one of the main parameters of indicated engine torque and power. Simulation results of IMEP for gasoline E2.5, E5, E10, E15, and E20 fuels are 1.125, 1.128, 1.130, 1.133, 1.134, and 1.135 MPa, respectively. Maximum improvement in IMEP was 0.91% with E20 fuel compared to neat gasoline (E0).

Variation of indicated mean effective pressure versus ethanol content.
As stated before, lower stoichiometric ratio of ethanol allows to burn more fuel mass with the same amount of air, while lower vapor pressure of ethanol increases volumetric efficiency with increasing ethanol content. Hence, for the same cylinder volume, more amount of fuel mass can be taken and burned efficiently thanks to higher flame speed of ethanol, which contributes to power and torque increase. 14 Slight increasing trends, which are seen in indicated engine power, torque, and mean effective pressure in parallel with each other, are coherent with torque results found in research by Wu et al. 17 at constant engine speed, throttle position, and AFR conditions.
ITE values with different ethanol contents are given in Figure 10. Indicated thermal efficiency values were 23.97%, 24.06%, 24.14%, 24.26%, 24.32%, and 24.39% in tendency to improve with increasing ethanol fraction of E0, E2.5, E5, E10, E15, and E20 fuels, respectively. Maximum increase in IMEP was 1.76% between E0 and E20 fuel operations.

Variation of indicated thermal efficiency versus ethanol content.
As mentioned above, increase in ethanol causes combustion to be completed in a shorter time and cycle to show closer characteristics to ideal constant volume combustion and efficiency to increase. Since simulations run at constant engine speed, stoichiometric operation condition, efficiency increase also contribute to slight increase in indicated engine power, torque, and IMEP. It can also be seen that ethanol provides higher thermal efficiency compared to gasoline as in the results of Balki et al. 10
Since the energy content of different fuel blends was used in the study, the ISEC was examined to better express the consumption and efficiency values of the engine rather than indicated specific fuel consumption (ISFC). ISFC has increasing trend in g/kW h with increasing ethanol content as opposed to ISEC due to low heating value of unit mass of ethanol. As a result of the simulations, it is observed that ISEC was 15.02 under neat gasoline condition while it decreased by 1.7% and was 14.76 MJ/kW h under E20 fuel condition with increased ethanol fraction. Using E2.5, E5, E10, E15, and E20 fuels, the EER values are equal to 1.7%, 3.4%, 6.9%, 10.6%, and 14.4%, respectively. Figure 11 shows the decrease in energy consumption with increasing ethanol content in the fuel.

Variation of indicated specific energy consumption versus ethanol content.
This decrease in ISEC is similar to the above explanation, and it can be explained by increased efficiency at high flammability range and flame speed. 5 ISEC results found in this study are coherent with gasoline–ethanol comparison by Li et al. 13
Emissions
In addition to improving the combustion characteristics and performance of the engine, it is important that the emission values also improve or remain acceptable. The effects of specific ethanol contents on the specific CO emissions of fuels are shown in Figure 12. As a conclusion of simulations, a decrease in CO emissions, which are pretty harmful to the human health, is observed when ethanol is added to neat gasoline. Emitted CO values were 287.8 g/kW h for neat gasoline while for E20 it is decreased to 266.7 g/kW h.

Variation of specific CO emission versus ethanol content.
CO emission strongly depends on AFR. 3 However, AFR does not have effect on CO emission results since experimental and theoretical results are obtained under stoichiometric conditions, independent of ethanol proportion in fuel. The decreasing trend in CO can be explained by the ratio of ethanol with low C content compared to gasoline; thus, decrease in ratio of C in total fuel and high flammability limits of ethanol as an oxygenated fuel facilitates reduction of CO. 39 It also causes a decrease in CO emission with increasing cylinder pressure and temperature values due to faster combustion.
Figure 13 shows the specific THC emissions of different ethanol content fuels. Gathered THC values for gasoline, E2.5, E5, E10, E15, and E20 fuels are 1.51, 1.49, 1.48, 1.44, 1.43, and 1.41 g/kW h, respectively. The maximum improvement in THC emissions was in E20 fuel, and this improvement is 6.62% compared to gasoline.

Variation of specific THC emission versus ethanol content.
Similarly as for CO, the reason of increasing ethanol ratio caused THC emission to decrease because of high flammability limits of ethanol and due to the relatively high in-cylinder pressure and temperature caused by the high flame velocity. Moreover, oxygen enhancement thanks to ethanol addition provides more complete combustion and hence reduces THC emissions. 17 THC and CO emission characteristics provided from simulations are similar to study of Iodice et al. 28
The resulting oxides of nitrogen are formed from nitrogen and oxygen in the atmosphere, and in general, the most important parameter affecting the amount and the formation is the temperature. For ethanol-gasoline blends thermal NO x formation is also dominant mechanism. 3 Lower heating value and high heat of vaporization of ethanol decrease temperature which results in a temperature fall in cylinder. Low adiabatic flame temperature reduces NO x formation. In this study realized at stoichiometry, more fuel is consumed because of increasing volumetric efficiency due to stoichiometric rate decrease parallel with increasing ethanol rate, high vapor density, and evaporation heat. Moreover, thermal efficiency obtained with high flame speed increases peak pressure and temperature. Besides, oxygenates of fuel shows increasing effect on NO x , while decreases CO and HC emissions.22,23 It is estimated that combustion completed in less time by virtue of high flame speed allows less reversible reactions, thus resulting in more NO x releases, since forward and reverse NO x reactions have different rate coefficients depending on temperature and NO x formations freeze early in the expansion stroke. 24 As a result of these effects, as expected in the simulation results, NO x values are inversely proportional to THC and CO emissions, increasing with the ratio of ethanol in the fuel.
Values gathered from simulations are shown in Figure 14. NO x values observed as 1.06 g/kW h as working with neat gasoline while increasing ethanol amount caused emitted NO x amount to increase to 1.21 g/kW h. The maximum increase in NO x emissions on E20 fuels is 14.29% in comparison to neat gasoline.

Variation of specific NO x emissions versus ethanol content.
In the literature, there are different opinions and obtained results about ethanol ratio increase in gasoline on the effect of NO x . 3 According to some researchers, NO x emission depends on operating conditions of engine rather than ethanol rate. 6 However, in cases where engine and ignition advance are not modified, it is reported by Dai et al. 19 and Li et al. 13 who compared ethanol and gasoline and by Costa et al. 12 who compared ethanol and ethanol-gasoline mixture in their studies that ethanol causes lower THC and CO, higher NO x emission. In study of Stump et al. 20 who performed tests on different vehicles at cruise cycles, it is found that HC and CO emissions decrease with ethanol addition while NO x emissions mostly increase. NO x , THC, and CO emission results in study are parallel with results of Schifter et al. 8
Table 5 summarizes the effects of ethanol content of fuel on performance and emission characteristics, which are obtained from simulation results. It can be seen that, IMEP, ITE, ISEC, CO, and THC results were improved while NO x emissions were deteriorated by increasing ethanol fractions in fuel.
Percentage changes by the effect of ethanol fractions of fuel.

IMEP: indicated mean effective pressure; ITE: indicated thermal efficiency; ISEC: indicated specific energy consumption.
Conclusion
In the study conducted, developed 1D engine model was verified at 2400-r/min constant engine speed, full load, and under stoichiometric conditions, with the help of engine performance, in-cylinder pressure, and emission data obtained by experiments with neat gasoline fuel. Obtained data such as engine performance, emission, and combustion at stoichiometry for different fuels (gasoline, E2.5, E5, E10, E15, and E20) were compared to each other using a one-dimension mathematical engine model.
The results obtained are summarized below:
The results gathered from neat gasoline at 2400-r/min constant engine speed were compatible with developed 1D model, in-cylinder pressure data overlapped on a large scale. Error in the maximum pressure was just 0.674%.
As a result of the analyses, under stoichiometric conditions, with increasing ethanol content, there is a slight increase in indicated engine power and a decrease in ISEC values. Increasing ethanol amounts and maximum in-cylinder pressure and maximum normalized HRR data were closer to the TDC, and pressure data were increased.
Increasing ethanol ratio caused CO and specific THC emissions to improve significantly. Maximum improvement on specific CO emission was 7.33%, and maximum improvement on THC emissions was 6.62%.
It has been found that increasing ethanol ratio lead NO x emissions to increase by 14.29%. Reason of this increase is high flame speed of and O2 content of ethanol fuel.
Since ethanol addition causes reduction in THC and CO emissions and increase in NO x emissions, it will be useful to examine the post-combustion emission reduction methods and performance optimization of these methods for ethanol and gasoline blends operating conditions as a future work of this study.
Footnotes
Handling Editor: James Baldwin
Declaration of conflicting interests
The author(s) declared no potential conflicts of interest with respect to the research, authorship, and/or publication of this article.
Funding
The author(s) disclosed receipt of the following financial support for the research, authorship, and/or publication of this article: This research was supported by TUBITAK (Scientific and Technological Research Council of Turkey) with 1512 project (project number: 2150175). The authors are also indebted to Şahin Metal A.Ş. and Erin Motor for providing us with test apparatus and equipment donation. The third author of the manuscript has been financially supported by TUBITAK 2228-B program.