
Abstract
Motor function assessment of patients and the elderly is crucial to gait assessment and gait rehabilitation. Accuracy of the assessment is affected by clinician’s experience. To solve the problem, this article proposes motor function assessment index to assess the motor function of patients. VICON system collects video of subjects when they are walking. And the original gait videos are pre-processed by the pixel-based adaptive segmenter and extracted by the convolutional neural network. The kernel entropy component analysis and local tangent space alignment reduced the dimensions of extracted features, and motor function assessment index is obtained. The Pearson correlation analysis shows that the motor function assessment index and modified gait abnormality rating scale are significantly correlated, and Pearson correlation coefficient is 0.92. These effectiveness results demonstrate that the proposed method has the considerable potential to promote the future design of automatic motor function assessment for clinical rehabilitation research.
Keywords
Introduction
The decline of lower limb motor function greatly reduces the elderly and the patients’ quality of life. Traditionally, the estimation of motor function is mostly based on the international classification of functioning, disability and health (ICF) and lower extremity motor score (LEMS).1,2 However, these assessments are subjective and time-consuming, and their accuracy depends on the clinicians’ experience. Therefore, it is necessary to develop a convenient and objective quantitative assessment of motor function.
In the past few years, advanced measuring techniques have made it easier to collect the kinematic, kinetic, and gait video data during walking.3,4 It greatly facilitates the development of motor function assessment. Rozumalski and Schwartz 5 and Schwartz and Rozumalski 6 used three-dimensional gait information to evaluate lower limb motor function of cerebral palsy patients and established quantitative evaluation indexes. Gouelle et al. 7 collected eight gait spatiotemporal parameters from patients with Friedrich’s ataxia and developed gait variability index (GVI) to assess motor function. Ma and Liao 8 collected ground reaction forces and presented abnormal evaluation index (AEI) which used a semi-Markov process. Rahmati et al. 9 used lower limb surface electromyographic (sEMG) signals of cerebral palsy patients to establish synergy comprehensive assessment (SCA) for quantitative evaluation motor dysfunction. Modified gait abnormality rating scale (GARS-M) is a semi-subjective assessment method based on video, which evaluates seven gait characteristics during human walking, including general performance; lower limb movements; and the trunk, head, and upper limb movements. 10 However, these assessment were usually calculated based on one kind of data source (e.g. kinematic data), which could only summarize a subject’s gait characteristics from a single aspect. And it might lead to a one-sided assessment result. Some researchers built assessment models based on multisource data. Soran et al. 11 collected natural behavior videos of children with spinal muscular atrophy (SMA) and used regression convolutional neural network (RCNN) to analyze their behavioral videos. D’Souza et al. 12 established a quantitative multiple sclerosis assessment system using deep video motion data, and the effectiveness of the system is verified by clinical trials.
In recent years, CNN has achieved great results in medical image diagnosis, video target detection, and behavior recognition areas.13–15 Deep convolution layers extracted more abstract features and got more effective recognition.16–19 Many previous studies showed that CNN had good feature extraction capabilities and revealed hidden and complicated features in the spatial domain.20,21
To avoid subjective effects, TensorFlow convolutional neural network (TF-CNN) is used to extract features from gait video. Kernel entropy component analysis (KECA)–local tangent space alignment (LTSA) reduces redundant features and got motor function assessment index (MFAI). Compared with traditional CNN, TF-CNN reduces the training time of CNN and improves the accuracy. KECA–LTSA is more efficient than linear discriminate analysis (LDA) and principal component analysis (PCA) in nonlinear data extraction.
The article is structured as follows. Section “Materials and methods” introduces the process of data collection and describes the new assessment based on improved CNN and KECA–LTSA. Section “Experimental results” shows the experiment results of proposed algorithm. Conclusion and future work are reported in section “Conclusion and future work.”
Materials and methods
Overview of the proposed method
As shown in Figure 1, this assessment system consists of data collection, data feature extraction, and motor function assessment. In the first stage, VICON system collects video data. Then, pixel-based adaptive segmenter (PBAS) extracts the silhouette images from video and TF-CNN extracts feature from images. KECA–LTSA reduced redundant features and MFAI is proposed.

Overview of the research scheme.
Classification of subjects
All subjects of this article are divided into three groups by clinician, including middle-age stroke group (MG, 25 subjects), elderly stroke group (EG, 25 subjects), and young healthy group (YG, 40 subjects). GARS-M is used to assess the motor function of all subjects preliminary by clinicians. The GARS-M scores range from 0 to 21. Table 1 lists the conditions of the three group subjects, including age, gender, physical condition, and the GARS-M score. The MG group consists of subjects with motor dysfunction aged between 40 and 59 years with a GARS-M score of 3–9. The EG group consists of subjects with motor dysfunction aged between 60 and 70 years with a GARS-M score of 8–14. Both the EG and MG groups are the test group in this study. YG group is considered as reference group. The YG group consists of subjects with motor dysfunction aged between 20 and 39 years. Because there is no GARS-M score in young healthy group, the GARS-M score in YG group is 0. All the subjects could complete the data collection without any help or assistance.
Demographic data of the subjects.

GARS-M: modified gait abnormality rating scale; BMI: body mass index; YG: young healthy group; MG: middle-age stroke group; EG: elderly stroke group.
Motor data collection
VICON Motion Capture System (by Oxford Metrics Limited, UK) is used to collected gait video. It consists of six cameras, signal capture equipment, and data generation software. Full image measurement frequency of cameras is 1000 Hz. In this study, the measurement frequency is conducted at 200 Hz. As shown in Figure 2, VICON captures the video of subjects when they are walking, while the silhouette images of video are shown in Figure 3.
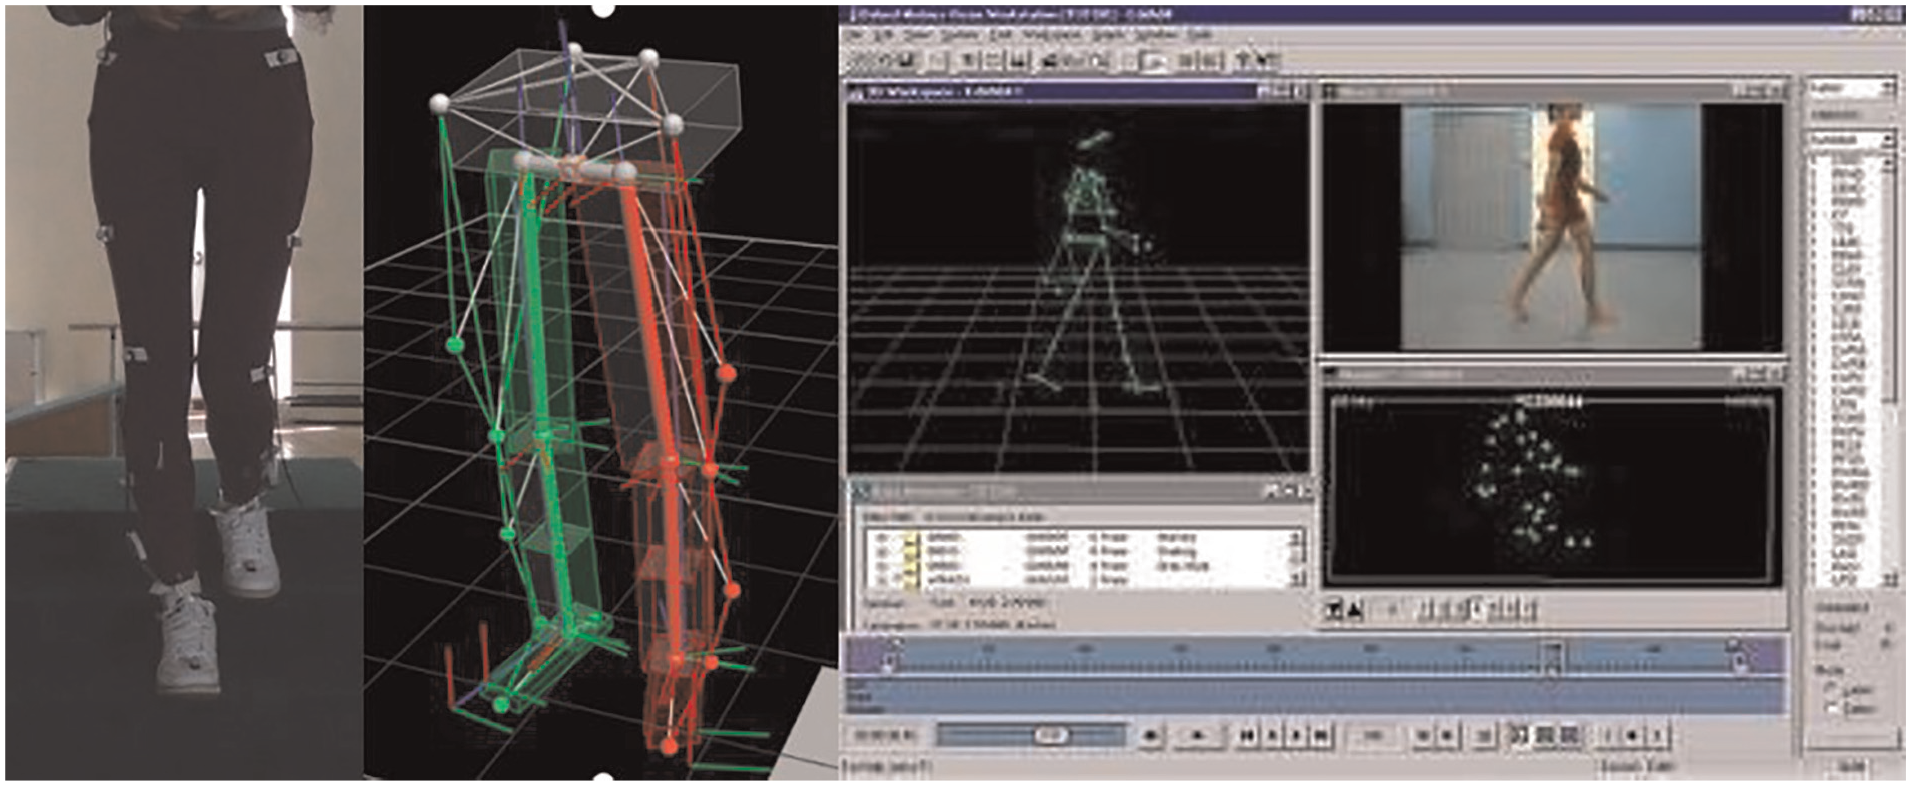
VICON nexus calibrate interface.

Silhouette image extracted by PBAS.
Data feature extraction
As shown in Figure 4, feature extraction could be summarized as three steps
Subjects’ images are divided into train set and test set, whose ratio is 8–2.
CNN model parameters are pre-trained on the ImageNet and used as the initialization parameters of the network. The trained CNN model extracts features from gait silhouettes images.
The gait features are fused serially to obtain feature-vector.

CNN feature extraction.
Structure of CNN
The trained CNN is used as a feature extractor to establish the motor function assessment model. VGG-16 has a simple structure but performed a high accuracy on ImageNet. And transfer learning and fine-tuning show strong generalization ability on VGG-16 from big data set to small data set. As shown in Figure 5, CNN structure is modified from VGG-16. This network has seven sequentially connected layers, including input layer (input image size is 120 × 150 pixel), five convolution blocks, two full connection layers, and a output layer. Each convolution block consists of two or three convolution layers and one max-pooling layer. The output of Block5 is flattened into full connection layer vector. FC1 connection layer is a 256-dimensional vector and FC2 connection layer is used to gait recognition by softmax function.

The structure of the CNN for gait sequence feature extraction.
Table 2 shows the structure of CNN. C represents convolution layer, R represents nonlinear activation function (RELU), P represents maximum pooling layer, F represents full connection layer, D represents Dropout (probability is 0.5), and S represents activation function. And the number of trainable parameters at each layer is given in Table 2.
Parameters of each layer of convolutional neural network.

Transfer learning and fine-tuning
Transfer learning is different from the traditional CNN training method. It could improve the performance of learning by transferring knowledge from several source domains to a target domain. 22
In this study, CNN structure is trained by ImageNet data set, which includes one million pictures, to get parameters. Then, the pre-trained parameters are used as the initial parameters of Block1–Block5 layers, and the parameters of FC6 and FC7 are randomly initialized. During the training, the gait image data set is used to fine-tune and train the parameters of FC6 and FC7. Although there is a big difference between the images of ImageNet database and the gait video image of this study, pre-training weight is better than the random weight because the initialization of random weight has a high chance to fit the training data.
Motor function assessment
Feature normalization
The Gaussian feature normalization is used to process the features, so that the indicators of different magnitudes can be uniformly reduced to remove the correlation, and the local influence of different types of features is guaranteed. Combining the extracted features into a fusion matrix

Kernel entropy component analysis
KECA puts data from low-dimensional space to high-dimensional space and selects features by the entropy contribution (EC). It can be described as

where

where D is the eigenvalue matrix of features,

where
LTSA
LTSA uses the tangent space of the neighborhood of the sample set to represent the local geometric features and uses those features to reduce the dimensions of data. A sample set

where

where

where

Therefore, the final kernel matrix is

where
MFAI
The YG group’s average features in the subspace are defined as standard healthy gait. Every subject’s features are compared with standard features, the gait performance of the subject is obtained, and the lower limb MFAI can be evaluated.
The average of YG is
The deviation between other subjects and standard features is

The MFAI of all subjects is obtained as follows

The gait deviation index of any of the subjects in the reference group YG is

The MEAN(Z) and S.D.(Z) represent the average of Z group and standard deviation of Z group. Zscore definition is

The MFAI of all the subjects in the experiment is obtained as
And a percentage system evaluation index is

Experimental results
CNN analysis
The training results of CNN using transfer learning are shown in Figure 6. In the figure, acc and loss represent the training set accuracy rate and the loss value, and val_acc and val_loss represent the accuracy and loss values of the test set. The results of TF-CNN are shown in Figure 7. It shows that transfer learning and fine-tuning training CNN converge faster than transfer learning CNN.

Transfer learning training results.

Transfer learning and fine-tuning training results.
As shown in Table 3, TF-CNN is better than CNN. And after fine-tuned, TF-CNN’s accuracy is improved. Therefore, this article uses transfer learning and fine-tuning to train convolutional networks in the network training process.
Comparison of different training methods.

TF-CNN: TensorFlow convolutional neural network.
Feature extraction analysis
The multi-feature fusion method used in this article avoided the randomness of single feature parameters, but the feature parameters increases exponentially. To solve this problem, the redundant information of the fusion matrix is removed by KECA–LTSA. Radial basis function (RBF) kernel function is used as the kernel function of KECA and the kernel width parameter
It can be seen that when the EC is 97%, the principal subspace is 30 dimensions. And when the variance contribution (VC) is 97%, it is 45 dimensions. So KECA–LTSA can cover the original data information with fewer feature dimensions. Table 4 shows the eigenvalues and cumulative EC ratios of the first 10 principal components of KECA–LTSA, the corresponding eigenvalues of the first 10 kernel principal components of KPCA, and their cumulative VC ratios. It shows that the features extracted by KECA–LTSA are more interpretable than KPCA.
Comparison of parameters in two methods.
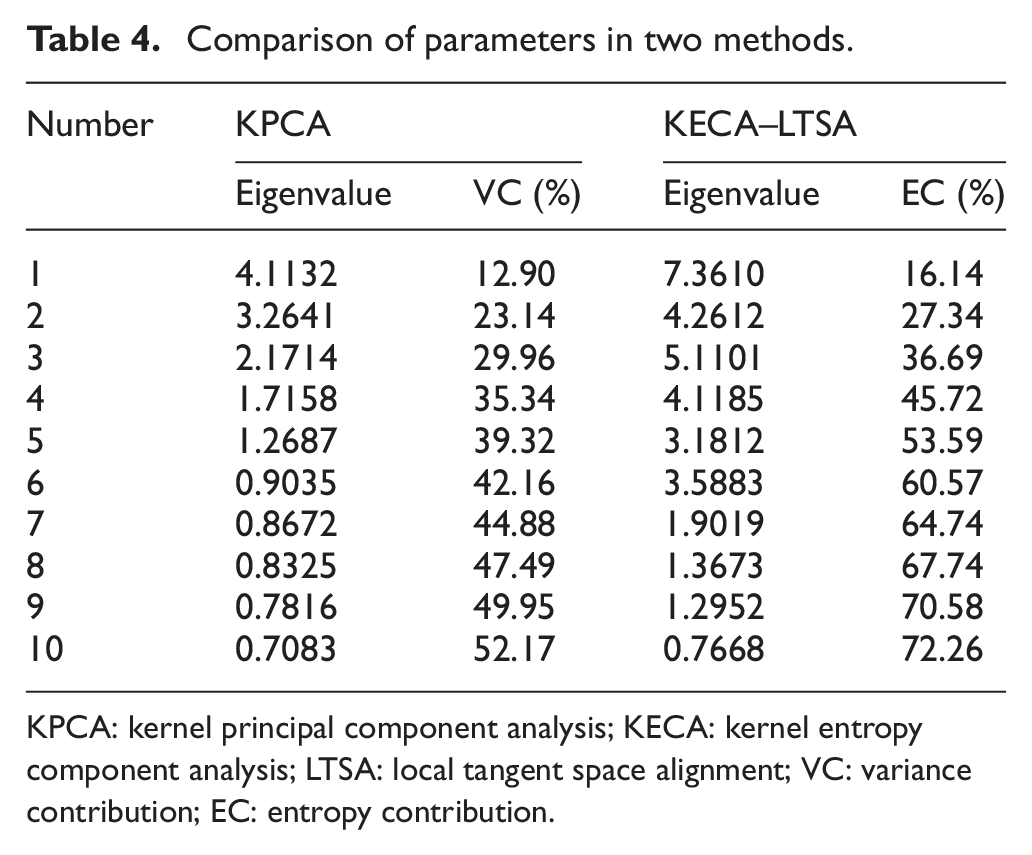
KPCA: kernel principal component analysis; KECA: kernel entropy component analysis; LTSA: local tangent space alignment; VC: variance contribution; EC: entropy contribution.
MFAI indicators and statistical analysis
Using the first 30 elements extracted by KECA–LTSA as the final feature vector, the subspace of the feature extraction is constructed, and the lower limb dyskinesia evaluation index (MFAI) is obtained.
The MFAI scores of each group extracted by KPCA are shown in Figure 8. YG scores range from 95 to 123. MG scores range from 95 to 83. EG scores range from 94 to 87. It can be seen that YG group can be distinguished from MG and EG groups, but it is difficult to classify MG and EG groups.

MFAI scores extracted by KPCA.
The MFAI scores extracted by KECA are shown in Figure 9. YG scores range from 90 to 116. MG scores range from 50 to 90. EG scores range from 43 to 66. KECA performance is better than KPCA. MG and EG groups’ distance is increased.

MFAI scores extracted by KECA.
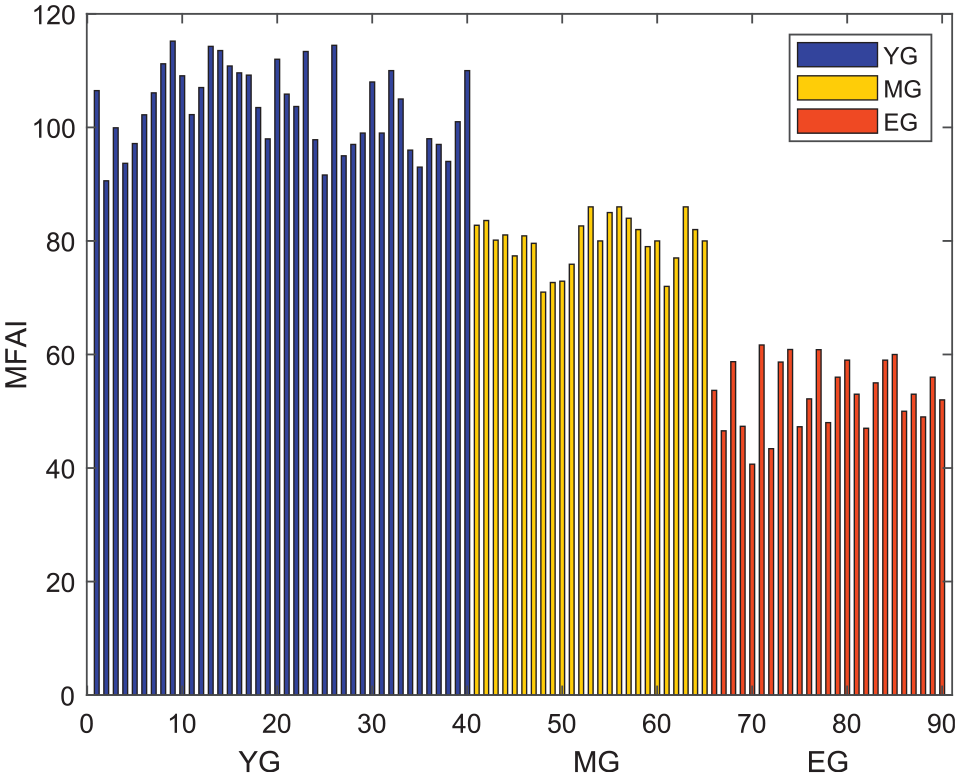
The MFAI scores extracted by KECA–LTSA are shown in Figure 10. YG group’s MFAI scores range from 91 to 112. MG group’s MFAI scores range from 86 to 72. EG group’s MFAI scores range from 61 to 40. This method has the best classification, and there is large distance between different groups and small distance within group.
MFAI scores extracted by KECA–LTSA.
Correlation analysis between MFAI index and GARS-M
GARS-M score of subjects with dysfunction (i.e. MG and EG groups), which evaluated by physicians, and proposed MFAI are analyzed with Pearson correlation coefficient. Figure 11 shows the linear regression analysis of the MFAI scores extracted by KECA–LTSA and GARS-M. The Pearson correlation coefficient is r = 0.92. It can verify that the effectiveness of the MFAI.

Linear regression analysis of MFAI and GARS-M.
Conclusion and future work
This article proposes a novel lower limb motor function assessment. First, VICON system collects subjects’ gait video data. CNN is pre-trained by ImageNet and extracts features from gait images. Compared with normal training method, transfer learning and fine-tuning could make CNN converge faster and have higher accuracy. Then, feature data are fused into feature matrix. KECA–LTSA is used to decrease the dimensions of the feature matrix. Compared with the KPCA and KECA, KECA–LTSA decreases more dimensions and retains effective information of original data, and the MFAI results shows that classification of KECA–LTSA is better than KPCA and KECA. And the correlation coefficient between MFAI and GARS-M scores is 0.92, which proves the effectiveness of the method.
In this article, we only studies how to evaluate dysfunction of lower limb, which we think affects human’s motion function directly. However, some diseases and dysfunction of other parts of body could affect lower limb’s function, such as diabetes and obesity. In the future work, this research can be extended to evaluate more people who have complicated healthy conditions to further improve the model.
Footnotes
Handling Editor: James Baldwin
Author contributions
Y.Z. was involved in conceptualization, methodology, and writing—review and editing. S.L. was involved in data curation, investigation, and writing—original draft. Y.Z. was involved in writing—review and editing. J.L. was involved in data curation and writing—review and editing.
Declaration of conflicting interests
The author(s) declared no potential conflicts of interest with respect to the research, authorship, and/or publication of this article.
Funding
The author(s) disclosed receipt of the following financial support for the research, authorship, and/or publication of this article: This work was supported by National Science Foundation of China (Grant Nos. 61773151 and 61703135) and Natural Science Foundation of Hebei Province (Grant No. F2018202279).