
Abstract
Head sheaves are critical components in a mine hoisting system. It is inconvenient for workers to climb up to the high platform for overhaul and maintenance, and there is an urgent need for condition monitoring and fault diagnosis of head sheaves. In this article, Fault Tree Analysis is employed to investigate the faults of head sheaves, and headframe inclination, bearing faults, and head sheave swing are the three focal faults discussed. A test rig is built to simulate these three faults and collect vibration signals at bearing blocks. Based on vibration signals, some characteristic parameters are calculated, and together with the fault labels, a sample set is established. Before the selection of an excellent data mining method, these features are screened according to their significance, and then, gain–percentile chart, response–percentile chart, and prediction accuracy are used as the criteria to make a comparison between data mining algorithms. The result shows the boosted tree algorithm outperforms others and presents excellent performance on the evaluation of head sheave faults. Finally, this method is verified on a data set of 20 samples, and each case is identified correctly, which illustrates its high applicability.
Introduction
A mine hoisting system is the equipment that conveys coal or other mineral resources from underground to the surface. No matter it is a winding hoist or a floor friction hoist, the head sheaves are always a critical component in the whole system. 1 It is used to support and guide the hositing wire ropes, as shown in Figure 1.

Schematic diagram of a hoisting system. 1: Head sheave; 2: Hoisting wire rope; 3: Conveyance; 4: Balance rope; 5: Driving part.
The malfunction of head sheaves might result in the failure of hoisting operation and even cause fateful accidents. 2 The possible faults include sheave swing, headframe inclination, bearing faults, and so on. A head sheave platform is around dozens of meters high, as shown in Figure 2; so it is inconvenient for workers to examine and repair head sheaves, especially in extreme weather. Hence, it is of great significance to carry out research on online condition monitoring and fault diagnosis system of head sheaves for a hoisting system. 3 In addition to climbing to the high platform to check head sheaves, some field engineers monitor real-time temperature of the bearings to get fault information, which is effective to predict the possible fault status according to excessive high temperature; however, the identification of where the fault originates from is beyond the capability of temperature monitoring. Vibration monitoring can compensate for this deficiency, and scholars have done plenty of research in this area. For instance, Liu Y et al. 4 carried out cepstrum analysis on vibration signal in fault diagnosis of bearings. During fault identification, data mining method begins to take an important role. Liu X et al. 5 used extreme learning machine method in gear fault diagnosis. Gao Y et al. 6 employed generative adversarial networks to detect bearing fault. Hence, for head sheaves, it is of great feasibility and significance to build an online fault diagnosis system.
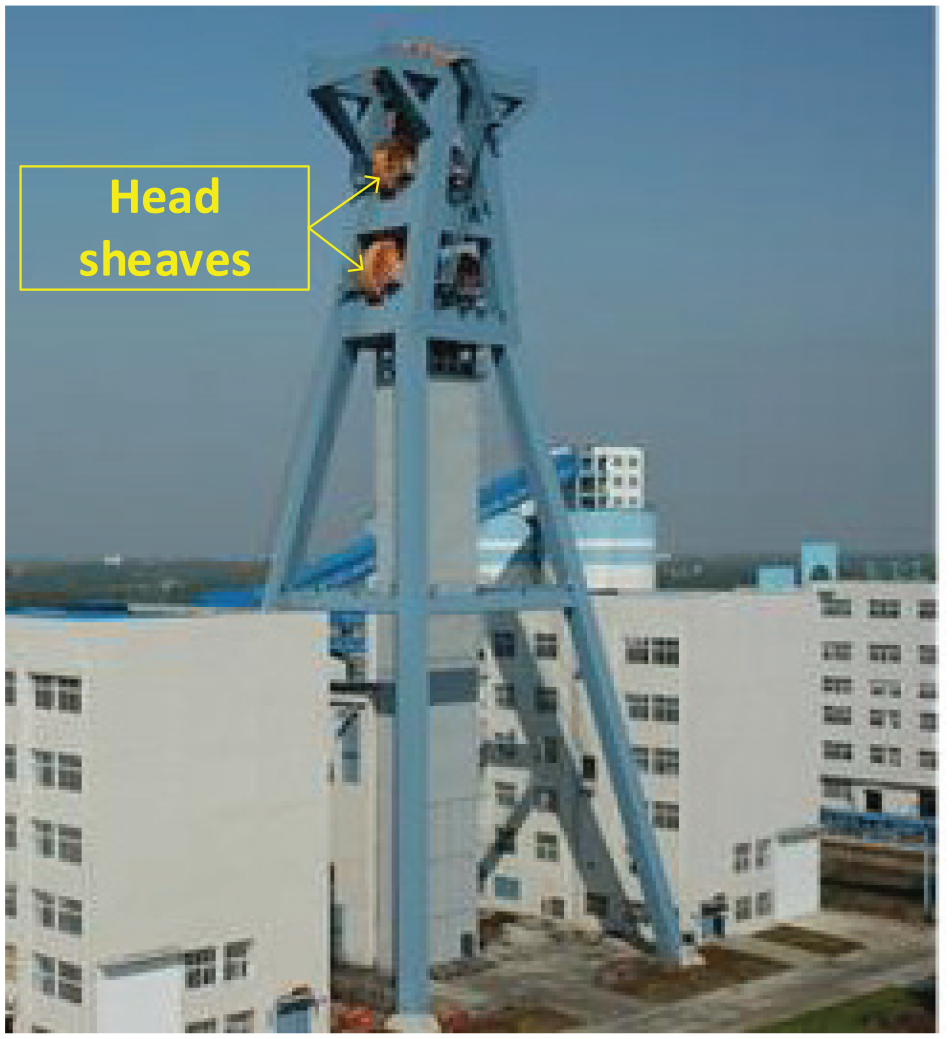
A photo of an actual hoisting system.
However, in current research and field practice, faults of head sheaves have not been concluded and analyzed comparatively. What faults should be paid more attention to? What features should be selected? What algorithm outperforms others in the identification of head sheave faults? These are the key problems that this article focuses on. Fault Tree Analysis (FTA) is employed creatively to look into the head sheave faults systematically, and then, a data mining method is used to screen features based on their different contribution to fault identification. Finally, algorithms are compared to decide the most suitable one to give an ideal prediction.
FTA of head sheaves
Failure mechanism must be analyzed before health status is evaluated. FTA is an effective way to investigate and improve reliability and safety.
7
The FTA for head sheaves is shown in Figure 3. Head sheave failure, whatever the cause is, is regarded as the top event

Fault Tree Analysis of head sheave.
Algebraic method is used to compute this fault tree, 8 whose process is

According to this result, the minimum cut set has been obtained, which is
Construction of the test rig
With the increasing depth of mining, multi-rope winding hoist will be more and more widely applied in the near future, so a test rig of multi-rope winding hoisting system is built, as shown in Figure 4. It includes conveyances, wire ropes, head sheaves, torque sensor, drum, brake disk, gearbox, rotary encoder, bearing block, driving motor, and so on. The driving motor drives the winding drums through the gearbox. Conveyances are lifted and lowered by wire ropes, which pass through the head sheaves and wind around the drums. This test rig can simulate the three faults of the head sheaves. Some bolts of this rig can be adjusted to artificially make the faults of headframe inclination and head sheave swing. Bearing faults investigated in this article basically have the form of impact, so external impact force is applied on the bearing block to simulate the effect of bearing faults. Main technical parameters of this test rig are listed in Table 1.
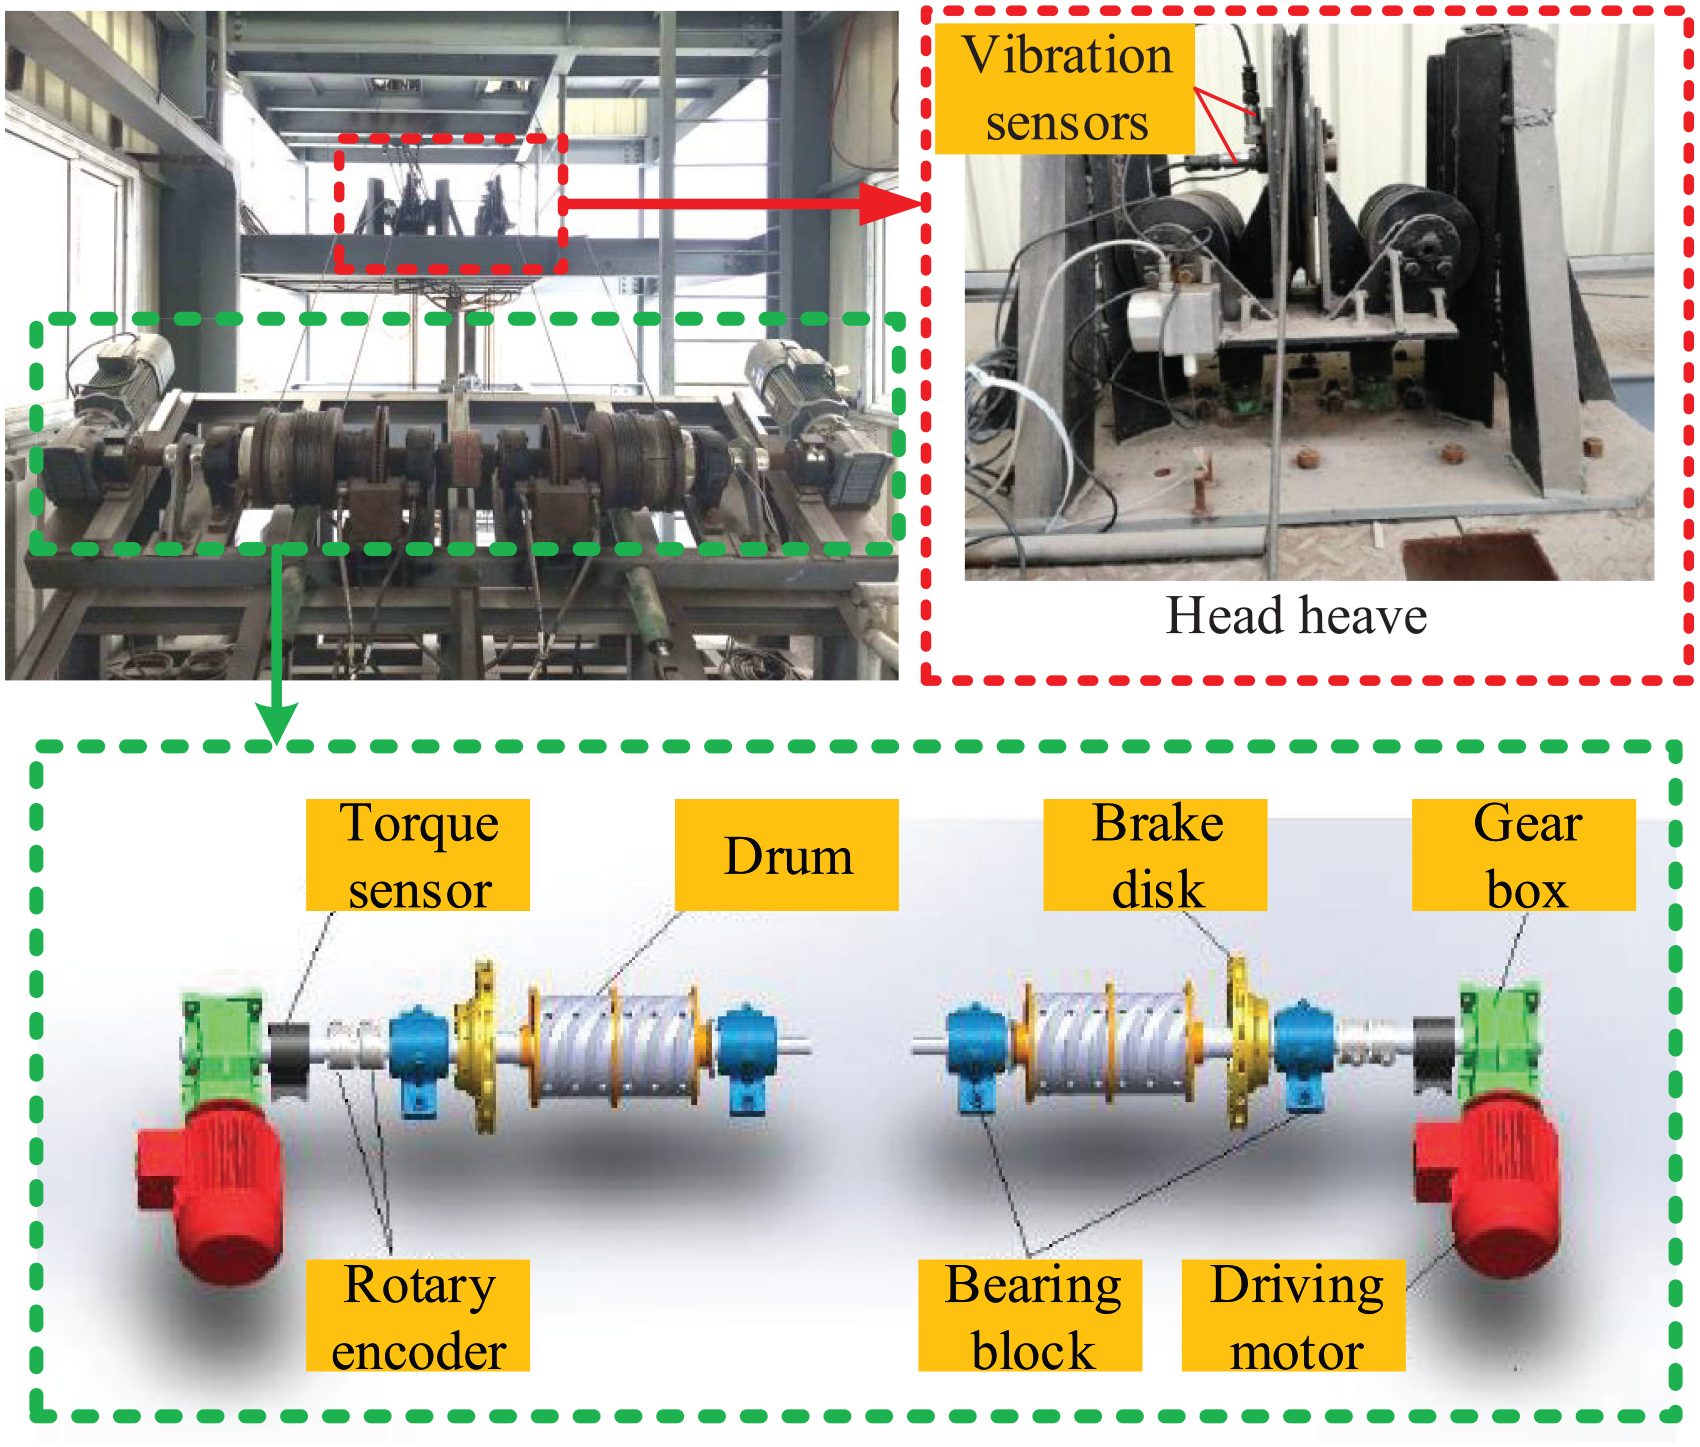
Test rig.
Main technical parameters of the test rig.

Vibration signals have abundant fault information which is needed during the diagnosis, so vibration sensors in three directions are installed on the bearing block to collect vibration information. Figure 5 shows a segment of vibration signal and its fast Fourier transform (FFT) spectrum. Three faults have their different performance in vibration signals. To mine necessary fault information from these signals, some characteristic parameters are preselected, which include the maximum value, minimum value, mean value, standard deviation, root mean square error, peak-to-peak value, skewness, and kurtosis expressed as Max, Min, Mean, Std, RMSE, VPP, Skewness, and Kurtosis, respectively. For filtered vibration signals, a segment of 1 s forms one sequence


where

Vibration signal at a bearing block and its FFT spectrum.
After three faults are simulated on the test rig, corresponding vibration signals are collected and the statistical parameters are calculated to build the data set labeled with relevant failure modes or normal status. Part of this data set is listed in Table 2.
Part of the data set of the collected vibration signals.

Max: maximum value; Min: minimum value; Std: standard deviation; RMSE: root mean square error; VPP: peak-to-peak value.
Feature selection
Feature selection can reduce the dimensionality of the data set, facilitate the data mining, and improve classification efficiency and accuracy.
10
The chi-square test is used to screen the features here.
11
For each feature

where
For data set of multiple classes here, the importance of feature

With feature selection algorithm in Statistica, the significance of each feature is calculated, which is listed in Table 3 and shown in Figure 6. According to their significance, five features whose chi-square values are larger than 17 are remained. From primary to secondary, they are RMSE, Min, VPP, Std, and Skewness.
Feature significance.
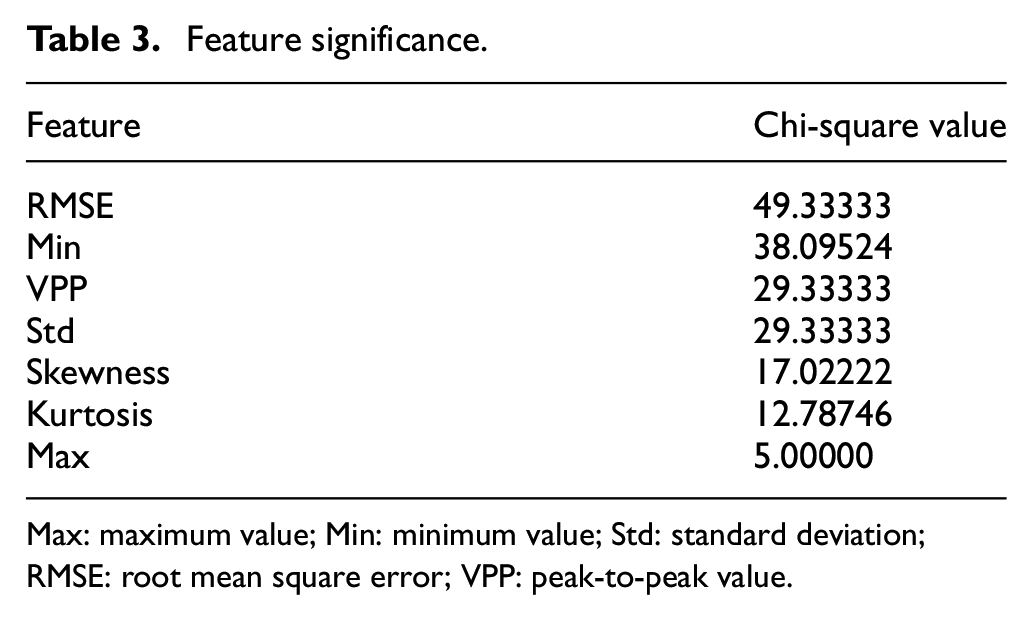
Max: maximum value; Min: minimum value; Std: standard deviation; RMSE: root mean square error; VPP: peak-to-peak value.
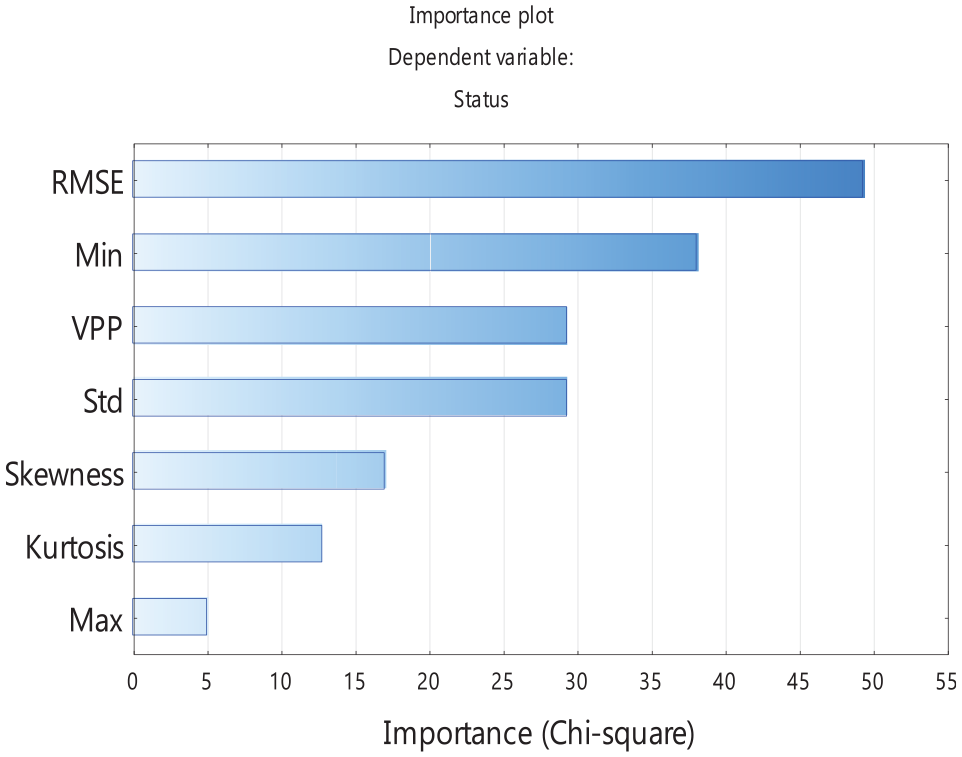
Comparison of the significance of different features.
Algorithm selection
Since there are variety of algorithms that can be employed to mine fault information, algorithm selection should be done to improve fault identification accuracy. Algorithms of boosted tree, K-nearest neighbor, Naive Bayes classification and support vector machine, 13 and five neural networks 14 are compared with gain chart, lift chart, and prediction accuracy as the criteria. 15 Gain chart is the curve of gain with percentile, while lift chart is the curve of response with percentile. 16 Gain, percentile, and response are defined as


where

Gain–percentile chart.

Response–percentile chart.
Prediction accuracy of different algorithms.

The concept of boosted tree algorithm is a novel way to combine the prediction or classification of some basic decision trees. 17 In this algorithm, the basic decision trees classify the data independently, and then, each classifier is assigned a weight which is inversely proportional to its different accuracy. That is, for those classifiers which have a higher misclassification rate, a greater weight will be given and those with a lower misclassification rate will be assigned a lesser weight. When applied on the learning data, the boosted tree algorithm generates a sequence of classifiers and then combines them based on their different weights to form a single best classification. 18
Results and discussion
To verify the comparison result, the methods above are applied on a data set which includes features extracted from vibration signals collected under different fault patterns of head sheaves. During the training process of boosted trees, shown in Figure 9, as the number of trees increases, for the training data, the average multinomial deviance goes down continuously and approaches around zero at number 200. However, for the test data, after a period of decline, the average multinomial deviance does not fall substantively any more. The optimal number of trees is 112 according to the trend and the maximum tree size is 3. Models of other algorithms, including neural network, K-nearest neighbor, Naive Bayes classification, and support vector, are trained with the same data set. A small data set of 20 samples are finally used to test all the obtained models. Among them, same as the analysis, the boosted tree algorithm predicts all 20 cases correctly, which means a prediction accuracy of 100% as shown in Figure 10. For other algorithms, the neural network predicts 14 cases correctly, and the number of correctly identified cases by K-nearest neighbor, Naive Bayes classification, and support vector are 12, 4, and 3, respectively. The result shows that among the algorithms mentioned above, prediction by the boosted tree method has the maximum accuracy.

Training process of boosted tree algorithm.

Prediction result of the faults.
Conclusion
With FTA, faults of head sheaves are analyzed, which shows headframe inclination, bearing faults, and excessive swing of head sheaves are the three most serious failure patterns. A test rig is set up to simulate the faults and collect vibration signals under different fault patterns. Features are extracted from vibration signals and screened according to their significance. Five among eight initially extracted features are remained, that is, RMSE, Min, VPP, Std, and Skewness. Several data mining algorithms are compared based on the sample set collected from experiments on the test rig, and the result shows that the boosted tree algorithm outperforms other methods in the fault diagnosis of head sheaves.
Footnotes
Handling Editor: James Baldwin
Declaration of conflicting interests
The author(s) declared no potential conflicts of interest with respect to the research, authorship, and/or publication of this article.
Funding
The author(s) disclosed receipt of the following financial support for the research, authorship, and/or publication of this article: This research is supported by a project funded by the National Key Research and Development Program (grant number: 2016YFC0600905), National Natural Science Foundation of China (grant number: 51975569), Natural Science Foundation of Jiangsu Province (grant number: BK20170441), and National Natural Science Foundation of China (grant number: 51675520, 51805273).