
Abstract
Considering the importance of alternative fuels in IC engines for environment safety, compressed natural gas has been extensively employed in SI engines. However, scarce efforts have been made to investigate the effect of compressed natural gas on engine lubricant oil for a long duration. In this regard, a comprehensive analysis has been made on the engine performance, emissions, and lubricant oil conditions using gasoline (G)92 and compressed natural gas at different operating conditions using reliable sampling methods. The key parameters of the engine performance like brake power and brake-specific energy consumption were investigated at 80% throttle opening within 1500–4500 range of r/min. For the sake of emission tests, speed was varied uniformly by varying the load at a constant throttle. Furthermore, the engine was run at high and low loads for lubricant oil comparison. Although compressed natural gas showed a decrease in brake-specific energy consumption (7.94%) and emissions content, (G)92 performed relatively better in the case of brake power (39.93% increase). Moreover, a significant improvement was observed for wear debris, lubricant oil physiochemical characteristics, and additives depletion in the case of compressed natural gas than those of (G)92. The contents of metallic particles were decreased by 23.58%, 36.25%, 42.42%, and 66.67% for iron, aluminum, copper, and lead, respectively, for compressed natural gas.
Keywords
Introduction
Petroleum has been used as a primary fuel in the power generation and transportation sectors since the past century, leading to scarcity of the reserves and inflation of oil prices. 1 , 2 Consequently, it has become a crucial problem to meet the rapidly growing demand for fossil fuels when their reserves are depleting at a very alarming rate. Moreover, about 25 billion tons of CO2 are being released into the atmosphere annually, solely because of human activities which serve as the main reason for global warming. Therefore, it is necessary to develop new technologies and discover alternatives for gasoline to overcome the shortage with considerably less harmful fuels. 3 , 4 In this regard, a sustainable policy should be established to adopt a cleaner-burning fuel in the transportation sector, as it uses a large share of petroleum. 5 , 6 Many countries are already moving toward the investigation and development of alternative fuels, like compressed natural gas (CNG), to meet the energy demand and ensure the safety of the environment from hazardous exhaust gases. 7 , 8
Bi-fuel engines can operate on CNG without any major loss in their working range. But there was a 12% decrease in the CNG-fueled engine power performance as shown by Evans and Blaszczyk 9 and a significant reduction in volumetric efficiency. They attributed it to the greater space occupied by incoming air in the CNG–air blend. Furthermore, lesser fuel injection accompanied with the higher energy potential of CNG decreased the average value of torque and its higher heating value reduced the average brake-specific fuel consumption (BSFC) comparatively to (G)92, although it increased the net thermal efficiency. However, CNG showed better performance than that of gasoline in the mixture formation, knocking free combustion at a higher compression ratio and lean combustibility. 10 Relatively, a 28.8% increase in brake power (BP) was observed when the engine was fueled with (G)97, while CNG showed comparatively 17.2% reduction in BSFC and a notable decrease in the exhaust gas temperature. 11 In the case of engine emissions, the amount of discharged CO2 and carbon monoxide (CO) was reduced in comparison to gasoline, because methane (CH4) carries higher hydrogen contents. 11 – 13 The average contents of the total hydrocarbons (HCs) were also decreased owing to better mixing and lean burning in the case of CNG. 14 Thermal management system was used to analyze the behavior of nitrogen oxide (NOx) emissions, which showed an irregular trend. 15 However, there was a significant decrease in the content of NOx emissions, as discussed by Duc et al., 12 along with a decrease in CO, HC, and CO2 emissions for CNG. They observed a decrease of 68%–90% in the contents of NOx, 12%–96% decrease in the contents of HC, and 90% decrease in the emissions of CO2 under various load conditions. Many efforts are also being performed to investigate the utility of CNG in bi-fuel compression ignition engine for improvement of the fuel economy and reduction of NOX and soot emissions. In fact, bi-fuel engine showed low NOx and particulate matter (PM) emissions when operated on a premixed compression ignition strategy compared with the normal compression ignition engine. 16 However, the low partial pressure of the air and the high-specific heat ratio of the air–CNG mixture caused a decrease in the temperature at the end of compression stroke, which affected the thermal efficiency and increased HC and CO emissions. However, the engine performance was improved along with a decrease in the CO and HC contents by running the engine under low load condition when CNG injection timing and duration was optimized. 17
Although researchers have conducted many studies to experimentally assess the CNG-fueled engine emissions and performance, 15 , 18 – 24 the lubricant oil conditions are not thoroughly examined. The different moving parts of the engine are lubricated to reduce friction and cool down the piston and the surroundings. 7 , 25 – 28 Moreover, lubricant oil composition and engine operating conditions determine the decrease or increase in fuel consumption. 29 , 30 The consumption rate increases due to an increase in the lubricant oil viscosity because of oxidation or contamination. The deteriorated byproducts of the lubricant oil also have very severe effects on the environment and health. 31 , 32 Therefore, to optimize the fuel economy, different lubricant oils were used in CNG-fueled engines within a specified distance range by keeping the viscosity constant. 33 Since gasoline and CNG in the SI engine have different working temperatures and physicochemical properties, this implies a relative degradation of the lubricant oil. 11
In this study, the speed is gradually increased to obtain the BP. Emissions, brake-specific energy consumption (BSEC), and exhaust gas temperature are recorded using a single increment strategy. Lubricant oil conditions are monitored by running the engine for 120 h using both fuels separately at different loads. A comparative investigation is done for two fuels, that is, (G)92 and CNG, in this way.
Experiment details and strategy
Figure 1 describes the experimental study for the current work and Table 1 reveals the specifications of the test engine. Furthermore, the physiochemical properties of (G)92 and CNG (94.47% methane, 5.53% (ethane, propane, butane, CO2, N2 etc.)), used during the current examination, are shown in Table 2.

Test setup.
Engine specifications.
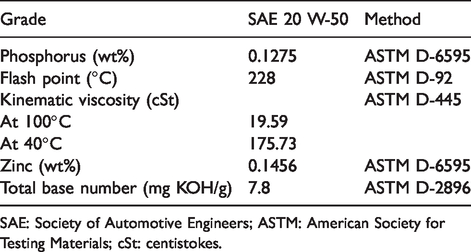
Table 2. Fuel characteristics. a

CNG: compressed natural gas; A/F: air-to-fuel ratio.
PSO: Pakistan State Oil.
Engine performance and fuel consumption
To measure the peak BP, the output shaft was connected to a dynamometer (7-in., dynamite kart) with measurement accuracies of ±1 r/min, ±0.004 hp for speed and BP, respectively. Dynamo-2010 software was used to record the data. Per the manufacturer’s recommendations, calibration was done before running the test. Data for three test averages were recorded by varying the speed at a constant throttle position. BSEC and BP were recorded during the test run employing stepwise r/min increment strategies (see Table 3).
Table 3. Engine performance and emission test plan at 80% open throttle.

BP: brake power; BSEC: brake-specific energy consumption; HC: hydrocarbon; CO: carbon monoxide.
A measuring cylindrical tube (resolution = 1% of full-scale reading) with a gasoline-delivery mechanism was used to measure the gasoline consumption, while the CNG cylinder was placed on a weighing machine (resolution = 0.1 g) which digitized the comparative decrease in weight as gas was being consumed. The pressure of 200 bar was maintained for natural gas in a separate cylinder by mounting a crossover kit in the testbed. CNG was supplied to the intake engine duct at a pressure of 1.1 bar.
Exhaust gas temperature and emissions
The temperature of the exhaust gas was monitored by inserting a thermocouple (K-type) in the exhaust manifold. The contents of HC, CO, and NOx were measured in the test engine tail pipe using Testo-350 gas analyzer. The steady-state emissions were recorded by inserting the probe for at least 1 min at a given engine speed with measurement accuracies of ±10, ±1, and ±1 ppm for HC, CO and NOx emissions, respectively. Table 3 also describes the designated stepwise r/min increment strategies to note the exhaust emission levels along with the temperature when the test engine was fueled with natural gas and gasoline separately. Furthermore, HC, CO, and NOx data were also subjected to Weibull distribution with 95% confidence interval to find the acceptability of data.
Lubricant oil conditions
As suggested by the manufacturer, commercially available lubricant oil (characteristics displayed in Table 4) was used in the engine. Fresh (0 h) and deteriorated lubricant oil samples, after 40, 80, and 120 h of engine working, for both fuels, were obtained from the crankcase. The engine was filled with 450 mL of fresh lubricant oil after each measurement. The load on the engine was altered from high to low after 60 h of engine operation. Finally, the standard test methods (see Table 4) were used to analyze the collected samples over 120 h of engine working for flash point, kinematic viscosity, total base number (TBN), phosphorus (P) and zinc (Zn) additives depletion, and wear particles (iron (Fe), lead (Pb), aluminum (Al), copper (Cu)).
Results and discussion
In this work, (G)92 and CNG are supplied to the small-scale test engine to investigate the variations in BSEC, BP, emissions, and lubricant oil condition. The obtained results are as follows.
Comparison of engine performance and fuel consumption
Like all other internal combustion engine fuels, combustion of CNG and then expansion in the closed cylinder is the basic mechanism for its power generation. Therefore, performance of the engine is affected by both the engine design and combustion behavior of the fuel. The ignition of CNG takes relatively more time once the spark is initiated, which causes a bigger flame kernel and consequently the flame expansion to a larger volume of the combustion chamber. This expansion rate is further accelerated by the burning velocity. Thus, the relatively unburned mixture is compressed outwards by such increase in the combusted volume. The density of the non-reacted blend is greater than that of burned gases even in the vicinity of the flame front, increasing the pressure inside the cylinder. So, this compression heating increases the temperature of the unburned mixture which burns out when the piston moves toward the outer dead center. Leaner burning velocity is a valuable parameter to analyze the premixed flame in terms of net rate of reaction. The major fraction of CNG consists of inert gases that is., methane, CO2, and N2 which act like diluents to reduce the flame temperature due to which CNG burns with a relative lower laminar burning velocity. 34
Figure 2(a) depicts the variation between BP and the engine speed. In the first increment strategy, the BP is increased with increase in the r/min for both fuels. However, BP started decreasing after 4300 r/min that is., in the second increment strategy. On average, (G)92 produced 39.93% higher BP relative to CNG. Variations in exhaust gas temperature for (G)92 and CNG are given in Figure 2(b). A continuous increase in the exhaust gas temperature can be seen in Figure 2(b) as the engine speed increases. However, (G)92 showed comparatively higher temperature (12.93%) over the designated range of revolutions per minute (1500–4500). Unaltered ignition timing is one of the reasons for reduction in BP and temperature for CNG fuel. 11 , 12 , 35 In addition, low flame velocity and air displacement are the other factors for the decrease in BP for CNG as it mostly comprises methane (CH4), which has the lowest flame velocity among hydrocarbons. Hence, the BP is decreased due to unwanted heat transfer during prolonged combustion of CNG when unburned hydrocarbons move out with the exhaust gas. 36 – 38
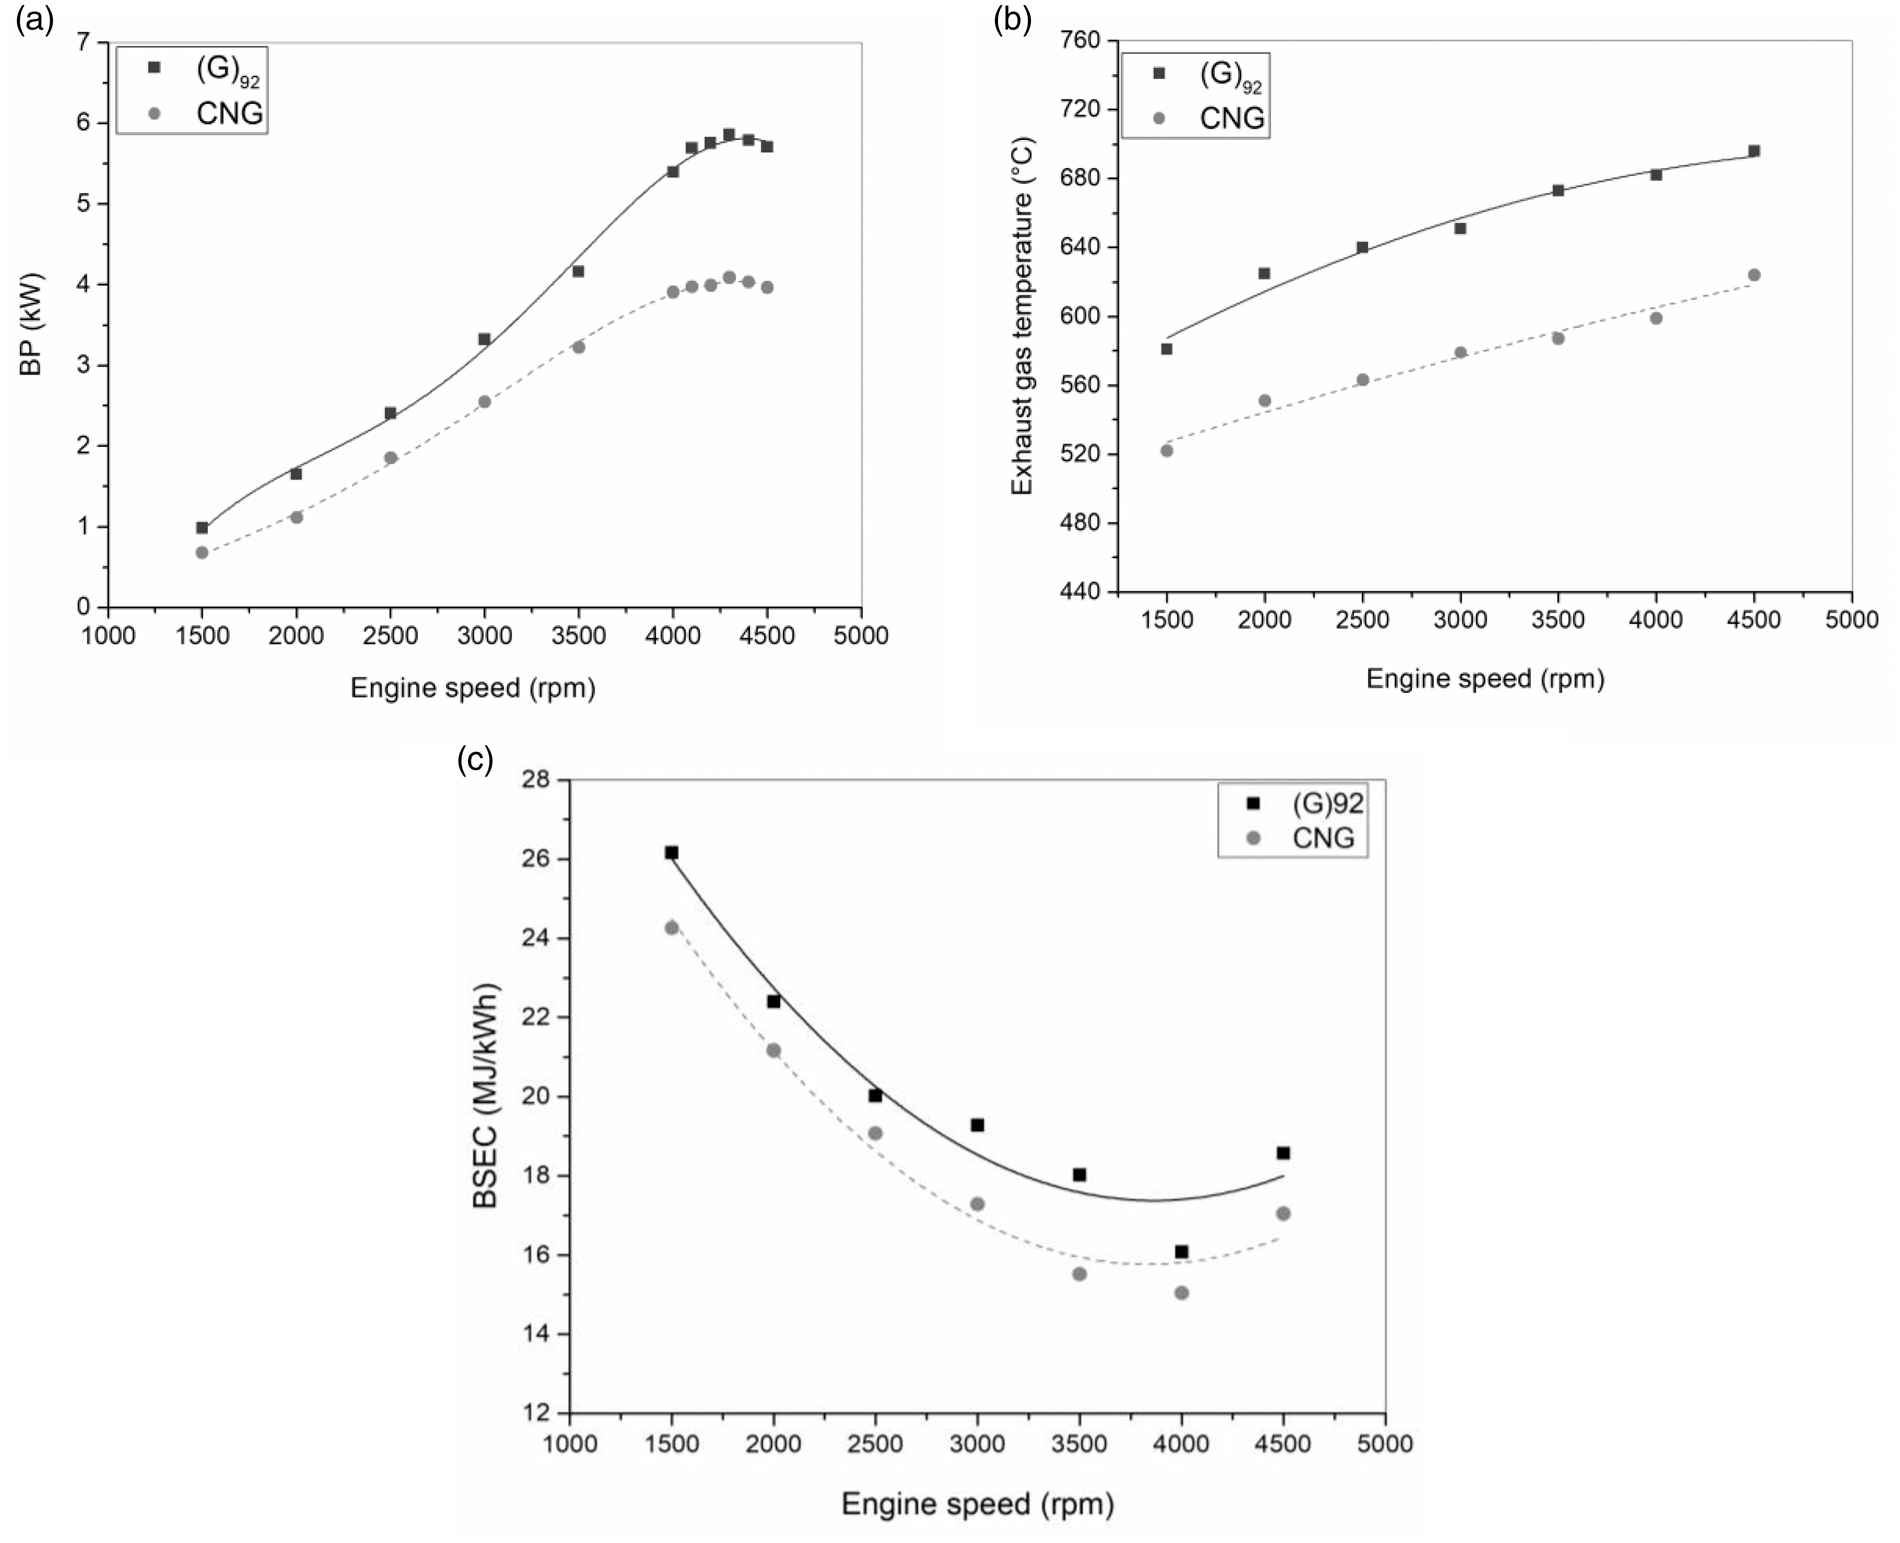
Figure 2(c) depicts the BSEC for both fuels over the specified range of engine r/min. A similar trend was shown by both fuels (initially a decrease, then an increase in the value of BSEC with the increasing speed). However, CNG showed an average reduction of 7.94% in comparison to gasoline. This decline can be attributed to the passive burning and higher energy potential in CNG. 11 , 14 The increase in the fuel consumption for the BP produced is because energy loss to the water jacket is higher at lower speed and fractional friction power increased at a higher speed. 1 , 39 , 40 Moreover, uncertainties for the measurements were also analyzed. The ranges of 0.7%–1.98% and 0.09%–0.17% were determined for BSEC and BP, respectively.
Comparison of exhaust emissions
NOx, unburned hydrocarbons, and CO are produced in SI engines as emissions. HC is produced as a result of incomplete combustion, absorption, and desorption of the fuel on lubricant oil film. 41 The presence of CO in exhaust products is mainly due to partial combustion of the fuels, while NOx is the product of oxygen and nitrogen reaction within cylinder at elevated temperatures. 19 Figure 3(a)–(c) shows the difference in the average content of HC, CO, and NOx for CNG and (G)92 fuels, respectively. In the case of CNG fuel, a significant reduction was observed for all emissions. Improved mixture development within intake pipe and low absorption and desorption of a gaseous fuel by lubricant oil film caused 52.36% reduction in the contents of HC for CNG relative to (G)92, as shown in Figure 3(a). From Figure 3(b), CO contents were reduced to 44.68% in the case of CNG. Figure 3(c) shows that NOx was reduced to 25.43% in the case of CNG compared with (G)92, since it solely depends on the combustion temperature. 1 , 7 , 11 , 12 CNG because of its much lower molecular weight (16.04 g/mol), compared to gasoline (114 g/mol), can easily mix with air homogeneously while liquid fuels take more time to make a homogeneous mixture due to prior atomization and vaporization. This results in low HC and CO emissions in the case of CNG due to better combustion. Lower carbon-to-hydrogen ratio for CNG at given air supply also constitutes the lower CO count. 14 NOx emissions are reduced for CNG as it displaces the air entering the combustion chamber, which means lesser nitrogen is available to produce NOx. Figure 3(d) describes the variation in lambda value in comparison to the engine speed for both CNG and gasoline. Lambda shows the lean mixture in minimum range of BSEC. With increasing speed, the incoming air–fuel blend is less lean for liquid and gaseous fuels that justify the increase in BP, exhaust gas temperature, and NOx emissions.

(a)–(d): Emission contents of HC, CO and NOx, and Lambda for (G)92 and CNG.
Table 5 illustrates the average ±95% CI, p values, and average ± standard deviation for average HC, CO, and NOx levels employing (G)92 and CNG fuels in small-scale SI engine. It can be observed visibly that p values stay greater than 0.25 throughout, in Table 5. Figure 4(a) and (b) demonstrates HC emissions data Weibull distribution for gasoline and CNG fuel. The 95% confidence band scenarios were observed to produce good fit for HC contents with less inter r/min variability for CNG in comparison to gasoline. Similarly, Figure 4(c)–(f) describes reliable data scattering for CO and NOx concentrations, respectively, for both fuels. It can be observed from these figures that the data are well contained by the 95% confidence band, which ensures adequacy of the emission data. 42

(a)–(f): Emission data distribution at 95% confidence band for gasoline and CNG.
Lubricant oil properties and standard methods.

SAE: Society of Automotive Engineers; ASTM: American Society for Testing Materials; cSt: centistokes.
Average HC, CO, and NOx for gasoline and CNG with 95% CI.

Avg: average; CI: confidence interval; SD: standard deviation.
Comparison of lubricant oil conditions
Engine working highly depends on the properties of lubricant oil as it reduces the friction between the metallic parts of the engine and avoids their thermal and material degradation. 43 , 44 Lubricant oil mainly consists of base oil and additives to lubricate the engine mating parts and avoid its deterioration at high temperature, respectively. 45 The degradation of the lubricant oil is determined by engine temperature, its operating time, and the outside environment. 7
The most critical type of deterioration is the oxidation. Sludges, resins, carbonaceous deposits, and acids are produced as a result of the chemical reaction between unstable contents of oil and oxygen. These products not only increase the viscosity of the oil which itself affects the engine performance, but also fill the small openings and filters and repel flow. The oxidation rate of the lubricant oil at a temperature below 60°C is lower but the oil oxidation life starts decreasing as soon as the temperature increases. Furthermore, the rate of oxidation increases in the presence of metallic contaminants and water molecules. These water molecules are also responsible for corrosion. The significantly higher operating temperature can cause thermal degradation of the oil, which makes it polymerized and cracked. The viscosity is decreased by leakage of the oil into the crankcase that increases the metal-to-metal contact, which results in abrasion. 11
Suspended metallic particles and contaminants
The presence of suspended metallic particles in lubricant oil describes the engine conditions and source element. The suspension mostly includes the particles of Fe, chromium (Cr), Pb, Cu, and Al. Figure 5 describes the comparison of contents of these particles for (G)92 and CNG. At 40 h of engine working on (G)92 and CNG, the maximum Fe contents were observed for CNG (32 ppm) and gasoline (43 ppm). It can be seen from Figure 5 that CNG has produced less suspended Fe (23.58%), Cr (50%), Pb (66.67%), Cu (42.42%), and Al (36.25%) particles compared to (G)92. This decrease can be reasoned by the lower working temperature and fuel dilution for CNG in comparison to (G)92. 11

Comparison of contents of water vapors, Fe, Cr, Pb, Cu, and Al for (G)92 and CNG.
Physiochemical properties
Variations in viscosity have severe effects on the lubrication of an engine. These variations are resulted from the formation of resinous products due to oxidation, the presence of water vapors, thickness improvers, diminution, and fuel dilution. At 40 h with high load, viscosities were found to be the minimum (Figure 6(a) and (b)). However, (G)92 showed a 6.68% decrease in viscosity than that of CNG (see Figure 6(a)). The TBN value of lubricant oil is an indication of alkaline derivatives present in it that determine its serviceability. A lower TBN value means higher corrosion and poor performance. However, a higher TBN indicates better antioxidation capability. On average, 2.73% decrease in TBN was observed for (G)92 comparatively to CNG for the complete engine run (see Figure 6(c)). The variations in the measure of flash point are shown in Figure 6(d). CNG showed a relatively lower decrease in flash point values compared to liquid fuel. The flash points for CNG and (G)92 were 215°C and 200°C, respectively, at 120 h of engine running. This decrease in the value of viscosity and flash point for (G)92 can be explained by its existence in the liquid state, which results in fuel dilution.

(a)–(d) Comparison of physiochemical properties of lubricant oil for (G)92 and CNG.
Additives
The lubrication performance of the oil was enhanced by 10%–20% additives and the contents of Zn and P were found in a reasonable range of smooth engine running. Components of Zn and P form protective low friction films and act as anti-wear compounds. The comparison of Zn and P depletion for complete engine operation when fueled with (G)92 and CNG separately is shown in Figure 7. The comparatively higher deterioration rate (7.13% for Zn and 2.37% for P) was observed for (G)92, due to higher working temperature and fuel dilution.

Comparison of Zn and P in lubrication oil for (G)92 and CNG.
Conclusion
This study focuses on a bi-fuel engine performance characteristic, lubricant oil conditions, and emission contents using (G)92 and CNG under different operating conditions for a longer time interval. It is concluded that engine running on (G)92 showed a 39.39% and 8.63% increase in BP and BSEC, respectively, than that of running on CNG. However, CNG showed lower exhaust emission contents of HC (52.36%), CO (44.68%), and NOx (25.43%) compared to (G)92. Although wear debris count was higher at high load for both fuels, CNG showed a 23.58%, 50%, 66.67%, 42.42%, and 36.25% lower count for Fe, Cr, Pb, Cu, and Al, respectively. Moreover, kinematic viscosity, flash point, and TBN of lubricant oil decreased at a rapid rate for (G)92, relative to CNG. At the end, it was observed that additives depletion was also lower for CNG than that of (G)92. Consequently, CNG fuel was better suited for SI engine in all governing parameters, considering sustainable environmental development at the expense of dramatically degraded engine BP. Hence, the results are significant for improved performance of the lubricant, which directly affects the engine life and its operation, and reduction in harmful engine emissions for the safety of the environment using CNG as an alternative fuel. However, advanced technologies need to be commercially developed to combat power loss in the case of CNG, as it has remarkable advantage over liquid fuels to make environment protection economical and guarantee the long life of vehicles.
Footnotes
Handling Editor: James Baldwin
Declaration of conflicting interests
The author(s) declared no potential conflicts of interest with respect to the research, authorship, and/or publication of this article.
Funding
The author(s) received no financial support for the research, authorship, and/or publication of this article.