
Abstract
Research on vibration characteristics of hydraulic valves is helpful to improve the performance of the hydraulic valve. In this article, a visualization experimental method is designed to capture the cone valve core vibration, and the image sequence of the vibration is obtained. And the least-squares contour fitting of the valve core is proposed to analyze the vibration characteristics of the valve core, which could eliminate noise in the vibration signal and improve accuracy. The difference of the least-squares variance between adjacent data points obtained by least-squares contour fitting is one order of magnitude smaller than corner detection method, while the signal-to-noise ratio is more than twice the corner detection. Furthermore, the frequency spectrum and amplitude of the valve core vibration are also discussed. The deviation of the valve core from the coordinate origin will increase with increasing of the pressure difference and decreasing of the pre-compression of the spring and the amplitude of vibration increases too. The vibration signal of the valve core under different conditions has similar frequency spectrum, which is mainly composed of the vibration signal spectrum caused by the fluctuation of oil pressure and turbulence of the liquid system.
Introduction
In hydraulic control valves, to achieve the performance of good sealing, fast response, large flow, and strong anti-pollution ability, pilot and control stages are commonly designed to conical structures. The valve core combined with a spring is usually used as an automatic valve, the static and dynamic forces act on the valve while it is used to regulate the flow during the startup and shut down operation. Consequently, problematic phenomena occur, such as valve vibrations, cavitation bubble, high-frequency noise, thus dissipating hydraulic energy, deteriorating the performance of the hydraulic power system, and limiting its practical applications.1,2 Vibration signal of the valve core is carrier status information, which contains a wealth of equipment abnormal or fault information. Vibration signal analysis method is one of the most effective and commonly methods in equipment fault diagnosis. Therefore, it is very important to study the vibration characteristics of cone valves.
In view of the valve vibration, scholars have conducted many simulations and experimental studies. As early as 1964, Funk 3 developed a method to judge the stability of the cone valve and identified measures to improve the stability of the cone valve using the linearization method. Thomann 4 studied the vibration model of the cone valve, analyzed the force movement of the pipe and valve core, and obtained the stability condition of the cone valve. Hayashi et al. 5 simulated the vibration of the poppet valve, considered the collision between the valve core and the base, and the chaotic phenomenon of the vibration of the poppet valve was also studied. Licsko et al. 6 presented mathematical modeling and stability judgment of the single-stage relief valve. The initial bifurcation causing oscillation is found to be either super- or sub-critical in different parameter regions. For flow speeds beyond the bifurcation, the valve starts to chatter, a motion that survives for a wide range of parameters, and can be either periodic or chaotic. Borghi et al. 7 used computational fluid dynamics (CFD) software to analyze the pressure, velocity, and flow of the cone valve relief valve. The steady-state hydrodynamic force of the valve was calculated by the pressure integral on the valve core surface, and the proportional relationship between the steady-state hydrodynamic force and the transient hydrodynamic force was estimated. Yang 8 calculated the hydrodynamic force by integrating the pressure and velocity on the surface of the hydraulic valve port. An et al. 9 carried out a numerical simulation and experimental study on the flow field of three different valve core structures. The streamlines, distributions of the static pressure and turbulent kinetic energy throughout the flow field were discussed numerically and experimentally. Dasgupta and Wattom 10 studied the dynamic characteristics of proportional control piloted relief valve through simulation technology. Based on the consideration of various pressure-flow characteristics across the valve port and orifice, some key parameters which have important influence on the transient response of the system were discussed. In the experimental research, the vibration signal often measured using sensors, which is converting the mechanical energy into electrical energy. There are many kinds of vibration sensors, such as inductive displacement sensor, 11 load cell, 12 pressure sensor,13,14 and vibration sensor.15,16 As we know, sensors usually require contact measurements, which will influent the vibration signal. In recent years, image observation method as another effective experimental method to study the vibration of valve core has been continuously concerned. The image observation method belongs to non-contact measurement, there is no contact effect on the valve core in the process of extracting the vibration signal,17,18 which will improve the accuracy of measurement. In this article, a high-speed camera is used to obtain the vibration images of the conical valve cone, and the method of least squares is proposed to extract the most information from the vibration signal of the valve cone which is more precise in data analysis than the traditional corner detection. The vibration characteristics of cone valve core under different pressure differentials are also discussed.
Experimental and image recognition methods
Experimental methods
The diagram of the experimental system is shown in Figure 1(a), which consists of a hydraulic system and a high-speed photography system. In the hydraulic system, the oil passes through a pressure-reducing valve, a turbine flow meter, a pressure gauge, an experimental valve, and a backpressure valve in sequence. In order to obtain image series of the cone valve core vibration, the valve body of the experimental valve is machined with a transparent Plexiglas material, whose structure is shown in Figure 1(b). The core will vibrate under the action of hydrodynamic and hydraulic pressure when the hydraulic oil flows from the top to the bottom of the cone through the channel of the valve cone and seat. The inlet and outlet pressures of the cone valve are adjusted by the pressure-reducing valve and the backpressure valve, respectively, and measured by the pressure gauge. The flow through this transparent valve is recorded by a turbine flow meter (model: YH-LWC10SLA; range: 0.2–1.2 m3/h; accuracy: 1.0%).
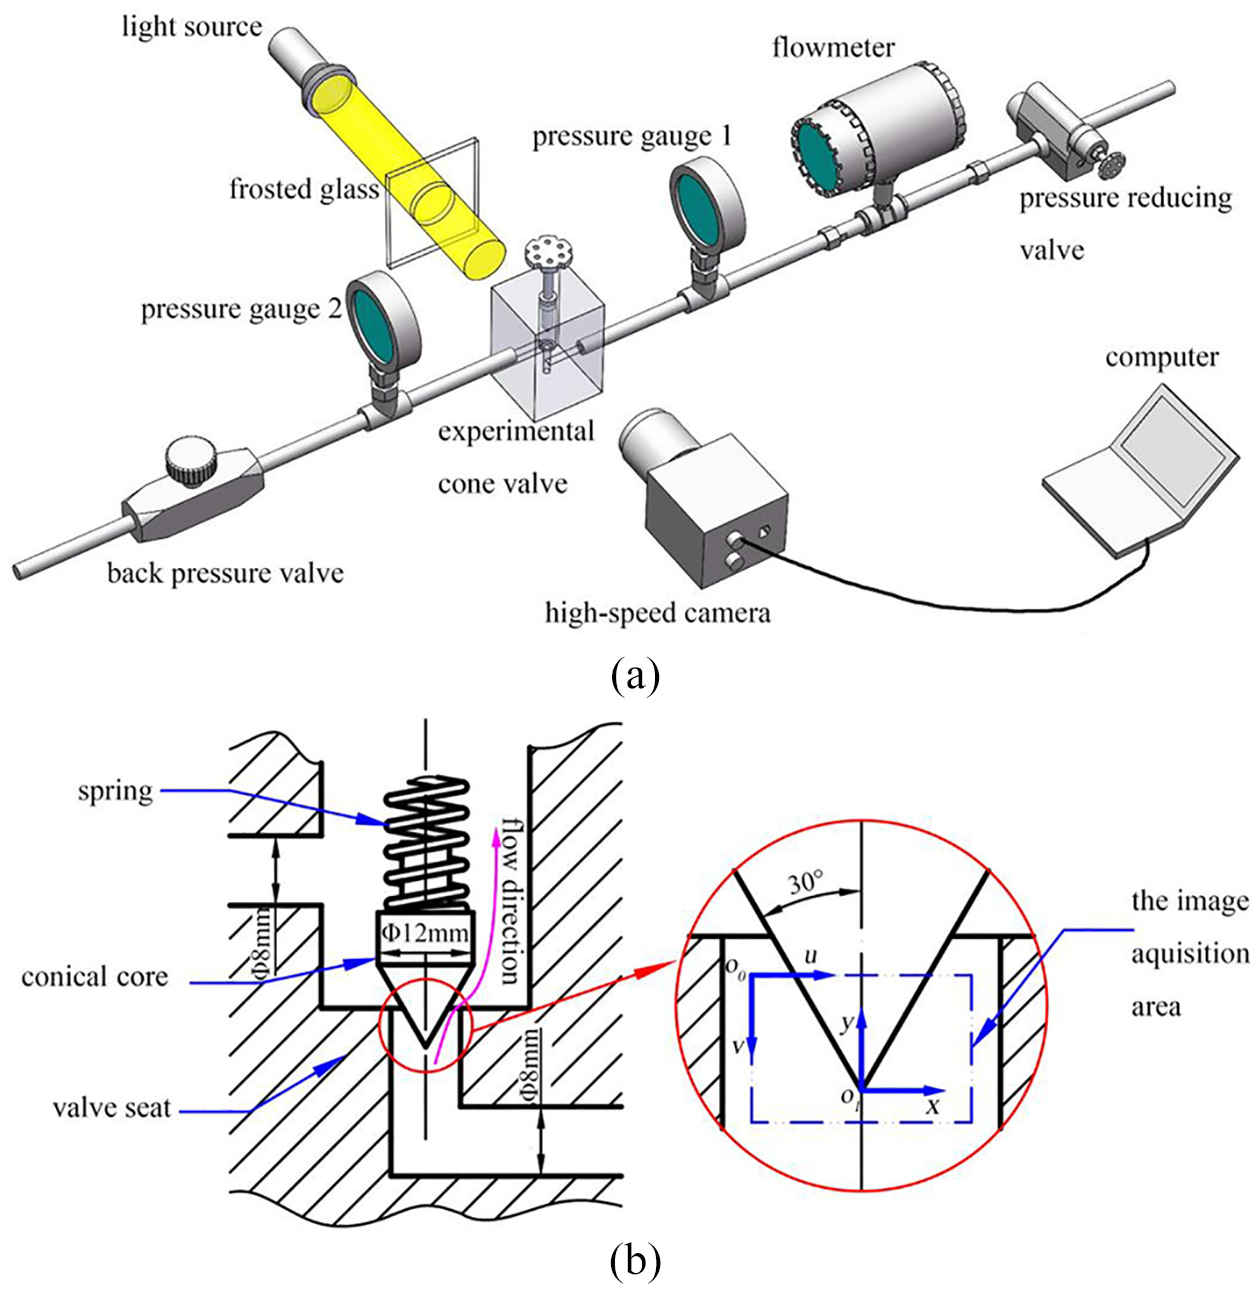
Schematic of experimental apparatus: (a) the diagram of the experimental system and (b) the diagram of the structure of the conical valve.
The high-speed photography system is used to capture the vibration of the cone valve. It consists of a high-speed camera (model: Hispec3; maximum frame rate: 93,000), a halogen lamp, and a frosted glass. The high-speed camera and light sources are arranged on both sides of the transparent valve, and the frosted glass is employed to produce uniform lighting. The frame rate of the high-speed camera is 5584 frames per second, while the image resolution is 1280 × 184. In order to observe the cone vibration more accurately, the area marked by the blue double-dotted line in Figure 1(b) is selected as the image acquisition area. The pixel coordinate system (uo0v) is established in the upper left corner of the image acquisition area, and the image coordinate system (xo1y) is established at the top of the core at the initial time, as shown in Figure 1(b).
The typical image sequences
A series image of cone valve core vibration obtained by a high-speed camera was shown in Figure 2. The photos show that the core moves up and down under the action of liquid pressure, and the displacement appears periodically. The vibration forms of the core are transverse vibration and axial vibration, and the frequency of these two vibrations is not the same. Our article mainly focuses on axial vibration. Figure 2 also shows that the oil environment makes the background of the photograph more complicated and the perturbations will grow in information extraction. There are some vertical trajectories caused by oil flow around the core, which make the photo not neat.
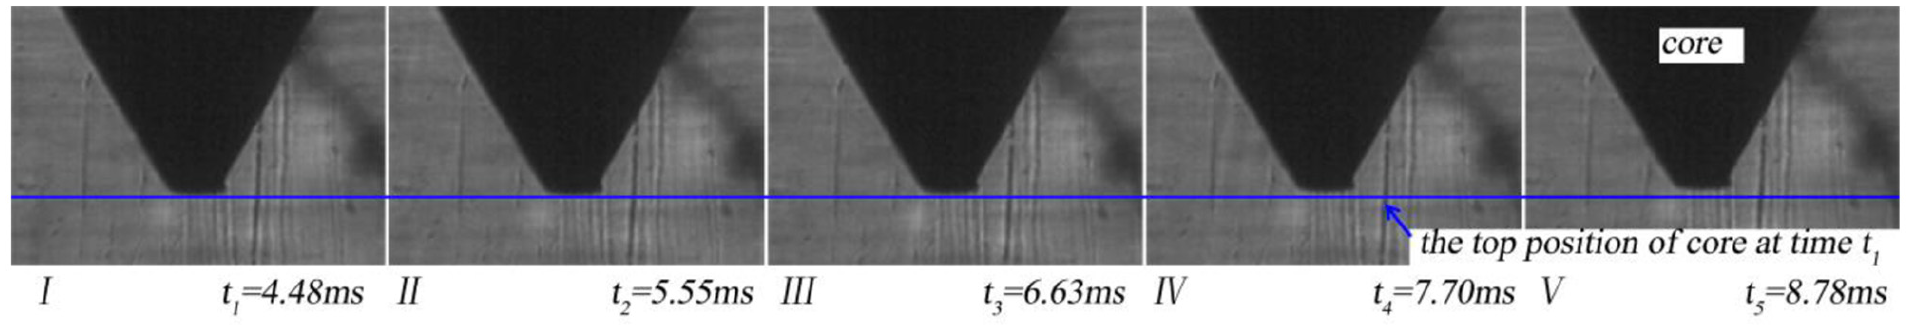
Typical image sequences of core movement.
Contour image extraction
The photographs of the valve core movement obtained experimentally will inevitably contain salt-and-pepper noise, oil flow traces, and others, as shown in Figure 2. The image-processing algorithm for detecting the vibration signal of the valve core is shown in Figure 3. Therefore, image filtering,19,20 image sharpening,21–23 and segmentation are used to improve the image quality in order to extract the contour of the valve core better. The median filtering is used to remove salt-and-pepper noise. Image sharpening is needed to highlight the characteristics of the valve core contour. The core image is to be sharpened as a whole first, and then locally sharpen needed in order to get better boundary. The gray threshold segmentation method laying the foundation for edge detection 24 is then used to segment the image. Canny operator is used to extract the boundary of the valve core. Then, corner detecting is used to retrieve data from the photo.

The image-processing algorithm.
The typical valve core images after image preprocessing are shown in Figure 4. From the figures, we could found that median filtering can remove noise from the original image very well, as shown in Figure 4(b). After the image-processing techniques of sharpen and segmentation, the conical boundary of the core has been well enhanced, as shown in Figure 4(c)–(d). Then, it is necessary to detect the edge of the gray image, canny operator is the optimal trapezoid edge detection operator,25,26 which is used to get the cone valve vibration contour image. As shown in Figure 4(e), the contour profile of the valve core is well detected.

The typical valve images of valve core vibration in the image-processing techniques: (a) the original image, (b) the filtered image, (c) the sharpened image, (d) the segmented image, and (e) the conical spool profile.
Vibration detection of core based on corner detection
In order to obtain the characteristic of valve core vibration, the Harris corner detection algorithm can be used.27–30 The basic idea of the corner detection algorithm is to use a fixed window to slide in any direction on the image. Comparing the two cases before and after sliding, the change degree of the pixel gray level in the window is calculated. If the gray level of any sliding direction varies greatly, then there is an angle point in the window.31,32
When the window moves, the gray level changes in the corresponding window before and after sliding is shown as follows
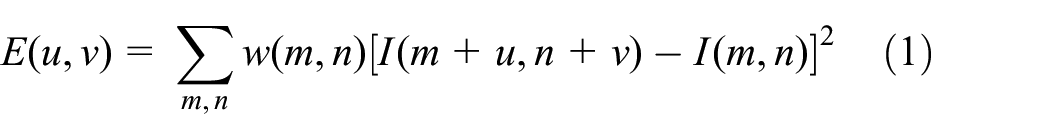
where
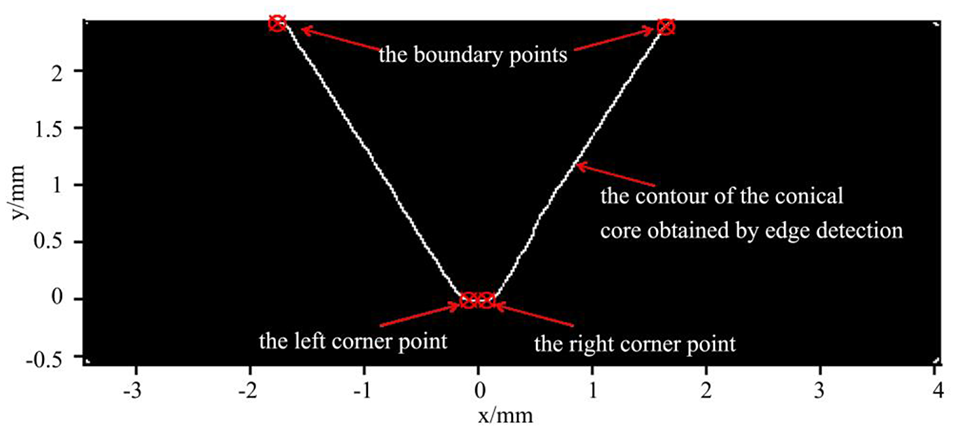
The edge detection and the corner points.
Vibration detection of core based on contour fitting
In order to improve the accuracy of data extraction, the least squares method34,35 is proposed to fit the left and right profile of the valve core cone. The intersection point is the geometric cone vertex of the cone valve core. The fitting function to describe the profile of the valve core cone is expressed as follows

where (u, v) are the coordinates of the left or right side of the conical core.
The right and left contours of the core fitted by the least squares methods are shown in Figure 6. The coordinate system is placed at the geometric cone vertex of the cone valve core. The contour of the valve core fitted by the least squares method is in good agreement with the real left and right profiles of the valve core. Thus, the noise of the valve core contours obtained by edge detection could be reduced. The vertex of the valve core is the intersection point of two straight lines. In addition, this point vibrates with the core, so the characteristics of vibration can be detected on the track of this point’s vibration. The variation of the displacement in the vertical direction of the valve core versus time obtained by the least squares fitting method could also be obtained.
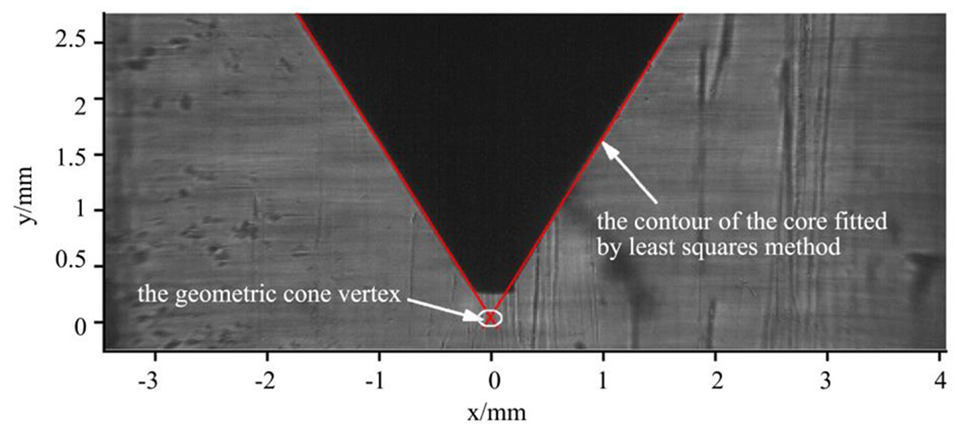
The core contour obtained by least squares fitting.
Results and discussions
Analysis of vibration detection methods
Figure 7 shows the vibration signal of the valve core in the vertical direction detected by the corner detection method and the least squares method, respectively, by analyzing 120 image sequences. The results show that the vibration signals obtained by these two methods have the same envelope contour. That is to say, the two groups of vibration signals have the same amplitude and period. The vibration of the cone valve core is periodic signals, whose period is 4300 μs and the amplitude is 0.06 mm. However, there is some noise in the image sequence, which makes the inevitable error in the contour of the valve core obtained by image preprocessing, thus reducing the accuracy of corner detection. On the other hand, the ideal contour of valve core can be obtained by linear fitting of the contour of valve core obtained by image preprocessing, and the error caused by image preprocessing can be greatly reduced. So, the accuracy of displacement detection has been improved in comparison with the core displacement obtained by the corner detection method. Therefore, we could find that the curve obtained by the least squares method is much smoother. The least squares method proposed in our article is more precise and could improve the accuracy of image recognition.

Vibration signals of the valve core obtained by the corner detection method and the least squares method.
The signal-to-noise ratio (SNR) representing the signal purity and the variance are shown in Table 1. The SNR obtained by the least square method is 16.7472, which is much larger than that obtained by the corner detection method. The variance of the vibration signal obtained by corner detection is 0.3004, while it is 0.0545 in case of the least squares method. The results show that the vibration signal of the valve core obtained by the least squares method has better stability and accuracy. The image-processing method based on the least squares method is more suitable for the case of small amplitude.
The SNR and the variance using the two different methods.

SNR: signal-to-noise ratio.
The effect of inlet pressure on valve core vibration
In this article, the balanced position and amplitude of the valve core vibration at different inlets are studied. Figure 8 shows the vibration characteristics of a core under different inlet pressure while the spring stiffness is 2 N/mm and the outlet pressure remains at 2.0 MPa. The pre-compression of the spring is 10.32, 11.84, 13.16, 14.24, and 15.36 mm, while the inlet pressure increases from 3.4, 3.6, 3.8, and 4.0 MPa. The results show that larger liquid force severely compresses the spring, so equilibrium position of the core gradually rises with increasing inlet pressure. Furthermore, the smaller the pre-compression of the spring, the smaller the initial spring force. While the inlet pressure remains the same, the liquid force also remains the same in the valve, and the compression degree of the spring will be greater. Therefore, the equilibrium position of the core vibration rises with the decreasing pre-compression amount of the spring. By analyzing vibration curve of the valve core, the amplitude of vibration signal under different inlet pressure and pre-compression of the spring are shown in Figure 8(b). With the increase in inlet pressure, the amplitude of vibration signal increases, which seems a proportional relationship between them, while there is an inversely proportional relationship between the pre-compression of the spring and the vibration amplitude.
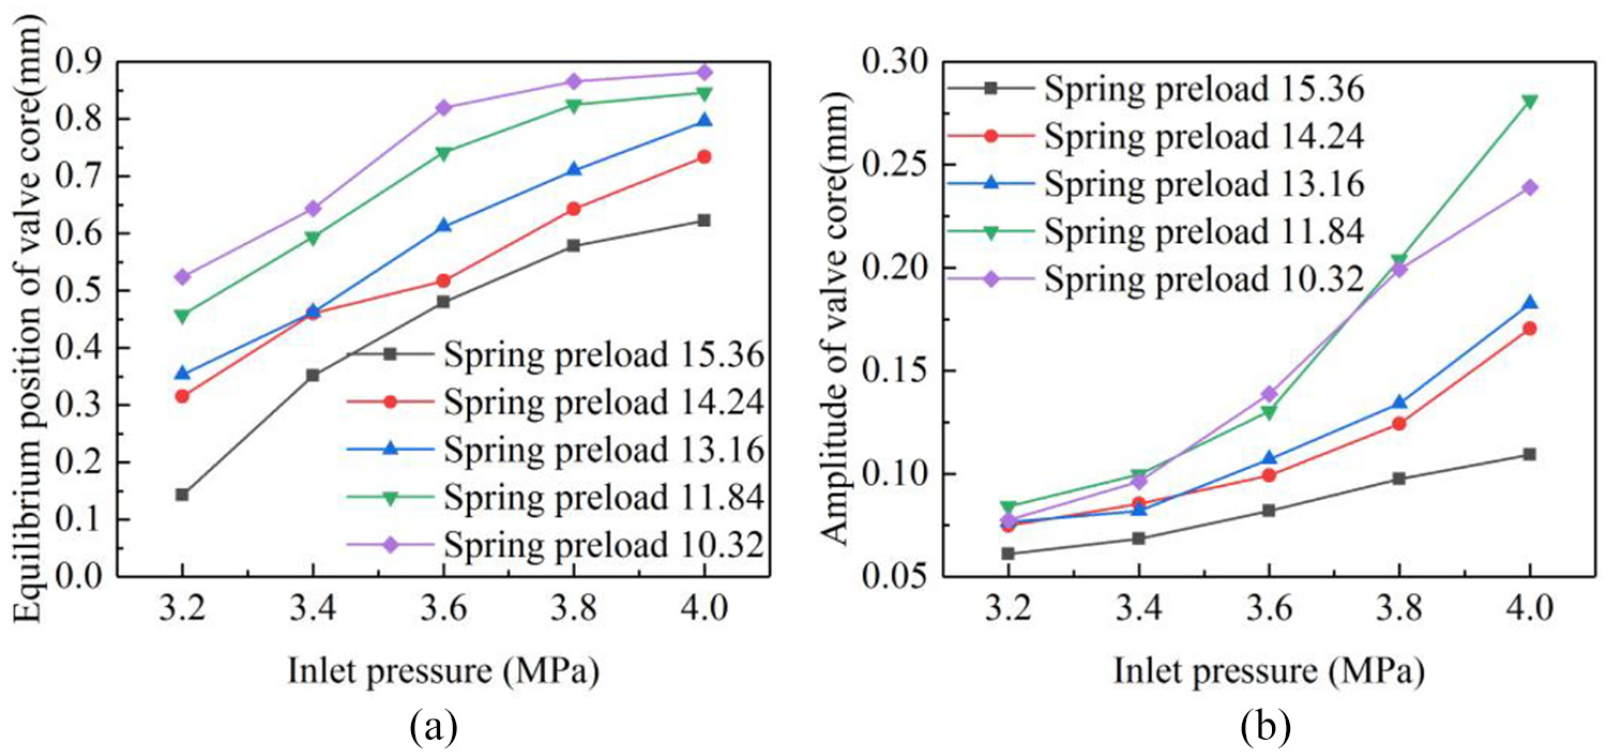
The influence of inlet pressure and pre-compression of the spring on (a) the equilibrium position of the valve core; (b) the amplitude of vibration signal.
On the other hand, the effects of inlet pressure and pre-compression of the spring on the frequency characteristics of valve core vibration are also studied. Figure 9 is the influence of inlet pressure on the frequency spectrum of vibration signal, while the pre-compression of the spring is 15.36 mm. Figure 10 is the influence of pre-compression of the spring on the frequency spectrum of vibration signal, while the inlet pressure remains at 3.2 MPa. The results show that the vibration of valve core under different conditions has similar spectrum characteristics. There is a very obvious signal peak near 220 Hz, and there are two higher harmonics near 440 and 880 Hz. The signal peak value near 220 Hz increases first and then decreases with the increase in inlet pressure and pre-compression of the spring. However, the peak value of the second and third harmonic decreases with the increase in the inlet pressure, and increases with the increase in pre-compression of the spring. In addition, the frequency of pressure fluctuation of hydraulic system can be calculated by the parameters of gear pump and motor in the hydraulic system. And the frequency of pressure fluctuation of hydraulic system fluid is also 220 Hz. Therefore, we consider that the axial vibration of the valve core is mainly caused by the fluctuation of the hydraulic system oil pressure. Furthermore, there is a signal peak in the low frequency part (less than 60 Hz). The intensity of this signal peak decreases first and then increases with the increase in inlet pressure and increases first and then decreases with the increase in spring and compression. We think it is the low frequency vibration caused by the turbulent flow of fluid.

The influence of inlet pressure on the frequency spectrum of vibration signal.

The influence of pre-compression of the spring on the frequency spectrum of vibration signal.
Conclusion
The vibration characteristic of the valve core is very important factors which influence the safe and stable operation of the hydraulic system. The vibration sequence of valve core in a transparent hydraulic valve is obtained by a high-speed camera in our article. The least squares method of image-processing method is proposed, which could reduce some noises in an image sequence and obtain the profile of the valve core accurately with different vibration signals. The SNR and the variance using the least squares method proposed in our article are obviously better than the traditional edge detection method, so the accuracy of data extraction is improved greatly. Furthermore, the vibration of the cone valve core is periodic signals. The behavior of a core vibration under different inlet pressure and different the spring stiffness is also discussed in this paper. The greater the inlet pressure and the smaller the pre-compression of the spring, the greater the equilibrium position and amplitude of valve core vibration. In the frequency spectrum of valve core vibration signal, it is mainly composed of vibration signal spectrum caused by hydraulic system oil pressure fluctuation and vibration signal spectrum caused by fluid turbulence.
Footnotes
Handling Editor: James Baldwin
Declaration of conflicting interests
The author(s) declared no potential conflicts of interest with respect to the research, authorship, and/or publication of this article.
Funding
The author(s) disclosed receipt of the following financial support for the research, authorship, and/or publication of this article: The work is supported by the Fundamental Research Funds for the Central Universities (Grant No. 2015XKMS024), the National Natural Science Foundation of China (Grant No. 51875559), and the Priority Academic Program Development of Jiangsu Higher Education Institutions (PAPD).