
Abstract
Synchronous hydraulic motors are used in high load conditions. Therefore, the failure of such motors must be promptly detected to avoid severe accidents and economic loss. The automation of signal processing and diagnostic processes in practical engineering applications can help improve engineering efficiency and reduce hazards. As a non-contact acquisition signal, an acoustic signal has easier acquisition than a vibration signal. This article proposes an automatic fault detection method for synchronous hydraulic motors, which uses acoustic signals. The proposed method includes the automatic calculation and pattern recognition of the parameters of fault feature vectors. The automatic calculation of the fault feature vector is based on the combination of wavelet packet energy and the Pearson correlation coefficient. Then, the nearest-neighbor classifier is used for fault diagnosis. This study verifies that the proposed method can effectively identify the normal state, gear wear, gear rust, and barrier block wear. This method provides a solution for the automatic fault diagnosis of synchronous hydraulic motors and other types of quasi-period rotating machinery.
Keywords
Introduction
Synchronous hydraulic motors are widely used in large-load, multi-cylinder hydraulic synchronization systems to provide pressure and flow to power components. Given that synchronous hydraulic motors typically operate under heavy loads and harsh conditions, their failure can result in economic loss or even serious safety incidents. Thus, fault diagnosis of synchronous hydraulic motors is urgently needed.
At present, many types of signal sources are used for the diagnosis of rotating mechanical fault signals, such as vibration signals, thermal imaging signals, 1 and acoustic signals. Vibration signal-based analysis is one of the most widely used methods for the diagnosis of rotating machinery faults because of its high signal-to-noise ratio, clear physical meaning, low cost, instant measurement, and easy identification. 2 The vibration sensor needs to be installed tightly on the surface of the equipment. However, when the equipment is placed under conditions with high temperature, humidity, corrosion, and toxicity, the vibration sensor is difficult to install.3–5 A considerable amount of literature has used thermal imaging to diagnose faults,6–8 as the measurement of thermal images is instantaneous and non-invasive. Thermal image analysis has a good fault diagnosis effect. However, the heating of the device and the processing of the thermal image take a long time. 5 As a type of mechanical wave, sound contains important information about the running state of the machine. It can monitor and diagnose the equipment through acoustic signals when the machine is running. The acoustic sensors are low cost and non-contact; their signals can be collected instantly, and they do not affect the normal operation of the equipment.3,5,9 Therefore, scholars should formulate an effective and feasible method on the basis of acoustic signals for diagnosing synchronous hydraulic motor faults.
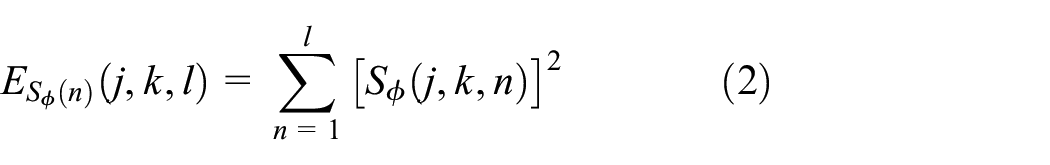
At present, many analysis methods for fault feature extraction have been applied to the diagnosis of rotational machinery fault, such as Dislocation Superimposed Method (DSM), Empirical Mode Decomposition (EMD), Shortened Method of Frequencies Selection (SMOFS), Method of Selection of Amplitudes of Frequency (MSAF), and Wavelet Transform (WT). Although the above methods are widely used in the diagnosis of rotating machinery, all these processes have limitations. For example, DSM needs to know the exact real-time operating cycle of rotating machinery.3,10 The SMOFS and MSAF methods require a prior determination of the selected parameters and the number of groups.5,11 EMD is often affected by boundary effects.12,13 WT only decomposes the low-frequency part and cannot handle signals containing high-frequency fault information. 14 Wavelet packet transform decomposes the low-frequency part and the high-frequency component. It can efficiently perform time–frequency localization analysis on signals containing a large amount of medium- and high-frequency information, such as non-stationary mechanical vibration signals.15–19 Wavelet packet energy (WPE) can reveal the energy distribution information of the signals in each time–frequency subspace and highlight the energy concentration subspace. When a fault occurs, the energy of the acoustic signal associated with the failure increases and concentrates in a specific frequency band. 20 Therefore, the wavelet packet decomposition and the partitioning of the value distribution of time–frequency subspace energy can be used to indicate signal characteristics. Some works describe the application of WPE in the field of fault diagnosis.21–25 Although WPE is a valid feature vector, it needs to determine the wavelet packet decomposition layer and the actual period length of the signal artificially.
The automation of the signal processing process can increase the industrial applicability of the algorithm. To realize the fault diagnosis of synchronous hydraulic motor, an automatic fault diagnosis method is proposed. This method uses the acoustic signal.
WPE feature vector and the Pearson correlation coefficient review
Wavelet packet decomposition with a frequency scale of 2
j
is called the jth layer decomposition.

where
where

where

where <·> is the inner product. According to Cauchy–Schwarz inequality,
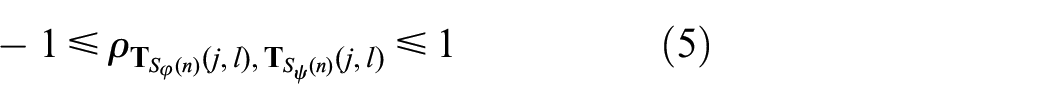
The closer the value of
Proposed method for fault diagnosis
Acoustic signal analysis is used for the automatic extraction of the fault characteristics of synchronous hydraulic motors and pattern recognition (fault classification). The automatic selection of three parameters includes the optimal sampling frequency f opt , the optimal wavelet packet decomposition layer j opt , and the optimal acoustic signal segment length l opt . The classifier uses the nearest-neighbor (NN) classifier. The flowchart is shown in Figure 1.

Flowchart of proposed diagnosis method for synchronous hydraulic motor fault.
First, the sound signal is transmitted to a PC through a data acquisition card by using an acoustic sensor, and the sampling frequency is the preset value ftest. The designed algorithm automatically calculates the f
opt
. The acquired signal is intercepted with the length
Parameter automatic selection algorithm
When the Pearson correlation coefficient of the two vectors is larger, their linear dependence is stronger. Higher recognition accuracy is expected when the difference in the Pearson correlation coefficient is greater among the different types of operating state feature vectors of the synchronous hydraulic motor. Therefore, the mathematical model of the automatic selection of the key parameters is established according to the difference value of the Pearson correlation coefficient among different state feature vectors. The parameter automatic selection process is shown in Figure 2. The specific details are described as follows.

Flowchart of parameter automatic selection process.
Step 1. The original acoustic signal Sϕ(n) is loaded. According to the Wang et al.
25
study, the wavelet packet uses db4.

According to the Shannon sampling theorem, f opt should satisfy the following formula

The automatic calculation expression of f opt can be obtained from equation (8)

Step 2. The synchronous hydraulic motor is disturbed during the operation due to flow fluctuations. The rotation period of the gear constantly changes. When l is small, the WPE distribution of the acoustic signal segment varies greatly with l. As l increases, the WPE distribution tends to be stable. To ensure the reasonableness of the value of j, l is first set to a larger value

where
Step 3. To initialize j, the formula j = jmin is set. The range of the values of j is denoted as P ={jmin: Δj: jmax}. When the value of j is too large or too small, the feature vector difference of different state acoustic signals is reduced. Therefore, to improve the time efficiency of the calculation, the range of the values of j is limited as follows (the rationality of the value is explained in the “Acoustic signal analysis” section)

where jmin, Δj, and jmax are the lower limit values of P, the change step size of j, and the upper limit value of P, respectively. The set of the types of synchronous hydraulic motor operating state is denoted as Δ

Calculate D(j) as follows: when the number of wavelet packet decomposition layers is j, all possible synchronous hydraulic motor operating states are scanned to find the minimum value of

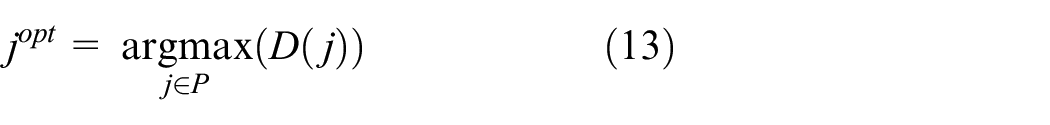
where min(A) is the minimum value in variable A. SX(n + τ) represents a hysteresis of length τ from the starting position of the signal SX(n). When D(j) is larger, the difference between the types of feature vectors is more evident, and higher recognition accuracy is expected. j opt is determined by the following formula
Step 4. Under the condition that jopt has determined, F(l) is calculated. When the length of the signal segment is l, all possible operating states of the synchronous hydraulic motor are scanned to find the minimum value of

To reduce the error caused by the l fluctuation of the WPE distribution, a second-order exponential fitting for F(l) is used (through experiment). The second-order exponential base function is as follows

As l increases, the difference of the feature vector that corresponds to different states becomes larger, thus benefiting the improvement of the accuracy but reducing time efficiency. To balance the relationship between difference and time efficiency, l opt is determined by

NN classifier
The NN classifier is a well-known classifier, and numerous papers’ fault diagnosis have depended on it.26–31 It is a powerful multi-function classifier with simple function implementation and high recognition accuracy for multi-state recognition problems. Besides signal processing and data classification, it is also used in the following applications: image processing, text recognition, genomic data analysis, and economics. The NN adopts a supervised learning method, such as training using feature vectors, which are subsequently used for the prediction phase. The classifier compares the whole set of test feature vectors to the training feature vectors using the selected distance function. The test feature vectors are classified as the class of the closest training vector. NN classifies feature vectors using similar distances, such as Manhattan, Euclidean, Minkowski, Cosine, Jaccard, and Chebyshev. Given that the results obtained using other similar distances are similar, the author uses the Manhattan distance (equation (17)) for the classification of feature vectors. The Manhattan distance is presented as
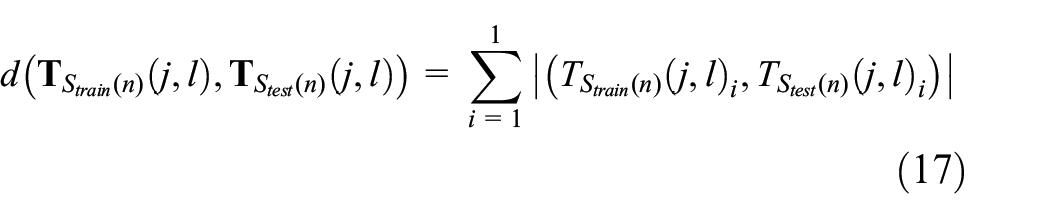
where the test vector
Test equipment
Figure 3 shows the test bench of the synchronous hydraulic motor. The data acquisition system consists of a sound sensor, a data acquisition card, and a computer. An acoustic sensor with a polyurethane enclosure is placed next to the synchronous hydraulic motor (non-contact) to receive an abnormal acoustic signal generated by the synchronous hydraulic motor. The data acquisition card model is USB-6341, manufactured by National Instruments Company. Data acquisition and processing are conducted using MATLAB. A schematic of the hydraulic system is shown in Figure 4. The parameters of the synchronous hydraulic motor are shown in Table 1.

Synchronous hydraulic motor test bench: 1—pressure gauge, 2—directional valve and relief valve assembly, 3—fuel tank, 4—flow meter, 5—synchronous hydraulic motor, 6—acoustic sensor, 7—data acquisition card, 8—computer.

Schematic of the hydraulic system: 1—fuel tank, 2—filter, 3—quantitative pump, 4—relief valve, 5—pressure gauge, 6—manual reversing valve, 7—one-way throttle valve, 8—flow meter, 9—synchronous hydraulic motor, 10—relief valve, 11—pressure gauge, 12—relief valve.
Synchronous hydraulic motor parameters.

Three types of fault samples, namely, gear wear, gear rust, and end barrier block wear, are produced for the synchronous hydraulic motor. The physical diagram is shown in Figure 5.

Fault modes: (a) gear wear, (b) gear rusted, and (c) barrier block wear.
The soundproof cover of the sound sensor is made of polyurethane rigid foam with an improved sound absorption effect to reduce the interference of external noise. According to a previous study, 33 the thickness of the material used is 3.5 cm, and the acoustic propagation loss is up to 33 dB when the external signal frequency is less than 5000 Hz. The sensor and sound insulation materials are shown in Figure 6.

Acoustic sensor and sound noise reduction material.
Acoustic signal analysis
To test the feasibility of the proposed method, acoustic signals are collected from a synchronous hydraulic motor test rig. The following describes the specific process of obtaining f opt , j opt , and l opt , and the classification result of the NN classifier.
Determining the optimal sampling frequency
The acoustic signal collected under the conditions of POUT = 6 MPa, ftest = 20 kHz, and jtest = 6 is taken as an example to start the selection process of f opt . POUT is the hydraulic motor outlet pressure. The acoustic signal waveforms of the four states are shown in Figure 7.

Acoustic signal waveforms of four states: gear wear, gear rusted, barrier block wear, and normal state of a synchronous hydraulic motor at POUT = 6 MPa and ftest = 20 kHz.
At this time, the synchronous hydraulic motor has a rotational speed n0 of approximately 14.286 cps. The WPE distribution of the four states is shown in Figure 8.

POUT = 6 MPa, ftest = 20 kHz, jtest = 6; the acoustic signals in four states of synchronous hydraulic motor (gear wear, gear rust, end cap wear, and normal state) energy distribution. The number k on the horizontal abscissa indicates the kth subspace frequency scale.
According to equation (8), the optimal sampling rate f opt of the acoustic signal is 5 kHz.
Determining the optimal decomposition layer of the wavelet packet
The process of selecting j
opt
is preset by setting
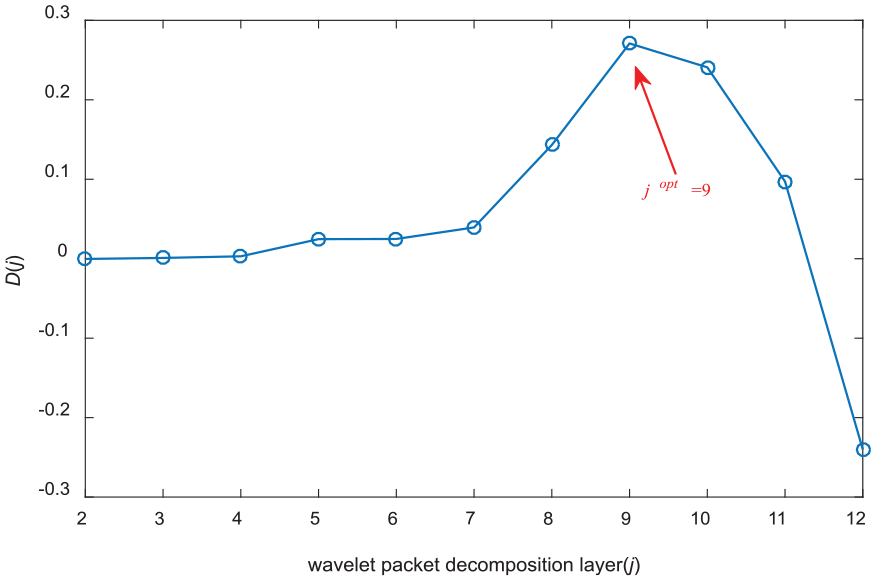
POUT = 6 MPa, f
opt
= 5 kHz, and
According to equation (13), j opt = 9. The value of j opt = 9 is within the range of P, which meets the setting of equation (10).
Determining the optimal length of each segment
Under the condition of j opt = 9, l is changed to obtain curve F(l) and its second-order exponential fitting curve f(l), as shown in Figure 10.

POUT = 6 MPa, f opt = 5 kHz, and j opt = 9; f(l) and F(l) curves with variable l.
To balance the relationship between the fault feature effect and the intercept length, the curve of f(l)/l is obtained, as shown in Figure 11.

POUT = 6 MPa, f opt = 5 kHz, and j opt = 9; f(l)/l curves with variable l.
According to equation (16), l
opt
= 71,750 is obtained, corresponding to α0 = 205. In this article,
Classification
To test the accuracy of the obtained parameter values, the acoustic signals of the four states of the synchronous hydraulic motor are collected: synchronous hydraulic motor gear wear, synchronous hydraulic motor gear rusted, synchronous hydraulic motor barrier block wear, and synchronous hydraulic motor normal operation. The synchronous hydraulic motor and acoustic signal acquisition and processing parameters are shown in Table 2.
Test parameters.

The authors use 20 feature vectors for pattern creation and 200 feature vectors for testing (predictive parts). The training data and test data are automatically extracted using the proposed method. The following formula represents the acoustic signal accuracy

where ADA is the diagnostic accuracy of the selected category of acoustic signals. The number of NP denotes the test sections of acoustic signals to determine the correct amount. NA represents the total number of parts of the acoustic signal test.
The average diagnostic accuracy is as follows

where TADA is the average recognition accuracy, ADA1 is the diagnostic accuracy in the gear wear state of the synchronous motor, ADA2 is the diagnostic accuracy in the gear rusted state of the synchronous motor, ADA3 is the diagnostic accuracy in the barrier block wear state of the synchronous motor, and ADA4 is the diagnostic accuracy in the healthy state of the synchronous motor.
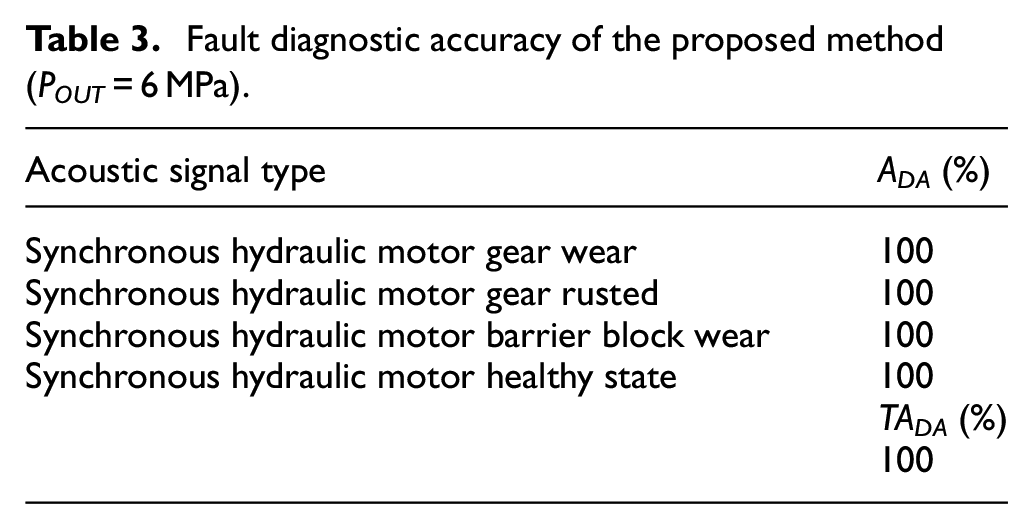
Table 3 shows the accuracy result of the proposed method when POUT = 6 MPa.
Fault diagnostic accuracy of the proposed method (POUT = 6 MPa).
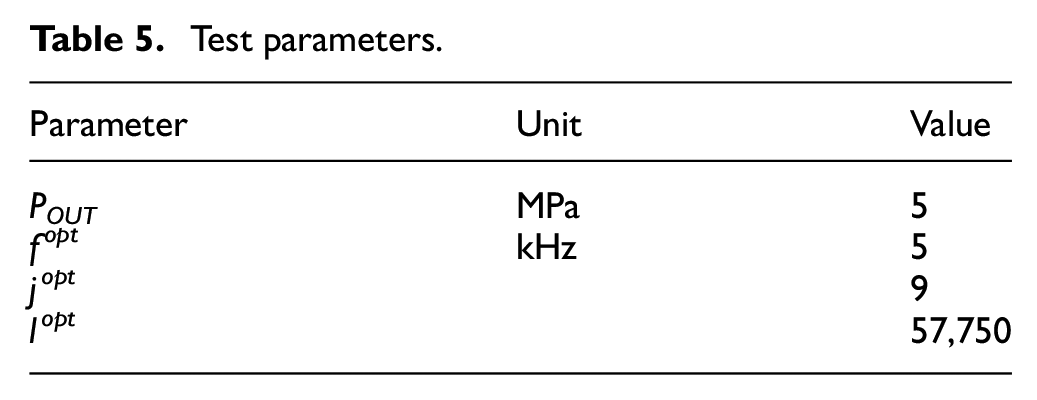
The synchronous hydraulic motor outlet pressure is changed to 4 and 5 MPa using the proposed algorithm to calculate the parameters automatically, as shown in Tables 4 and 5.
Test parameters.

Test parameters.
The accuracy results of pattern recognition using the NN classifier are shown in Tables 6 and 7 (under the parameters of Tables 4 and 5).
The result of identifying the acoustic signal using the proposed method and nearest-neighbor classifier (POUT = 4 MPa).

The result of identifying the acoustic signal using the proposed method and nearest-neighbor classifier (POUT = 5 MPa).
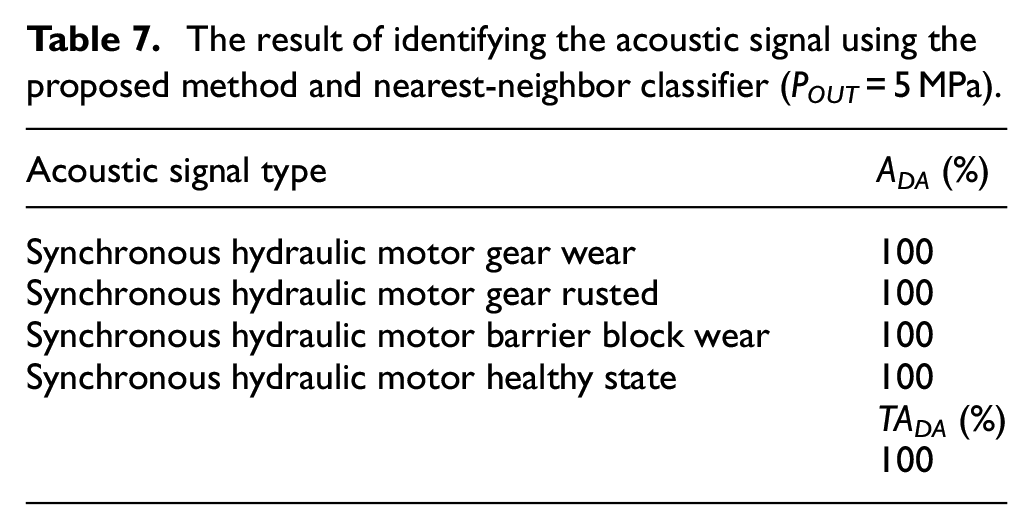
The analysis has excellent results: TADA is 100% in all three cases. The automatic extraction method of the WPE fault feature parameter is used to obtain the optimal sampling frequency, the number of wavelet packet decomposition layers, and the length of the acoustic signal segment. The NN classifier is used to train and predict the feature vectors of each of its signals. The proposed method is reliable and valid for automatic extraction and the identification of the fault characteristic parameters of the acoustic signals of synchronous hydraulic motors.
Influence of noise on recognition results
When the noise is too large, the recognition accuracy of the acoustic signal decreases. To explore the relationship between the noise and the accuracy of the method proposed in this article, the synchronous hydraulic motor is rotated manually in a quiet environment. Then, the acoustic signals under different fault conditions, which are called high signal-to-noise (SNR) ratio signals, are collected. The noise with different SNR is added to the high SNR signal as the original signal. In this article, a high SNR signal is produced at the same speed as the outlet pressure of 5 MPa. The relationship between the average recognition accuracy of the acoustic signal of the synchronous hydraulic motor and the SNR is shown in Figure 12.

The relationship between the average recognition accuracy of the acoustic signal of the synchronous hydraulic motor and the SNR of the original acoustic signal.
According to the test results, the average recognition accuracy can reach 100% when the SNR is greater than 4 dB. When the SNR is greater than −9 dB, the average recognition accuracy is greater than 90%. When the SNR is less than −13 dB, the average recognition accuracy is less than 85%. Therefore, the recognition accuracy of the method proposed in this article is affected by noise. To ensure at least 90% of the recognition accuracy, the method is suitable for applications where the SNR is greater than −9 dB.
Comparison with another method
To verify the effectiveness of the proposed method further, SMOFS-22-MULTIEXPANDED method is used to extract the acoustic signal features and compare the recognition results. The classifier type and parameter settings used in the fault recognition part are unchanged. The value of TCFC-MULTI in SMOFS-22-MULTIEXPANDED method is 0.25, and other parameters are the same as those in Glowacz. 5 Under different synchronous hydraulic motor outlet pressures, the recognition results are shown in Tables 8–10.
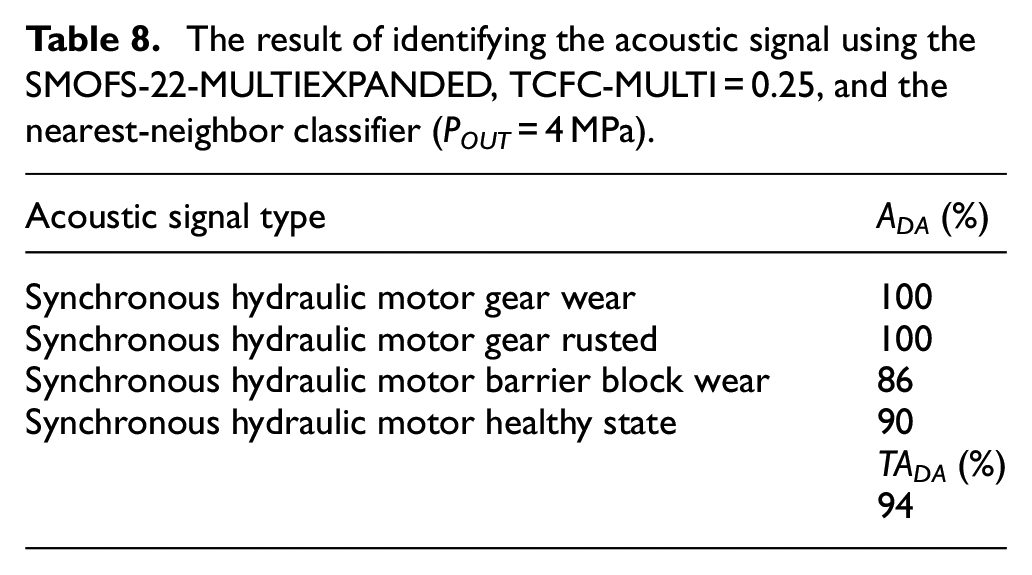
The result of identifying the acoustic signal using the SMOFS-22-MULTIEXPANDED, TCFC-MULTI = 0.25, and the nearest-neighbor classifier (POUT = 4 MPa).
The result of identifying the acoustic signal using the SMOFS-22-MULTIEXPANDED, TCFC-MULTI = 0.25, and the nearest-neighbor classifier (POUT = 5 MPa).

The result of identifying the acoustic signal using the SMOFS-22-MULTIEXPANDED, TCFC-MULTI = 0.25, and the nearest-neighbor classifier (POUT = 6 MPa).

SMOFS-22-MULTIEXPANDED method has a high recognition accuracy (93%–94.25%). However, its accuracy is lower than that of the method proposed in this article. Thus, the method proposed in this article can diagnose the acoustic signals of synchronous hydraulic motors more effectively. To verify the applicability of the proposed method, the signals of more types of rotating machinery should be analyzed.
Conclusion
In this article, the authors describe the automatic calculation and fault identification method for the fault vector parameters of the synchronous hydraulic motor. The proposed method uses acoustic signals. The authors analyzed the acoustic signals of the four states of the synchronous hydraulic motor: gear wear, gear rusted, barrier block wear, and regular operation. The automatic sampling method based on WPE and the Pearson correlation coefficient is used to determine the optimal sampling frequency, decomposition layer of the wavelet packet, and the length of the acoustic signal segment. For the classification step, the NN classifier is used. The analysis obtained is excellent (the average recognition accuracy of the three different export pressures is 100%). The measurement of acoustic signals is instantaneous and non-invasive. Moreover, the information provided by the acoustic signal allows us to inspect and repair quickly. The proposed signal processing method can be applied to the automatic fault diagnosis of rotating machinery. However, the acoustic signal section in this method is too long, and the calculation efficiency is low.
In the future, we will research the actual-cycle length-finding method of non-constant-cycle rotating machinery, which can significantly improve the computational efficiency and real-time performance of the proposed method.
Footnotes
Handling Editor: Tadeh Zirakian
Declaration of conflicting interests
The author(s) declared no potential conflicts of interest with respect to the research, authorship, and/or publication of this article.
Funding
The author(s) disclosed receipt of the following financial support for the research, authorship, and/or publication of this article: This work was financially supported by the National Key Research and Development Program (Nos 2018YFC0810404 and 2018YFC0810406), the Fundamental Research Funds for the Central Universities (No. 3132019118), and Open Foundation of the State Key Laboratory of Fluid Power and Mechatronic Systems (No. GZKF-201810).