
Abstract
The Thomson coil actuator has an important application prospect in direct current high-speed switch due to its short respond time and fast operation speed. However, the large electromagnetic impact force during the opening process may bring the stress deformation of movable components and thus cause damage to the mechanism. Therefore, the dynamic stress and strain evaluation of the moving parts is very important for the design and optimization of direct current high-speed switch. In this article, a novel method of structure strength analysis based on the flexible body theory is established for direct current high-speed switch. The electromagnetic and buffer forces in the rapid opening process are calculated, and then the stress and strain distribution of the key components are obtained. Finally, the strain test circuit of the key components is built. By comparing the simulation and experimental results of dynamic strain, the validity of the established simulation model is verified.
Introduction
With the rapid development of modern interconnection power grids, an increasing demand for high-speed switches (HSSs) appears, especially in medium and high voltage direct current (DC) systems.1–4 In order to acquire an ultra-fast actuator functionality in mechanical switching mechanisms, Thomson coil (TC) is usually a suitable choice to be employed with the capability of exerting massive forces in extremely short time.5–9 Figure 1 provides the work principle of TC actuator. When a pulse current iC is injected from an external source into TC, the magnetic field B is induced and the magnetic field lines across the metal plate create concentric eddy currents ip flowing in opposite direction. Then, a huge electromagnetic repulsion force is generated between TC and metal plate, which will accelerate the metal plate separating from TC.

The work principle of Thomson coil actuator.
During the past decade, numerous research has been done on TC actuator. For example, S. Basu and K.D. Srivastava10,11 proposed a simple theoretical analysis of electromagnetic force and eddy current in the actuator based on the equivalent inductance, in which all magnetic flux of the coil is treated as passing through the metal plate without leakage. W. Li et al.12,13 developed an equivalent circuit model to analyze the dynamic characteristics of actuator by dividing the metal plate into multi segments. However, the calculation accuracy of this method seriously relies on the number of segments. Also, there have been contributions to the investigation into repulsion mechanism with finite element method.14,15
However, the above research has been mainly focused on the solution of motion characteristics of HSS, in which the structure strength analysis of movable components in opening process is not involved. Considering that the TC actuator generates a large electromagnetic force during the moving process, its key components such as the metal plate, the connecting rod, and the insulation rod will suffer severe shocks, which may cause deforming of these components. Therefore, the dynamic structure strength analysis should be focused on in order to clarify the dynamic stress distribution on the components in the fast opening process, which provides the key basis for the design and optimization of the actuator. Right now, there have been some investigations on structure strength analysis for the movable parts of TC actuator, which mainly applies a static force on the movable components to evaluate the stress and strain at different positions.15,16 Besides, this static force is mainly based on the peak value of the electromagnetic force. However, the mass and acceleration of the movable components are diverse in the acceleration, which results in differences in the forces suffered at different positions. Therefore, it is unreasonable to evaluate the component stress and strain by applying static force.
Based on the developed HSS in our previous research work, 17 as shown in Figure 2, this article proposes a novel method for the structural strength analysis of HSS based on flexible body theory. In section “Numerical model,” a description of the numerical model, including the governing equations of flexible body theory, the transient dynamic equations, and the application of distributed load, is presented. The calculated results including the pressure drag, the stress, and strain distribution of movable parts during opening process are discussed in section “Simulation results and analysis.” The experiment variation of dynamic stress and strain is presented in section “Experimental variation.” Finally, concluding remarks are drawn in section “Conclusion.”

The developed HSS with Thomson coil adopted.
Numerical model
In this section, the governing equations for the dynamic stress and strain calculation, the geometric model, and the load application method will be introduced in detail.
Governing equations for dynamic stress and strain calculation
Basic equation of flexible body system
Since the relative position of each node in the flexible body system keeps changing all the time, it is hard to describe accurately the position of the flexible body in the inertial coordinate system just by relying on the moving coordinate system. Consequently, it is necessary to introduce the elastic coordinate system in order to describe the deformation of each node in the flexible body relative to the coordinate system. In this case, the movement of each node in the flexible body is the synthetic of rigid motion in the moving coordinate system and elastic deformation. Figure 3 presents the coordinate system of the flexible body, including the inertial coordinate system (er) and moving coordinate system (eb). The former does not change with time, and the latter is built to describe the movement of flexible body. Also, the moving coordinate system can realize limited movement and rotation with respect to the inertial coordinate system.
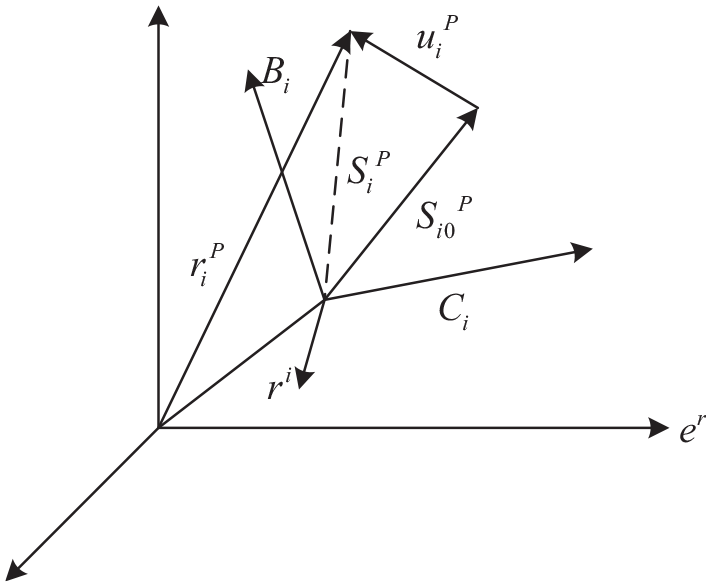
Position of the nodes in flexible body.
Due to the relative motion between the nodes in the flexible body, the floating coordinate system that changes with the deformation of flexible body is required. For any point P in the flexible body, its position vector is

where
The velocity vector and acceleration vector of each point in the flexible body can be obtained by taking the first and second derivatives with respect to time for equation (1), respectively


where
Transient dynamic equations
For the established flexible body system, transient dynamics analysis is used to determine the dynamic response of the movable components under time-varying loads. The transient motion equation is derived from the following Lagrange equations

where
Taking the obtained

where
Distributed load application
The applied loads include three parts: single point force and torque, distributed load, and residual load. Due to the uneven distribution of eddy current inside the metal plate during the actual opening process, the force at each internal point is greatly different. Thereby, it is not an appropriate way to apply a concentrated force as the load on metal plate. In order to accurately describe the force suffered by the metal plate, the plate must be divided to establish the distribution force. The motion equation of flexible body in the finite element analysis software is given by

where
Using the modal matrix

Equation (7) can be simplified as

where
The projection of the nodal force vector on the modal coordinates is

Assuming that the spatial and temporal dependences can be separated in equation (10), the load

If a series of static loads are defined as load vector and explicitly correlated to the system response, the modal force can be expressed as

As shown in Figure 4, since the electromagnetic force on the metal plate is mainly concentrated within the depth of 6 mm under the surface of metal plate, this depth range is divided into 3 layers × 6 columns. In this case, the force applied to each zone (f1, f2, f3, …, f18) can be extracted by dynamic calculation, respectively.
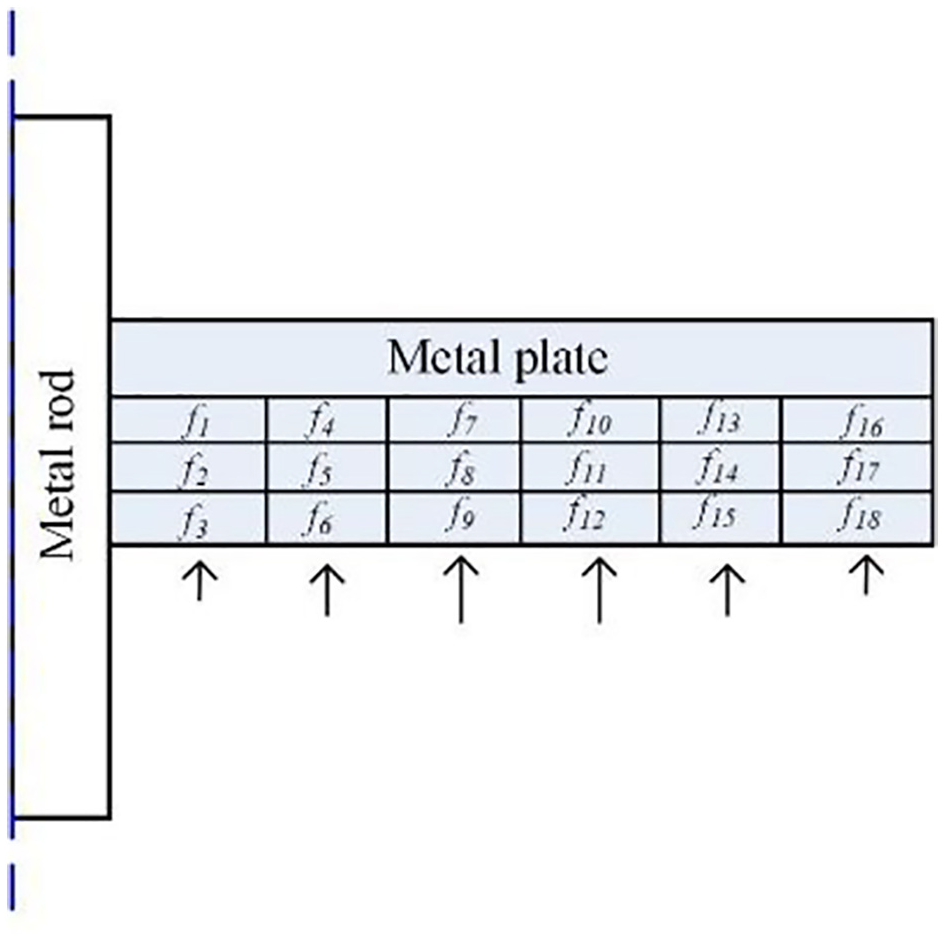
Electromagnetic force distribution on metal plate.
Model establishment
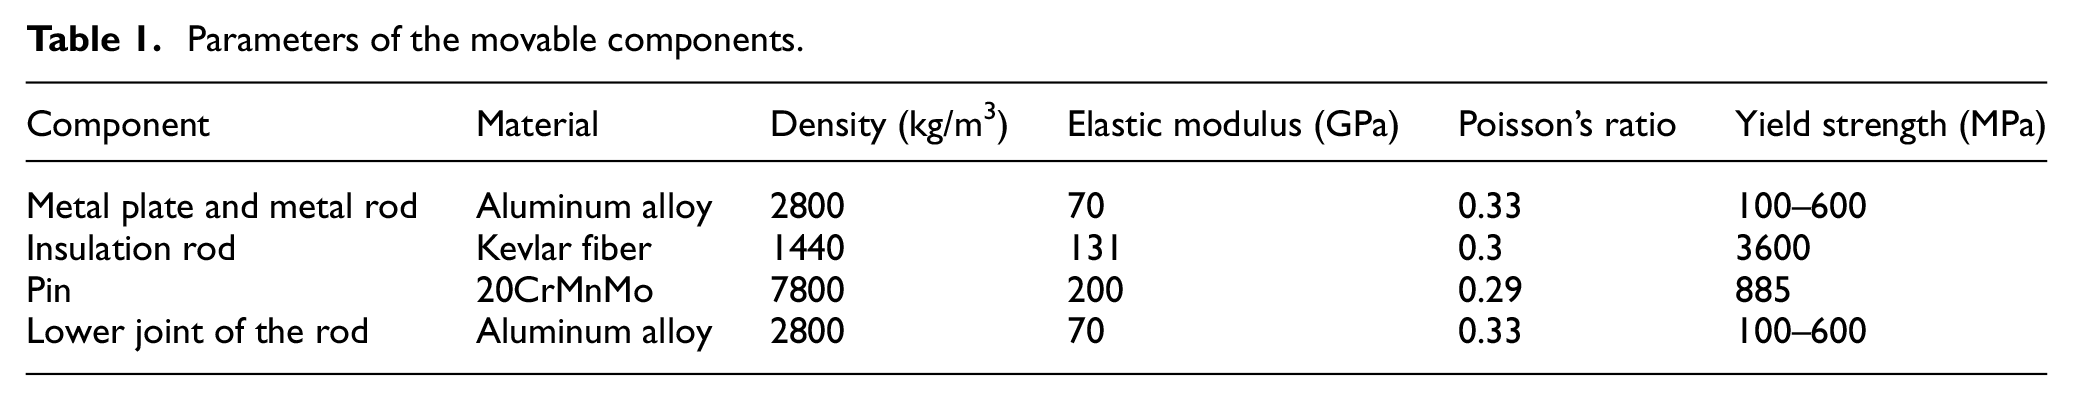
In the simulation, all the movable components are treated as flexible bodies in order to analyze the dynamic stresses during the opening process. The other parts that closely connect to movable components are regarded as rigid bodies. The geometric model of movable components is presented in Figure 5, mainly including metal plate, metal rod, pin, insulation rod, and contact. Table 1 presents the materials and their parameters of the movable components.

Geometric model of the movable components. (a) The schematic diagram of movable components. (b) Sectional view of the connection part.
Parameters of the movable components.
The flexible body for HSS is built based on the FLEX method, in which ANSYS is used to discretize the geometric model into small meshes for modal calculations. The calculated modals are saved as a neutral file MNF (Modal Neutral File), which is directly read into ADAMS to create a flexible body. The modeling process of the dynamic stress calculation can be divided into three stages as follows:
In the first stage, a three-dimensional (3D) geometric model from UG is imported into ANSYS in order to generate a modal neutral file named .MNF file.
In the second stage, the distributed load of the metal plate that changes with time is established on the DOC platform.
In the third stage, the mechanical dynamics process is calculated based on ADAMS with the stress and strain results exported at different times.
The modeling and calculation process are given in Figure 6.

Modeling and calculation process.
Simulation results and analysis
Calculation of motion characteristics
The parameters used in dynamic motion calculation are provided in Table 2. The time step size is set to 5 μs.
The parameters used in the calculation.
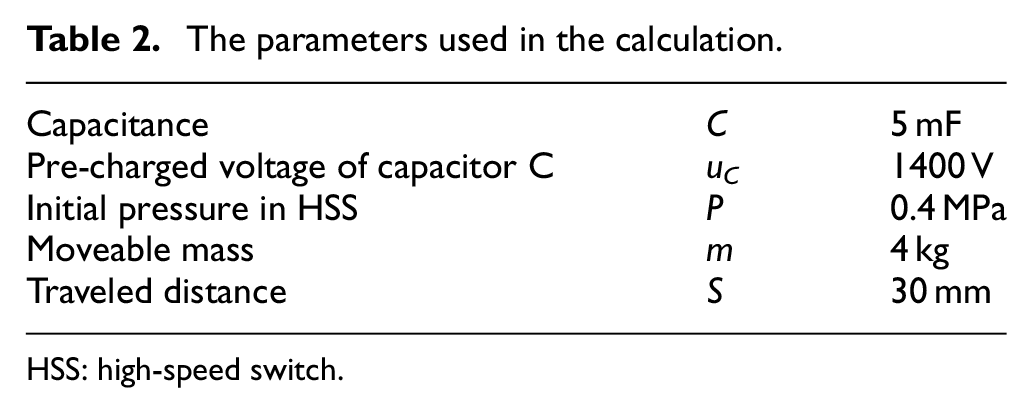
HSS: high-speed switch.
Figure 7 shows the calculated results of electromagnetic repulsion force, pressure drag, speed, and displacement of metal plate during the opening process. As can be seen in Figure 7(a), with the electromagnetic repulsion force increasing in the initial period, the metal plate is driven to separate from TC at about 0.25 ms. And at the same time, the pressure drag starts to increase from zero. When TC current reaches its peak, the electromagnetic force tends to drop fast. The pressure drag equals to the electromagnetic force at 1.05 ms with its corresponding highest speeds of 13.7 m/s. Afterward, as the metal plate continues to move forward, the pressure drag exceeds the electromagnetic force and the moving speed of metal plate begins to decrease due to the damp effect of pressure drag. Figure 7(b) shows the total pressure drag, pressure drags at high-pressure side and low-pressure side. During the initial period, the pressure drags at high-pressure side and low-pressure side both increase due to the accelerated motion of metal plate. However, the pressure drag at low-pressure side rises faster than high-pressure side and dominates the total pressure drag until about 1.8 ms, which results from that the pressure between the metal plate and TC is far lower than the initial pressure. After 1.8 ms, the pressure drag at high-pressure side continues to rise due to the sustained gas compression. And the pressure drag at low-pressure side all starts to drop, which attributes to that the gas flow from high-pressure side is continuously supplemented into the low-pressure side.

The calculated results during the opening process (a) the electromagnetic repulsion force, pressure drag, speed and displacement and (b) the pressure drag at both sides of metal plate.
Analysis of the stress and strain distribution of movable parts
From the calculated results of the dynamic characteristics of the actuator, it can be found that the electromagnetic repulsion force for driving the actuator to open in the early stage is much higher than the pressure drag for buffer. Therefore, the key factor for determining whether the structure strength of the actuator can meet the requirement is the peak value of electromagnetic repulsion force. Figure 8 provides the change in maximum stress over time for different components in the initial 1.5 ms. It can be seen that the maximum stress of different components all rises rapidly with the capacitor discharging, reaching their maximum at about 0.38 ms, which indicates that the electromagnetic force reaches a peak at this moment. After 0.38 ms, the maximum stress drops quickly, which is mainly due to the rapid drop of electromagnetic repulsion force. Among the different components, the peak stress of pin is much higher than other components with peak value of 781 MPa, which is mainly attributes to that the pin acts as the key component for connecting the actuator and the contact system. As a connection part between the metal plate and the pin, the metal rod receives a dynamic stress of approximately 45% of the pin and its maximum stress reaches 358 MPa. Besides, for the metal plate and the insulating rod, the dynamic stress during the opening process is relatively small, with the maximum stress of about 177 and 99 MPa, respectively.

Maximum stress versus time of different components.
Figure 9 illustrates the stress distribution on the metal plate at 0.38 ms. As it can be seen, the stress of the metal plate is concentrated on the connection position between the plate and the metal rod. The maximum stress on the upper surface and on the lower surface of the metal plate is 177 and 138 MPa, respectively. Furthermore, the magnitude of the stress gradually decreases outward along the radial direction of the plate. The region of the metal plate with stress exceeding 100 and 150 MPa is close to 30% and 5% of the total volume of the metal plate, respectively.

Stress distribution on the metal plate: (a) stress distribution on the upper surface and (b) stress distribution on the lower surface.
Generally, in order to reduce the quality of the movable parts, the aluminum is used for the metal plate. However, considering that the yield strength of pure aluminum is only about 100 MPa, it is necessary to use the hard aluminum alloy with higher yield strength. Figure 10 shows the deformation of the metal plate with pure aluminum used. It can be seen that the edge of the metal plate is bent downward with huge electromagnetic force applied. In order to improve the structure strength of the metal plate, the hard aluminum alloy with higher yield strength is suggested, such as 7075 aluminum alloy with yield strength higher than 400 MPa.
The deformation of metal plate with pure aluminum used.
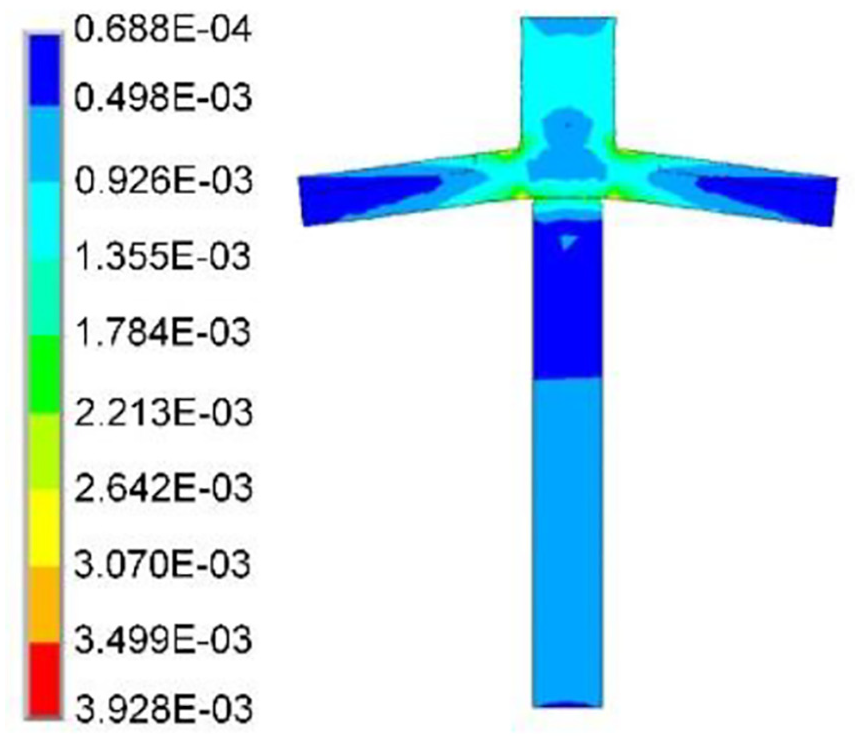
Figure 11 presents the stress distribution and deformation distribution of the insulating rod at 0.38 ms. It can be found that the maximum stress of the insulating rod appears at the upper joint, reaching about 99.6 MPa. It is mainly caused by the movement of the moving contact which is driven by the upper joint of the rod. Moreover, since the bonding position of the lower joint of the rod is longer than that of the upper joint, the stress of the lower joint is relatively small.

Stress and strain distribution of the insulation rod: (a) stress distribution on insulation rod and (b) strain distribution on insulation rod.
Figure 12 presents the stress and deformation distribution of the metal rod at time 0.38 ms. It can be seen that the maximum stress occurs at the connecting hole of the pins, which is approximately 358 MPa, and the corresponding maximum deformation is about 0.26%. The stress distribution at other positions on the rod is relatively uniform, which is all below 100 MPa. Consequently, for metal rod, the dynamic stress is in the safe range with hard aluminum alloy used.

Stress and strain distribution of the metal rod: (a) stress distribution on metal rod and (b) strain distribution on metal rod.
Figure 13 shows the stress and deformation distribution of the pin and the lower joint on the rod. It can be found that the stress is mainly concentrated at the connecting position between the pin and the lower joint on the rod, as well as the position near the hole of the pin. The maximum stress of lower joint and pin are 475 and 781 MPa, respectively. Thereby, the pin bears the maximum stress and makes it become the weak part that should be pay attention in the design of the actuator. In addition, it can be found from the deformation distribution of the pin that the middle portion of the pin is easily bent. This bending will cause the deformation of joints between metal rod and insulation rod. Hence, in order to avoid deformation of the rod, the lower joint selects the manganese steel material with high yield strength, which can ensure the connection part is within the safe strength range. Besides, the stress can be further reduced by increasing the diameter of the pin.

Stress and strain distribution at the connection part of the pin: (a) stress distribution of lower joint between insulation rod and pin, (b) strain distribution of lower joint between insulation rod and pin, (c) stress distribution of lower joint, and (d) stress distribution of the pin.
Experimental variation
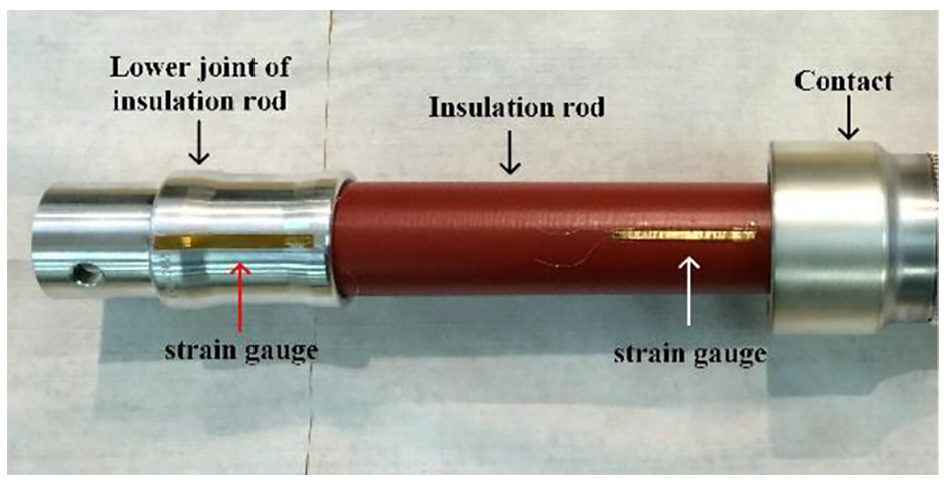
In order to measure the stress and strain of the key parts to verify the calculated results, the Wheatstone bridge and the strain gauge are employed to measure the deformation of the insulation rod and lower joint of insulation rod. Figure 14 presents the schematic diagram of dynamic strain measurement with pin diameter of 10 mm. The resistance R and the initial impedance of strain gauge Rn are both 120 Ω. R1 is for adjusting the amplification. The strain gauge and the rod are bonded together before the experiment. Figure 15 shows the test circuit of dynamic strain measurement. When the movable component is deformed under the impulsion of the electromagnetic force, the impedance of strain gauge changes due to the tension or compression. Then, the balance of the bridge is broken and the output voltage corresponding to the dynamic deformation value is obtained.
Schematic diagram of dynamic strain measurement.

Test circuit of dynamic strain measurement.
Figure 16 gives the experiment and simulation results of the dynamic strain over time for the insulation rod and the lower joint on the rod. In the initial 1 ms, the simulation and experiment results agree well. After 1 ms, there is a time difference between the simulation and experimental results for dynamic strain oscillations. This is mainly due to the frictional force of movable parts and the vibration of the joint position, which is difficult to accurately estimate. After the start of the opening, the electromagnetic force and the strain increase rapidly. For the insulating rod and the lower joint, the peak value of measured strain is approximately 10.8% and 21.2% smaller than the simulation results, respectively. Afterward, the strain drops rapidly with the decline of the electromagnetic force. At about 1 ms, the strain is substantially restored, which is caused by the self-elastic contraction of the material. After 1 ms, since the electromagnetic force still exists, the rod is stretched again which causes the strain in a fluctuating state. After 1.5 ms, the electromagnetic force gradually disappears, the buffer force of the actuator increases, which becomes the dominant factor of the strain. During this period, the rod shows obvious compression, and the strain is in a state of fluctuating until 3.5 ms. After 3.5 ms, the strain is almost disappeared, indicating that the insulation rod can satisfy the application requirements of the fast opening.

Test and simulation results of strain in the opening process: (a) insulation rod and (b) lower joint of the insulation rod.
Figure 17 shows the deformed pin and deformed connection hole of the metal rod after experiment. For the pin with diameter of 10 mm, the stress has exceeded its yield strength, which results in permanent plastic deformation of the pin with a value of about 0.2 mm. Meanwhile, the deformed pin also results in the edge of the hole being deformed. In order to enhance the structure strength of the pin, the diameter of connecting hole on the metal rod and the pin is enlarged to 12 mm. As presented in Figure 18, after 100 times of high-speed opening test, the improved pin and connecting hole have no obvious deformation, which indicates that it is an effective method to reduce stress by increasing the diameter of the pin.

The deformed pin and deformed connecting hole of the metal rod after experiment.

Pin with no deformation after multiple experiments.
Conclusion
In order to evaluate the dynamic stress and strain of movable components in the operation process of TC actuator, a structural strength simulation model based on the flexible body theory is established in this article, in which the flexible body system, the transient dynamic equations, and the distributed load are considered. The electromagnetic and buffer forces in the opening process are calculated, and then the dynamic strain and stress distribution of key components are obtained. Finally, by testing the dynamic strain of insulation rod and its joint in fast opening process, the rationality of simulation model is verified. The following conclusions can be drawn from the results:
The operation of actuator is determined by the electromagnetic force in the early stage of opening, while is mainly dominated by the pressure buffering force in the late stage. Meanwhile, the buffer effect before 1.8 ms is dominated by the pressure drag at low-pressure side of metal plate. Afterward, the pressure drag at high-pressure side mainly contributes to the buffer.
The maximum stress of the movable components is determined by the electromagnetic force, reaching a peak at about 0.38 ms. During the whole opening process, the pin is subjected to the greatest stress in different movable components. By calculating the stress distribution of different movable parts, it provides a basis for the optimization of the structure design.
The simulation results of dynamic strain agree well with the experimental results, indicating that the simulation model based on flexible body theory is feasible for the structure strength evaluation.
Footnotes
Handling Editor: James Baldwin
Declaration of conflicting interests
The author(s) declared no potential conflicts of interest with respect to the research, authorship, and/or publication of this article.
Funding
The author(s) disclosed receipt of the following financial support for the research, authorship, and/or publication of this article: This work was supported by the National Key Research and Development Plan of China under grant 2017YFB092400 and the National Natural Science Foundation of China under grants 51707145 and 51807162, the China Postdoctoral Science Foundation under grant 2018M641007.