
Abstract
Although numerous experimental and analytical investigations on the environmental effects on basalt fiber–reinforced polymer bars were carried out, degradation of the basalt fiber–reinforced polymer bar in seawater and sea sand concrete environment has been insufficiently analyzed. This work presents two distinct numerical approaches, degradation rate–based approach and diffusion-based approach, to investigate the durability of basalt fiber–reinforced polymer bars in seawater and sea sand concrete solution subjected to various temperatures (32°C, 40°C, 48°C, and 55°C). The degradation of the material was quantified using a simplified two-dimensional model of a homogenized basalt fiber–reinforced polymer bar in COMSOL Multiphysics software. Fickian diffusion provides basis for modeling diffusion-based approach. The findings from both the approaches suggested that the basalt fiber–reinforced polymer bar becomes more susceptible to degradation as the exposure temperature increases and results in greater geometrical deformities. The comparisons of experimental data, analytical solutions, and numerical results showcase that the present numerical models can predict the degradation of a basalt fiber–reinforced polymer bar in a seawater and sea sand concrete environment.
Keywords
Introduction
By the end of this century, the world’s population would have increased by more than one-third (10.9 billion) of the current population (7.7 billion) as of 2019 World Population Prospects. 1 With the rising global population comes the inevitable rise in demand for infrastructure, simultaneously leading to an increase in the demand for concrete and steel, two major construction materials in the construction industry. In recent years, fiber-reinforced polymers (FRPs) have been widely used in various industrial fields as a competitive alternative to traditional materials, such as steel,2,3 as it overcomes the pressing concern such as aging and deterioration of infrastructure due to corrosion of steel. Similarly, seawater and sea sand concrete (SWSSC) can be a substitute for traditional concrete as the consumption of a tremendous amount of river sand and freshwater in concrete production has become a serious environmental concern. 4 Moreover, the combination of FRP and SWSSC is preferred to steel and SWSSC as the sea sand contains a large amount of chloride ions. 5 These ions accelerate the corrosion of steel and result in the increase in maintenance costs and a decrease in the effective life of structures. 5 Nevertheless, the FRP bars are susceptible to changes of strength and stiffness in the presence of environments prior to, during, and after construction. 6
The traditional FRP bars generally refer to glass, aramid, and carbon FRP bars. The glass fiber–reinforced polymer (GFRP) bars are more widely used due to their low cost, 7 whereas the use of carbon fiber–reinforced polymer (CFRP) bars is limited because of its continuous high cost. 8 Lately, basalt fiber–reinforced polymer (BFRP) bars are being the subject of interest and have an increasing attention for possible replacement of GFRP bars. 9 In order to test the durability of BFRP bars in real-life scenario, several studies have been conducted for the durability of BFRP bars-SWSSC component level as well. From a study conducted by Dong et al., it was found that, under accelerated aging test using seawater at 50°C, BFRP and steel-BFRP composite beams show reduction in shear and flexural resistance capacity. 10 After conditioning, the residual tensile strength of bar was found to be 45.2% of the ultimate tensile strength. 10 Likewise, a comparative study of BFRP, steel, and steel-BFRP–reinforced concrete beams subjected to ocean water showed severe rusting of steel bar and rupturing of BFRP and steel-BFRP bars. 11 It was found that after exposing the BFRP-reinforced concrete beams for 6, 9, and 12 months, the tensile strength retentions of BFRP bars were 44%, 38%, and 34%, respectively. 11 These tests show better performance of BFRP bars on member level than GFRP bars, as GFRP bars show 0%–75% of strength reduction when used in reinforced concrete beams subjected to alkaline solution. 6
Moreover, the BFRP bars possess a series of sound properties such as workable at a wider range of temperatures (−269°C to 700°C), 12 comparatively cheaper, 13 showcases better resistance to the freeze–thaw cycle than its counterparts CFRP and GFRP, 14 and possesses comparable fatigue behavior. 15 However, its durability in terms of degradation depth in an alkaline environment is still of concern and needs to be investigated.
The degradation rate of BFRP bars is influenced by numerous parameters such as temperature,8,16 aging time, 17 the chemical composition of both bars and alkaline solution, 18 and also the alkalinity and acidity of the solution. 19 Besides, diffusion also limits the life of a BFRP bar to a greater extent. Diffusion in BFRP bars is facilitated by the concrete around the bars, whose pore humidity differs according to weather conditions: 72%, 20 20°C—50%, 2 and 40°C—96%. 2 As a result, the mechanical and geometrical properties of BFRP bars embedded in concrete change over time. Over the past few years, considerable experimental studies have been carried out on the calculation of the degradation depth of FRP bars. For instance, Katsuki and Uomoto 21 have proposed an expression to calculate the penetration depth of the alkaline solution into the GFRP bars using Fick’s first law. But despite the author’s claim on using Fick’s first law to find the penetration depth of the alkaline solution, Gaona 22 has explained the limitation in this formulation, as it shows the relation of concentration as a function of time and the penetration distance to the second power. Similarly, from the proposition of Gurtin and Yatomi’s 23 two-phase diffusion model, the results of the moisture ratio, G(τ), turned out to be length dependent. However, according to Fick’s second law, G(τ) is independent of the length of the specimen, thus raising a question on its appropriateness in predicting the degradation of composite materials. In addition, Carter and Kibler 24 proposed a Langmuir-type model for diffusion but limited the test on only one type of epoxy resin (5208). However, the maximum number of tests is only limited to GFRP bars, and very limited tests are performed on BFRPs particularly.
Hence, to address the aforementioned issues, this article attempts to establish two different approaches, the degradation rate–based approach and the diffusion-based approach, to quantify the degradation in BFRP bars in terms of depth. The first approach uses degradation rate to find the degradation depth, whereas the second model uses Fick’s second law to depict the concentration profile of OH− in the bar and calculate the penetration depth. The study focuses on the influence of temperature on the degradation of bars. The proposed mathematical model is solved numerically by the finite element (FE) method. The obtained numerical results are compared with the theoretical solutions of both approaches and the available experimental data.
Material properties
The material system in this study consists of a BFRP bar subjected to an SWSSC solution. The material properties such as degradation rate, molecular weight, density, and diffusion coefficient of the bar were analyzed in accordance with issued literature of Wang et al. 25 The homogenized rule-of-mixture approach was taken into consideration to analyze the properties in the study. Moreover, the N-SWSSC solution was chosen for this study to replicate the real SWSSC pore solution. 25
BFRP
The BFRP bar comprises basalt fibers and matrix. In this work Bisphenol A, epoxy resin, is taken as the matrix whose chemical composition is (CH3)2 C(C6H4OH)2. 26 Likewise, BFRP fiber is composed of SiO2, Al2O3, Fe2O3, CaO, MgO, Na2O, TiO2, and K2O, where SiO2 covers nearly 50% of the total composition. 27 In this study, the molecular weight and density of the bar were analyzed using this particular composition of the bar.
Degradation rate–based approach
The parameters used for the numerical model and their respective values are listed in Table 1.
Material parameters for degradation rate–based approach.
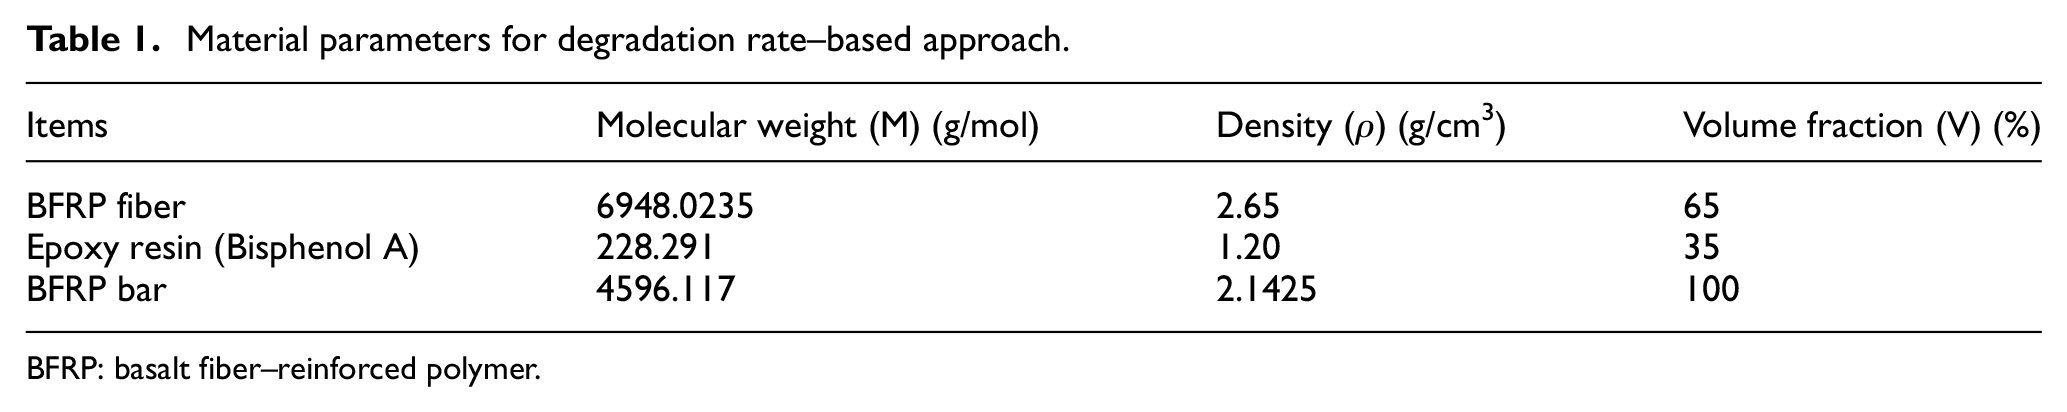
BFRP: basalt fiber–reinforced polymer.
The total molecular weight of the BFRP bar is calculated using the rule of mixture

where MBFRP, Mf, and Mm represent the molecular weight of the BFRP bar, resin matrix, and fiber, respectively; and Vm and Vf represent the volume fraction of resin matrix and fibers inside the BFRP bar, respectively. Likewise, the density of the bar is also calculated. Similarly, the degradation rates at distinct temperatures 32°C, 40°C, 48°C, and 55°C for the BFRP bars were referred from the issued literature. 25 Initially, the values of tensile strength retention of bars immersed in normal seawater sea sand concrete (N-SWSSC) for 63 days were found to be 92.7%, 81.7%, 59.1%, and 25.96% at temperatures 32°C, 40°C, 48°C, and 55°C, respectively. 25 Then, using the tensile retention equation, equation (3), that relates tensile retention with exposure time and τ, inverse of degradation rate in terms of tensile strength (k), the values of τ at each temperature are found. Consequently, k at each temperature is evaluated. Moreover, the values of k′, degradation rate in terms of depth is calculated using equation (5) and is summarized in Table 2.
Degradation rate of BFRP bar exposed in SWSSC solution at different temperatures.

BFRP: basalt fiber–reinforced polymer; SWSSC: seawater and sea sand concrete.
Diffusion-based approach
For the diffusion-based approach, the diffusion coefficient of the BFRP bar was calculated referencing Wang et al. 25 The diffusion values are calculated using equation (4), and detailed description is included in section “Analytical solution 2: diffusion-based approach.” The values determined for each temperature are presented in Table 3.
Diffusion coefficient of BFRP bars at different temperatures.

BFRP: basalt fiber–reinforced polymer.
N-SWSSC solution
The solution used in the model was also chosen according to the work by Wang et al.
25
In general, SWSSC solution is a solution with high alkalinity. According to the issued literature, the pH of N-SWSSC was measured to be 13.4.
25
Using the constituents of the solution, sodium hydroxide (2.4 g/L, NaOH), potassium hydroxide (19.6 g/L, KOH), calcium hydroxide (2 g/L, Ca(OH)2), sodium chloride (35 g/L, NaCl), and distilled water (to make the volume of solution of one liter), the pH was calculated for the analysis using
Degradation rate–based model
A two-dimensional (2D) FE model was realized in the commercial software COMSOL Multiphysics to investigate the depth of degradation of a BFRP bar exposed to a seawater sea sand pore solution subjected to various temperatures. In the experiment conducted by Wang et al., 25 the middle part of the BFRP bar specimens has been inserted inside the PVC (polyvinyl chloride) pipe that is used as a chamber for exposure to simulate SWSSC solution. The ends of the PVC pipe were sealed with epoxy adhesive to ensure no leakage. The specimens are subjected under four temperatures: 32°C, 40°C, 48°C, and 55°C. After exposing the solution for 21, 42, and 63 days, the bars were removed from the container and the tests were conducted. In order to replicate this in the FE simulation, the model, as shown in Figure 1, was used for the study. However, the container of square shape has been taken into consideration in the simulation as it is believed that the shape of the container does not affect the results significantly. Moreover, considering symmetry only a quarter portion of the circular bar was used for simulation. The geometry of the model was defined with a Cartesian coordinate system. The model depicts the transportation of the liquid etchant, that is, OH− to the surface that is to be degraded and the degradation of BFRP bar due to the etchant.

Finite element mesh of the bar and the container with the solution.
Governing equations for degradation rate–based model
The mass transport of the OH− from the bulk to the surface of the BFRP bar by convective and diffusive phenomena is described by 28

However, in the study, to achieve the ambient conditions of the solution, velocity,
Previous studies presumed that at infinite exposure the bars were degraded completely 29 but later Chen et al. 30 formulated equation (3) relating degradation and exposure time

Similarly, as stated in the works by Katsuki and Uomoto 21 and Aguíñiga et al., 31 the final tensile strength is given by

where Y denotes tensile retention, t denotes exposure time (s), R denotes the radius of the bar (mm), x denotes the degraded region, k denotes the degradation rate in terms of tensile retention, τ denotes 1/k, and
Now, arranging and rearranging equations (3) and (4) and assuming,

Similarly, k can also be found using the Arrhenius equation, relating the degradation rate with temperature25,30
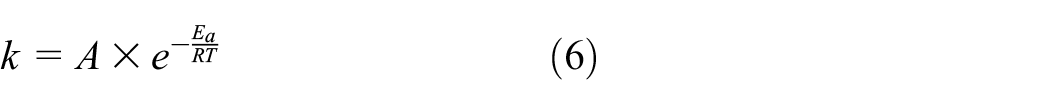
where k denotes degradation rate (1/s), A denotes the constant of the material and degradation process, Ea denotes the activation energy, R is the universal gas constant, and T denotes Kelvin temperature. As stated, the primary assumption of this model is that while exposing the material to certain time and temperature, the degradation mechanism will not be affected but the rate of degradation will be escalated with the increase in temperature.25,30
Moreover, the surface reaction in the model is taken as first-order reaction for simplicity and is given by the following equation

where Rsurface denotes the surface reaction inmol m−2 s−1,

where Vsurface denotes the velocity of the moving mesh (m/s), MBFRP denotes the molecular mass of the BFRP bar (g/mol), and ρBFRP denotes the density of the BFRP bar (g/cm3). The ratio of the molar mass of BFRP bar to its density converts the molar reaction rate into a recession velocity for the surface as it degrades.
Mesh and boundary conditions for degradation rate–based model
The geometry and the meshing of the model are shown in Figure 1. A physics-controlled unstructured triangular extremely fine mesh was used for the model with 17,189 number of elements. The quality of the mesh was evaluated according to the color gradient; the colors varied from red (low quality: 0) to green (high quality: 1). As delineated in Figure 1, the domain contained stagnant fluid within, and the surface of quad-circular portion of 3.15 mm radius was considered as the deformable BFRP bar. Similarly, on the left and top edge of the geometry, a constant bulk concentration of OH− was assumed. Finally, flux (Rsurface) and prescribed normal velocity (Vsurface) were assigned as a boundary condition to the quad-circular portion of the model and the simulation was carried out.
Results and discussions for degradation rate–based model
The degradation mechanism of BFRP bars in SWSSC solution entails the corrosion of resin, fibers, and fiber-resin interface. As described, the degradation of glass fibers mainly takes place due to the disruption of the siloxane (Si-O-Si) bond by the hydroxyl ions OH−.18,27,33,34 As basalt fiber is taken as the closest analogue of glass fiber, it is reasonable to apply the same degradation mechanism for basalt fibers as well.25,35,36 Similarly, in case of resins, epoxy resin mixed with the anhydride curing agent, degradation takes place due to OH−.25,37,38 As a result, for the homogenized bar used in the study, OH− is taken as the driving factor for degradation. Figure 2 shows the initial condition for the model, where the radius of the bar is 3.15 mm and the surface condition is normal. But as the degradation proceeds with time, due to the concentration gradient, there is a diffusive flux of OH− from the bulk to the BFRP bar surface, hence providing more OH− to the surface to facilitate the degradation phenomenon in the bar.

Initial condition.
Figure 3 exhibits the progression in damage along the cross section of BFRP bars at various exposure temperatures. As stated by Wang et al., 25 Figure 3 also depicts the damage in BFRP bars starting from the circumferential part as it comes in contact with the aggressive SWSSC solution first. As shown in Figure 3(a), the surface condition of the bar changes after 63 days of immersion in the alkaline solution at 32°C. The surface of the bar is corroded, as suggested by Wu et al., 39 due to etching. Similarly, in Figure 3(b)–(d), it can be seen that the depth of corrosion has accelerated to a greater extent with the increase in exposure temperature. However, here the degraded profile seems to look symmetric owing to the stagnant conditions applied in the model.

Degradation depth after 63 days: (a) 32°C, (b) 40°C, (c) 48°C, and (d) 55°C.
Furthermore, the degraded depth versus time graph presented in Figure 4 quantifies the amount of degradation taking place at 32°C, 40°C, 48°C, and 55°C. The graph depicts that at 32°C only the minimal part of the bar is seen to be corroded, with a slow rate of degradation, whereas at 55°C, the rate of degradation seems to have accelerated and is of about 24.59 μm/day with a degradation depth of 1549.09 μm. Moreover, the degradation rate at 40°C and 48°C is 4.78 and 11.58 μm/day, respectively. Hence, it is evident that the degradation rate escalates with high exposure temperature.

Degradation depth at different temperatures.
Diffusion-based model
Diffusion of OH− was modeled by the Fickian diffusion-based FE package COMSOL. A simple approach was considered in the study by considering the diffusivity of the bar to be isotropic and constant at every point. The OH− progression through the BFRP bar was observed at distinct temperatures 32°C, 40°C, 48°C, and 55°C and in a time period of 63 days with a homogenized diffusion value calculated referring Wang et al. 25 However, literature evidence 40 suggests that in the interphase region closer to the fibers, diffusion may happen faster. Similarly, several studies also suggest diffusivity to be anisotropic 41 but have realized the value to be approximately similar in the x and y directions. However, some papers21,42 have provided different diffusivity values for fibers and resins as the composite bars are a heterogeneous material but have ultimately used the homogenized value for further calculations. Hence, in this 2D model, the BFRP bar is homogenized and a constant diffusivity value has been assigned throughout the bar for simplicity.
Governing equations of diffusion-based model
For a natural diffusion, Fickian diffusion can be described using the 2D continuity equation 43 as presented in equation (9)

which gives the change in concentration,
Mesh and boundary conditions of diffusion-based model
A physics-controlled unstructured triangular extremely fine mesh following Figure 5 was used with a total of 25,970 elements. Similarly, to check the quality of the mesh, the color gradient mentioned in section “Mesh and boundary conditions for degradation rate–based model” was used.

Finite element mesh of the bar.
As per the boundary conditions, the boundary is kept at a constant concentration Cs as illustrated by Figure 5. Similarly, for the initial condition, at time t = 0, the entire representative model has zero concentration of OH−. Here, the boundary conditions were chosen to mimic the conditions that were exercised in the experiment. 25
Results and discussion for diffusion-based model
The diffusion phenomenon in the BFRP bar exposed in SWSSC solution is characterized by ingression of OH− ions inside the BFRP bar. Understanding the diffusion process is very important to analyze the mechanical degradation in the BFRP bars. Therefore, it is crucial to know the concentration distribution of OH− ions throughout the section of the bar as a function of time. The proposed diffusion-based model was used to predict the degradation depth of BFRP bars in SWSSC environment at various temperatures. The concentration profile reflects the diffusion of the alkaline solution in the BFRP, modeled using Fick’s law. Figure 6 presents the initial condition for the homogenized BFRP bar with a concentration of 463 mol/m3 at the boundary surface. Likewise, Figure 7 demonstrates the concentration profile of the BFRP bar exposed at different temperatures for 63 days. It can be observed from Figure 7(a) that at room temperature, the diffused concentration of OH− is limited to a considerably small distance from the boundary. In contrast, the bar subjected to 55°C shows how the OH− has advanced almost fully within the bar from the boundary (Figure 7(d)). The trend of results shows compliance with Kelverkloglou 44 as it also showcases higher penetration at 50°C comparing to 35°C. As issued, R Sen et al. 45 carried out a test on the stressed and unstressed bars at various temperatures and found that the stressed bars exposed at high temperatures showcased greater degradation. The result for unstressed bars was similar, as in this study, that is, at high temperature, the bars had deeper penetration.

Initial condition of the bar.

Concentration profile after 63 days: (a) 32°C, (b) 40°C, (c) 48°C, and (d) 55°C.
Comparing Figure 7(a)–(d), it can be seen that the penetration of alkali inside the bar is strongly affected by the temperature. Moreover, Figure 8 portrays concentration versus radius of the bar graph, at various temperatures, 32°C, 40°C, 48°C, and 55°C. Hence, using the graph in Figure 8, maximum degraded depth at each temperature was quantified and the degradation rate was calculated. From the numerical model, the degraded depth at temperatures 32°C, 40°C, 48°C, and 55°C was evaluated as 124, 309, 767, and 1792 μm. Similarly, the degradation rate at 32°C, 40°C, 48°C, and 55°C were calculated as 1.97, 4.91, 12.18, and 28.44 μm/day, respectively, suggesting that the acuteness of damage increases with the exposure temperature.

Concentration versus radius at different temperatures.
Validation of degradation rate–based approach and diffusion-based approach
Analytical solution 1: degradation rate–based approach
The degradation rate was calculated referring to the tensile strength of the bars. Figure 9 shows a schematic representation of the degradation in BFRP bars subjected under SWSSC pore solution.

Schematic representation of degradation of BFRP bars.
From the analytical study carried out by Katsuki and Uomoto,
21
at an exposure time t = 0; r0 is the original depth, and
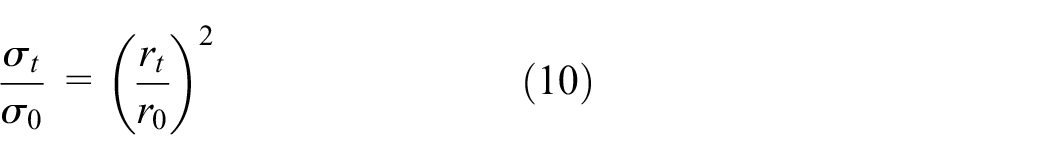
Hence, using equation (10), the reduced radius was calculated as 3.033, 2.85, 2.423, and 1.6 mm at recorded temperatures 32°C, 40°C, 48°C, and 55°C, respectively.
Analytical solution 2: diffusion-based approach
In order to find the depth of degradation, one-dimensional (1D) continuity equation was taken into consideration. The analytical solution satisfying the boundary condition and the initial condition is given in equation (11). 46 As per the boundary conditions, the model presumed diffusion in a semi-infinite medium C(0, t) = Cs. Similarly, for the initial condition, at time t = 0, C(x, 0) = 0
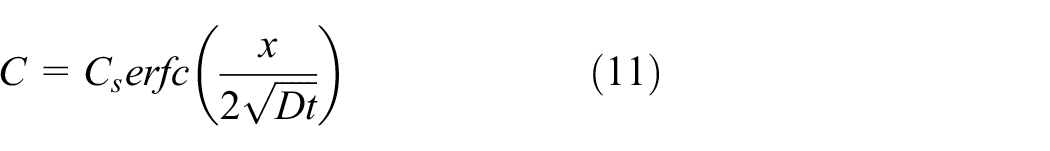
where
The values for the diffusion coefficient were calculated using equation (4), where x is taken as the diffusion depth, that is,
Comparative study of degradation based on analytical, experimental, degradation rate–based, and diffusion-based approach.

Comparison of numerical results with analytical and experimental results
The comparison between the degraded depth at temperatures 32°C, 40°C, 48°C, and 55°C from analytical, experimental, and numerical approaches for BFRP bar exposed at SWSSC pore solution is listed in Table 4. It can be observed that the degraded depth predicted from the degradation-based approach and the analytical method is in good agreement with each other, while the diffusion-based approach manifests a slightly higher value. Moreover, at lower temperatures, the results of the degradation rate–based model have a better correlation with test data than those of the diffusion-based model. At intermediate temperatures, both analytical and numerical predictions agree well with experimental data. And at higher temperatures, the results of the diffusion-based model have a better correlation with test data. In general, the analytical, numerical, and experimental results agree reasonably well with each other.
Conclusion
This work investigated the degradation of BFRP bars subjected to an SWSSC environment by focusing more on geometrical deformities. A novel methodology using two numerical approaches, degradation rate–based and diffusion-based models, was proposed to quantify the degradation of BFRP bars subjected to SWSSC environment. The concentration profile created within the bar along with the depth of degradation was examined in the study. Similarly, the evaluated degradation in the bar was analyzed and summarized. The numerical results reported in the literature were also compared with the analytical and experimental results. Hence, the major conclusions drawn are as follows:
At lower temperatures, the bar displays no significant damage, that is, approximately 4% and 9.5% of the radius for temperatures 32°C and 40°C, respectively, whereas at higher temperature (55°C), the degradation is substantial. At this temperature, the degradation depth is almost half of the radius of the bar considered in the study. This implies that the extent of degradation in BFRP bar increases with the rise in temperature.
The concentration profile also depicts more damage at the surface portion of the bar than the inner portion, because with time the concentration of the OH− decreases as it penetrates deeper in the bar.
The presented FE models for the assessment of degradation in BFRP bars in an SWSSC environment are able to predict the depth of degradation with good accuracy.
Footnotes
Acknowledgements
The first author is grateful to the China Scholarship Council (CSC) for providing scholarship to pursue post-graduate studies in Shanghai Jiao Tong University. The authors also thank Dr Zike Wang of Zhengzhou University and Kedar Baral of Shanghai Jiao Tong University tremendously for their immense help and support provided during the study.
Handling Editor: James Baldwin
Declaration of conflicting interests
The author(s) declared no potential conflicts of interest with respect to the research, authorship, and/or publication of this article.
Funding
The author(s) disclosed receipt of the following financial support for the research, authorship, and/or publication of this article: This study was financially supported by the National Natural Science Foundation of China (U1831105, 11272207).