
Abstract
The in-situ prognostics and health management of aircraft auxiliary power unit faces difficulty using the sparse on-wing sensing data. As the key technology of prognostics and health management, remaining useful life prediction of in-situ aircraft auxiliary power unit is hard to achieve accurate results. To solve this problem, we propose one kind of quantitative analysis of its on-wing sensing data to implement remaining useful life prediction of auxiliary power unit. Except the most important performance parameter exhaust gas temperature, the other potential parameters are utilized based on mutual information, which can be used as the quantitative metric. In this way, the quantitative threshold of mutual information for enhancing remaining useful life prediction result can be determined. The implemented cross-validation experiments verify the effectiveness of the proposed method. The real on-wing sensing data of auxiliary power unit for experiment are from China Southern Airlines Company Limited Shenyang Maintenance Base, which spends over $6.5 million on auxiliary power unit maintenance and repair each year for the fleet of over 500 aircrafts. Although the relative improvement is not too large, it is helpful to reduce the maintenance and repair cost.
Introduction
Auxiliary power unit (APU) is utilized in many kinds of modern aircrafts. One of the most important functions of APU is to help start the main engines. The necessary supplement for starting the main engines are compressed air and electricity. In addition, APU provides fresh air and power into the cabin during the off-working state of the aeroengine. The flight task of the aircraft will be suspended if the on-wing APU is fault or failure. For the electric aircraft, an important function of APU is to provide additional thrust when the aircraft is on the air. 1 Hence, its on-wing condition is very important for the modern aviation. One promising technology to predict the condition of APU is prognostics and health management (PHM), which has been applied for monitoring the condition of complex object.2,3
In the domain of PHM, the methodologies based on physical model and data-driven model are two kinds of commonly utilized approaches.4,5 Although the model-based method can achieve precise and stable prediction result, it is hard to formulate the physical model of complex object. 6 Hence, it is not applicable in many modern industry systems. On the contrary, data-driven model can be carried out with the available sensing data of the monitored system. 7 Nowadays, the condition monitoring data can be collected easily, especially with the help of modern sensor technology. Therefore, the available data for formulating the data-driven model are more and more abundant, which make it become the promising method for complex industrial system.
In the area of data-driven model, one of research subjects is to improve the prediction result, especially for implementing remaining useful life (RUL) prediction.8,9 For the online application scenario, Yan et al. 10 propose the on-line model parameter adaption scheme to enhance the accuracy and precision of diagnosis and prognosis. To carry out the adaptive clustering for bearing and gear fault diagnosis, Wang et al. 11 aim to solve three real industrial applications by the intelligent method. With the development of deep learning, it has been successfully employed to improve the condition monitoring of bearing and the analogic circuit.12,13 In some real scenarios, it is difficult to collect the condition monitoring data of the whole life-cycle. To solve this problem, accelerated degradation testing (ADT) is one kind of efficient method.14–16 By applying ADT, RUL prediction can be improved with the abundant ADT data. At the same time, many available RUL prediction methodologies have been proposed to predict the condition of the target system.
Among the existing studies, the rotating machinery (e.g. bearing and gear) has been payed much attention. The application of entropy theories on bearing fault diagnosis has been investigated comprehensively. 17 The problem of recognizing the early fault in bearing and gear has been considered in Wang et al. 18 To improve the fault diagnosis of bearing, the novel convolutional neural network can be utilized by enhancing the related features.19,20 To identify the different kinds of fault, the method based on smoothness index-based Bayesian inference is adopted. 21 For realizing the deep fault in the rotating machinery, it needs to denoise and extract the valuable information which can be realized by the integrated model. 22 To identify the size and position of fault in the bearing, the method based on vertical–horizontal synchronization is proposed. 23 To mine the fault feature contained in the monitoring data of bearing, the time–frequency manifold sparse reconstruction can be utilized. 24 To extract the degradation information of bearing and gear, the long short-term memory recurrent neural network can be used.25,26 The method based on Bayesian dynamic linear model and Copulas can also be adopted to reach this objective. 27 The aforementioned researches indeed implement effective methodologies. However, those works mainly focus on how to process the existing data and ignore whether the sensor data are anomalous.
In the field of sensor data analysis, there are some typical studies which have payed attention to the above theme. Liu et al. 28 propose one kind of quantitative sensor selection method for RUL prediction based on the improved permutation entropy. The sensing data of the aircraft engine are selected and implemented anomaly detection to reach better prognostics result. 29 The anomalous sensor data in the space battery have been carried out to ensure the corrective monitoring result. 30 The outlier condition of sensor data in the unmanned aerial vehicle is studied by the local regulated optimization method. 31 If the anomalous senor data are adopted for the condition monitoring of system, they may bring seriously deviated prediction result. One kind of effective method is to recover those data for the input of condition monitoring algorithm.32,33 These researches have provided valuable guide to carry out APU PHM with its sensing data. APU belongs to one kind of typical complex system, which is mainly consisted of the load compressor, the power section, the gearbox, and so on. Some works have been implemented to predict its fault or failure. To evaluate the performance deterioration of APU, the generalized renewal process which is based on Weibull distribution can be adopted. 34 The works of Wang et al. 35 and Liu et al. 36 aim to ensure that exhaust gas temperature (EGT) can reflect its condition correctly, which is one of the most important parameters. Liu et al. 37 propose to carry out RUL prediction of APU by using its on-wing sensing data. However, this work only considers the simple combination of EGT with the other sensing data.
To the best of our knowledge, there is no study which has considered the sparse dimension feature of APU on-wing sensing data, that is, only one or a few available sensing data for RUL prediction. This study aims to mine the other potential parameters in the quantitative manner, which can help to enhance RUL prediction of APU. One kind of data-driven method based on mutual information analysis among the on-wing sensing data is proposed, which is expected to find the quantitative threshold for determining other valuable sensing data for RUL prediction of APU. This method utilizes quantitative analysis of the raw sensing data, which has been neglected by many researchers. As introduced in Gorinevsky et al., 38 the most appropriate sensing data when APU helps start the main engines are also adopted in the proposed method. The quantitative of mutual information ratio of EGT with other sensing data is the key element in the proposed method, which determines the actual input for RUL prediction method. We also prove that Gaussian process regression (GPR) and relevance vector machine (RVM) are suitable for implementing the RUL prediction of APU, which means that these two methods are suitable for the similar object to APU. The proposed method is verified by the data from China Southern Airlines Company Limited Shenyang Maintenance Base. The utilized APU in this study is equipped in the three kinds of Airbus aircraft with the fleet of over 240 aircrafts (e.g. A319, A320, and A321). The proposed method is expected to reduce the overhaul cost with more reasonable arrangement.
The rest of this article is organized as follows. The “Methodology” section introduces the proposed method and the related theories, including mutual information, GPR, RVM, and metrics for evaluating RUL prediction result. The “Evaluation experiments and discussion” section introduces APU sensing data, and experimental results and the detailed discussion. The “Conclusion and future work” section draws the conclusion and provides the future work.
Methodology
In this section, the proposed method for implementing RUL prediction of APU is introduced. The utilized theories for this method are also presented, and metrics for measuring RUL prediction result are illustrated.
The proposed RUL prediction method for APU
Due to the complex structure of APU, its physical model cannot be formulated accurately. When APU is in the on-wing utilization, its condition monitoring data are transmitted to the airline datacenter during each flight task. Among these available on-wing sensing data, some are appropriate for implementing its RUL prediction. Based on the most important performance parameter (EGT), one kind of data-driven method is proposed to predict its RUL, as illustrated in Figure 1.

The proposed RUL prediction method for APU.
The condition monitoring data of on-wing APU are consisted of many segments, including CC, C1, CE, and so on. These sensing data are collected during the working process of APU, which can reflect its real working condition. They are also the only available source to evaluate the on-wing condition of APU. The proposed method aims to mine these condition monitoring data to achieve the degradation analysis of APU. The detailed implication of these sensing data will be introduced in the following section.
The most important step in Figure 1 is how to evaluate the useful information of those on-wing sensing data (i.e. appropriate input for prediction method). As given in Figure 1, this step is named as information analysis. To realize this target, the parameter EGT which can denote the performance of APU is confirmed. To mine the other parameters which can bring positive influence on RUL prediction result, mutual information is adopted.
The quantitative information Δ of other on-wing sensing data with EGT is first calculated. The proposed method supposes that there is a threshold (i.e. C in Figure 1) of this information to bring positive influence on RUL prediction result of APU. If mutual information between another parameter and EGT is larger than the half mutual information value of EGT itself, it may bring more valuable information of APU degradation. Therefore, the value of threshold C is half mutual information value of EGT itself. The reason is that EGT contains much degradation information. If another parameter can provide additional degradation information, it should be helpful for enhancing RUL prediction of the in-situ APU.
The on-wing sensing data of APU have the sparse feature, which means that only a few dimension data contain the degradation information. As introduced in the “Introduction” section, most studies focus on only using EGT to achieve condition assessment of APU. To mine other potential monitoring data for realizing RUL prediction of APU, GPR and RVM, which are two typical methods in this domain, are used to evaluate the effectiveness of the proposed quantitative analysis among the on-wing sensing data. The details of two prediction methods and evaluation metrics are introduced in the following sub-sections.
Mutual information
As one effective information measurement, mutual information has been frequently adopted to mine the relationship among different data. Compared with the correlation coefficient, mutual information can effectively weigh the linear and nonlinear relationship. Its definition is based on the basic information entropy. Therefore, the physical connotation of entropy is given first. If the variable x is discrete, its entropy can be realized by Shannon’s work 39

where pi(x) refers to the probability of each variable over all kinds of variables. The number of all kinds of variables is denoted by N.
If the variable x is continuous, it can be expressed by the distribution function

where S denotes the aggregation of all kinds of random variable.
In the above two equations, the base of log can select different values. The corresponding unit of entropy is determined by the value of base. According to the different requirement of specific application, we can set the log base to be any value. In this study, the base of the logarithm is set to be 2 for all mutual information calculation, which will not affect the result measurement.
In order to calculate the mutual information of different variables, the first step is to calculate the conditional entropy of one variable with the other variables. For the conditional entropy

where X refers to the data series {x1, x2,…, xn} and Y indicates the data series {y1, y2,…, ym}.
For the conditional entropy

where X and Y have the same definition as those in equation (3).
By utilizing the above definitions, the mutual information

In equation (5), the mutual information denotes the subtraction of the information entropy to the conditional entropy. By analyzing the above three kinds of definitions, the relationship is given in Figure 2.

Mutual information depending on entropy and conditional entropy.
In this study, we utilize mutual information to mine other potential data with EGT to predict RUL of APU. The other determined sensing data are expected to bring positive influence on the final prediction result.
GPR
Gaussian process has been adopted in different scenarios to solve the problem of stochastic process.
41
For


where
For the typical application,

where

where
In the following step, let

where


The first step of utilizing GPR is to determine the mean and variance functions. Meanwhile, the parameters in these two functions need to be initialized. Then, according to their prior distribution, the training data are utilized as the input. The iterative algorithm is adopted to achieve the posterior distribution. Finally, RUL prediction is realized by using the posterior distribution and test data.
When GPR is used to analyze the on-wing sensing data of APU, the distribution of long-time monitoring data can be recognized. The degradation trend is the most valuable information for predicting RUL, which can be mined by GPR. This procedure is mainly realized during the training period of GPR. The related parameters of GPR model are automatically optimized by the adopted training data. Then, the trained GPR model is utilized to achieve the following RUL prediction of the in-situ APU.
RVM
For

where
In the real application, the data are with noise which are represented by

where
If

where
The maximum-likelihood of

where
In this way, the posterior distribution is given by

In equation (19), the covariance and the mean can be achieved by


with
In equation (17), the likelihood distribution is able to be calculated by

Therefore, the detail of formation of the function is shown by

with
The values of

where
The new

where N is the number of input data.
If there is a new point


where
When RVM is adopted to realize RUL prediction, the key step is to train RVM model using likelihood function and priori knowledge. The likelihood is to obtain the potential feature of training data, and the priori knowledge is to describe the complexity of the model. Then, the iterative algorithm is utilized to train the model. In this way, the stability equalization can be achieved.
RVM has been verified that it can achieve relatively accurate RUL prediction results under a few dimension sensing data. For example, RVM has been utilized to realize RUL prediction of the lithium battery based on only the current and voltage data. For the on-wing APU, RVM is expected to use EGT and other data for improving prediction results. The potential sensing data, which contain the degradation information of APU, may provide positive influence on the final prediction results.
Metrics for RUL prediction result
To evaluate the performance of RUL prediction, mean absolute error (MAE) is utilized to measure the accuracy and root mean square error (RMSE) is adopted to measure the stability of RUL prediction result. The definitions of these two metrics are given in the following two equations


In equations (28) and (29), Pk denotes the predicted RUL of APU. Rk refers to the actual RUL of APU. The number of the implemented prediction is denoted by N. For measuring prediction result, smaller MAE refers to better accuracy, and smaller RMSE indicates better stability.
Evaluation experiments and discussion
In this section, the utilized on-wing sensing data of APU are introduced. The evaluation experiments are carried out and results are analyzed, discussed, and compared in detail.
APU data description
The on-wing condition of APU is collected by the previous deployed sensors. Then, these sensing data are transmitted to the datacenter of the airline by Aircraft Communications Addressing and Reporting System (ACARS). The A13 message in these data indicates the condition of APU and other essential information of the aircraft, as illustrated in Table 1.
Parameters of A13 message.
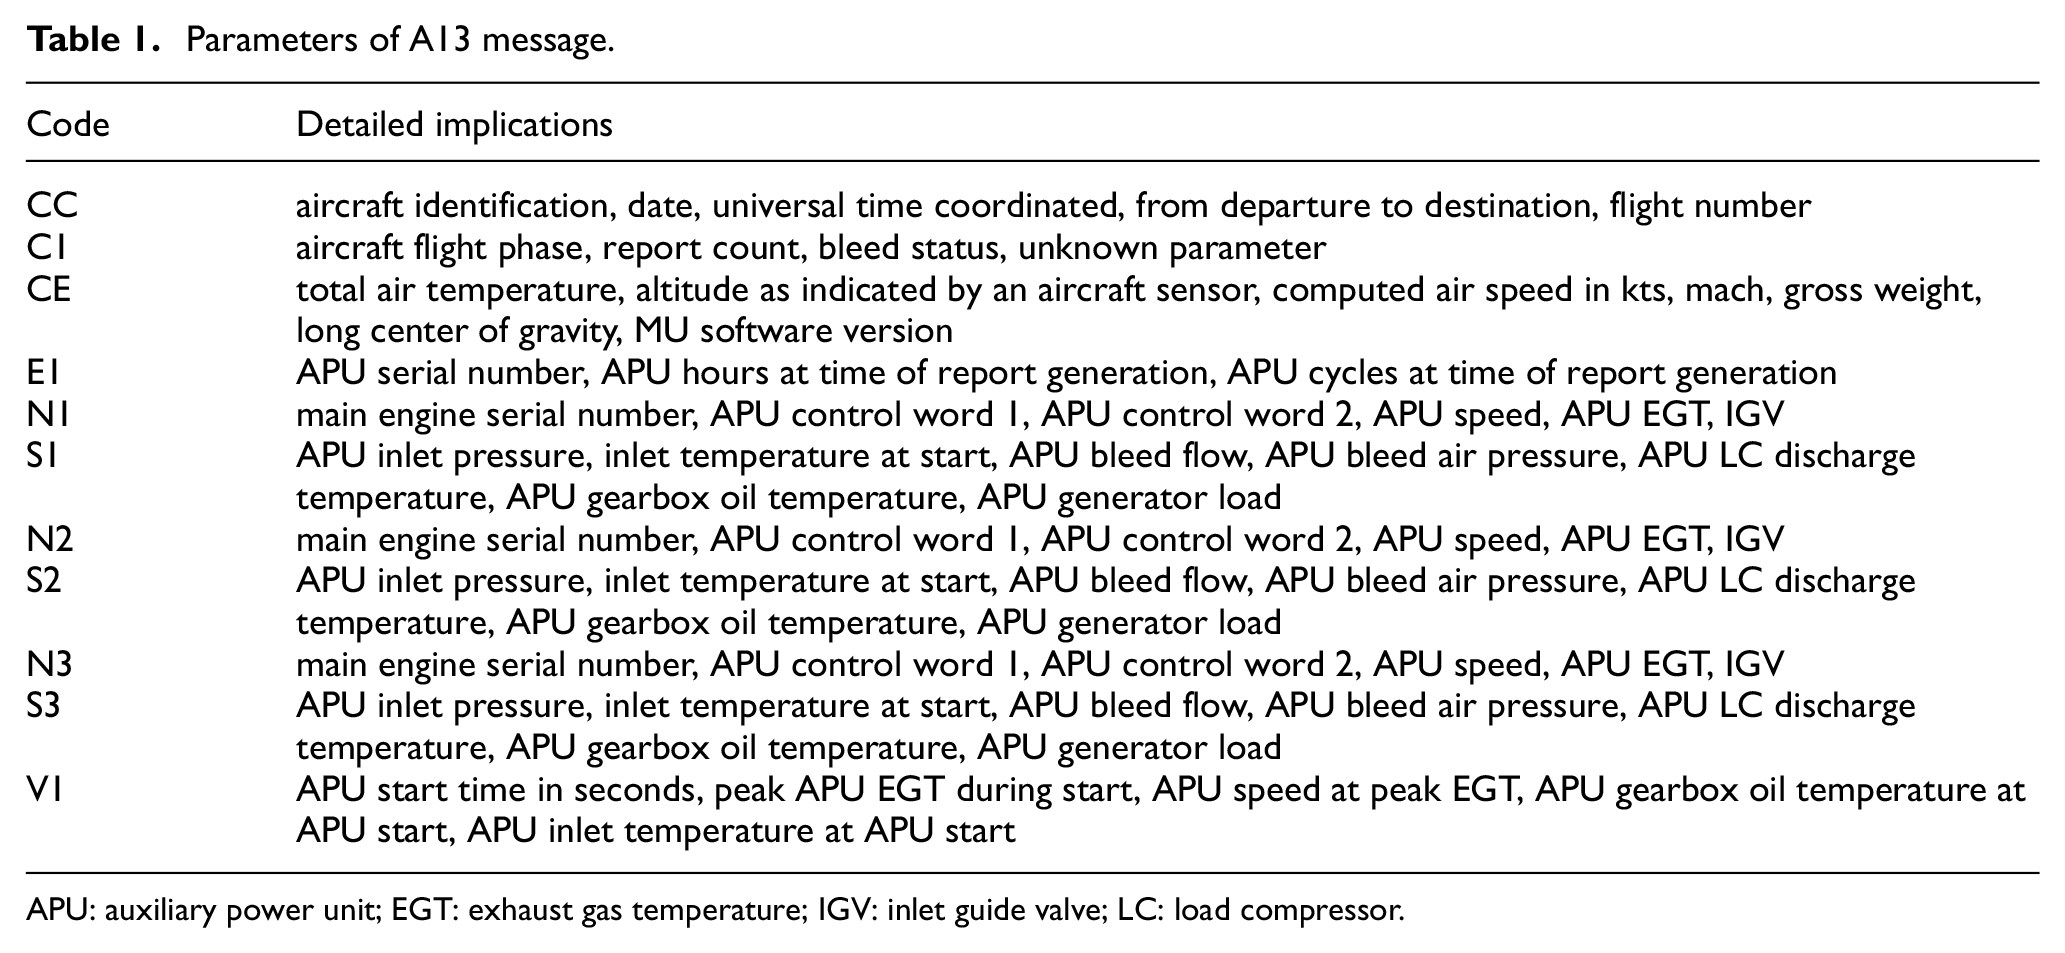
APU: auxiliary power unit; EGT: exhaust gas temperature; IGV: inlet guide valve; LC: load compressor.
Mutual information between sensing data
Based on the expert knowledge of APU, there are some important parameters which are directly relative to its on-wing condition. As introduced in the “APU data description” section, the original data in the segments of N1 and S1 are utilized. Among these two segments, there are 13-dimension data. Besides the control word and the stable parameters, four important sensing data are selected for the following experiments and analysis. Among these available condition monitoring data, EGT is the most important parameter that can reflect the condition of the on-wing APU. Mutual information is used to measure the quantitative relationship between EGT and other three important sensing data. In this way, the potential parameters for enhancing RUL prediction can be determined. By using the definition of mutual information, the numerical values among these data are summarized in Table 2.
Mutual information among sensing data (Unit: bits).

EGT: exhaust gas temperature.
As shown in Table 2, the largest mutual information is 4.61 bits, which is the EGT itself. As the most important parameter of APU, there are three values of mutual information. Both bleed air pressure and gearbox oil temperature have stronger relationship with EGT. The mutual information between these two parameters and EGT are 2.90 bits and 2.40 bits, respectively. The mutual information of bleed flow itself and with other parameters are much smaller. The original on-wing sensing data of these four parameters are illustrated in Figure 3.

The original condition monitoring data of APU.
For following simple analysis, let BF denote the bleed flow, BAP denote the bleed air pressure, and GOT denote the gearbox oil temperature. EGT becomes larger and larger, which complies with the degradation of APU. Besides some severely different points in BAP, its monotonous trend may represent the degradation. The GOT has obviously monotonous trend in the latter working process. Compared with other three parameters, the BF has a few different values. As presented in the “The proposed RUL prediction method for APU” section, the aim of this study is to find the threshold C for determining the RUL prediction of APU. This insight will be verified and discussed in the following evaluation experiments.
Experimental results
In this subsection, RUL prediction of APU is carried out by GPR and RVM. To select the training set and the test set, the general basis is to provide enough training data for optimizing the utilized data-driven methods. In this study, more than half of total data are used to train GPR and RVM. The other part of data set is used to test the performance of the trained models. Experimental results are discussed in detail to evaluate the performance of the proposed method.
RUL prediction of APU using GPR
Two comparison experiments for RUL prediction of APU using GPR are mainly carried out to evaluate the performance of the proposed method. The details of these two experiments are introduced as follows.
The first experiment is that only EGT is utilized to realize RUL prediction of APU. In Shannon’s study, 39 EGT is considered as the important parameter of APU and it can be adopted to predict the degradation of APU.
The second experiment is that EGT and the other sensing data are utilized to predict RUL of APU. These utilized sensing data have the maximal numerical value of mutual information with EGT. As the insight discovered in Gorinevsky et al., 38 the RUL prediction of APU can be improved by these two input sensing data.
Besides, the cross-validation experiments which are based on the combination of different sensing data with EGT are implemented. To be specific, two-dimension sensing data which include EGT and another one-dimension data are utilized as the input. Three-dimension sensing data which include EGT and another two-dimension data are utilized as the input. All four-dimension sensing data are utilized as the input.
By comparing and analyzing the above experimental results, the performance of the proposed RUL prediction method will be evaluated. It is expected that the proposed method can achieve better prediction result. For the first kind of implemented experiment, which utilizes only EGT as the input of GPR, experimental results are given in Figure 4.

RUL prediction result with only EGT parameter using GPR.
The dot line and the star line represent the actual RUL and the predicted RUL, respectively. In general, the curve of the predicted RUL has the feature of drastic change. Most of the predicted RUL values are far from the actual RUL values. Especially at the 13th current cycle, the prediction value is −5 cycle, which means that APU has reached failure condition. The reason is that the data-driven GPR model only relies on the input data. If these data cannot denote the degradation of APU well enough at that moment, it may result in wrong prediction result. The aforementioned two metrics for evaluating the prediction result are calculated as follows


For the second kind of implemented experiment, which utilizes two-dimension sensing data as the input of GPR, three experiments are carried out. The utilized input data for RUL prediction include three kinds of combination, including EGT and BF, EGT and BAP, and EGT and GOT. As the same in Gorinevsky et al., 38 the experimental results of the first combination are illustrated in Figure 5.
RUL prediction result with EGT and BAP using GPR.
Compared with Figure 4, the predicted RUL of APU in Figure 5 has relatively small change. But, at the beginning and the end of prediction, the predicted RUL values are far away from the actual RUL values. The two metrics of RUL prediction result in Figure 5 are given as follows


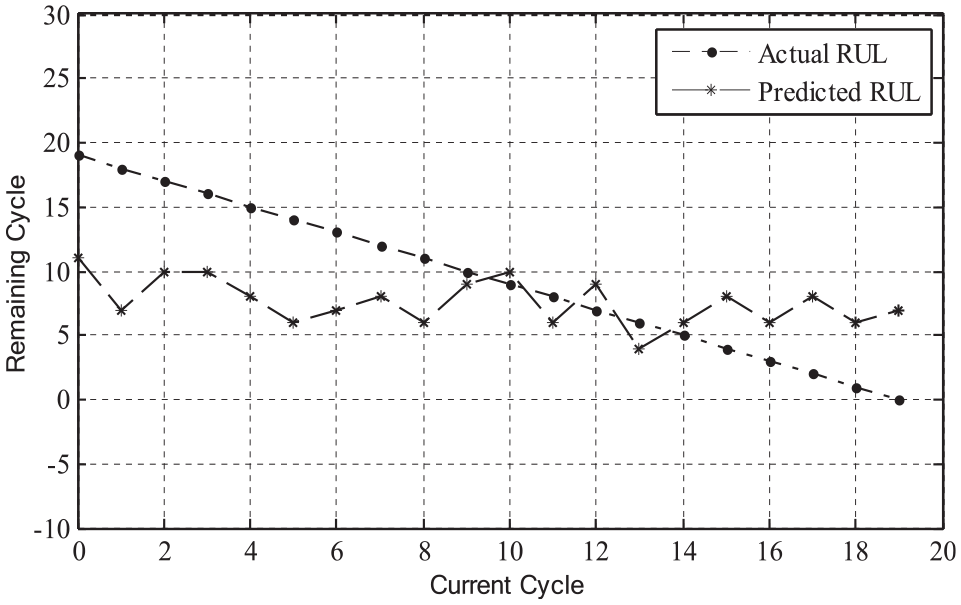
For the third kind of implemented experiment, which utilizes three-dimension sensing data as the input of GPR, three experiments are carried out. The corresponding input sensing data include (1) EGT, BF, BAP; (2) EGT, BF, GOT; and (3) EGT, BAP, GOT. Here, only the experimental results of the third data combination are given in Figure 6.

RUL prediction result with three-dimensional input data using GPR.
Compared with Figures 4 and 5, the predicted RUL in Figure 6 is closer to the actual RUL, which means that the experimental results are more precise and stabler. The two metrics of RUL prediction result in Figure 6 are given as follows


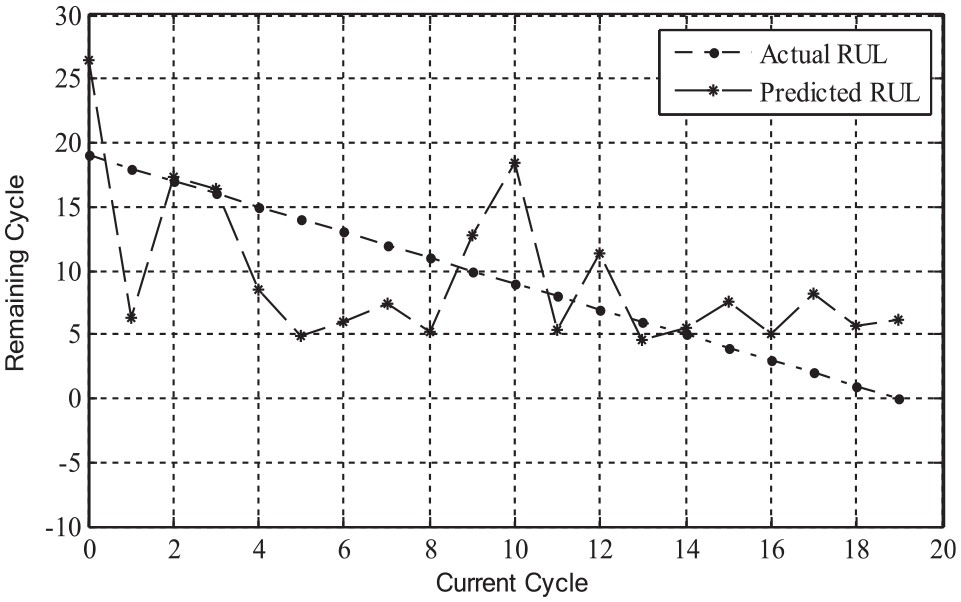
For the fourth kind of implemented experiment, all four-dimension sensing data are utilized by GPR. Experimental results are shown in Figure 7.

RUL prediction result with four-dimensional sensing data using GPR.
Compared with the above three figures, most of the predicted RUL values are smaller than the actual RUL values. There are also some minus RUL prediction results, as the situation in Figure 4. The two metrics of RUL prediction result in Figure 7 are given as follows


Finally, all the experimental results implemented with GPR for RUL prediction of APU are summarized in Table 3. As shown in Table 3, the minimum values of MAE and RMSE of RUL prediction result are 2.90 cycle and 3.59 cycle, respectively. The maximal values of MAE and RMSE of RUL prediction result are 8.10 cycle and 9.82 cycle, respectively, which is achieved by using four-dimension sensing data. Experimental results show that GPR can reach relatively better prediction results by the quantitative analysis between EGT and other two sensor data, which have larger mutual information with EGT.
RUL prediction result of APU using GPR.

RUL: remaining useful life; APU: auxiliary power unit; GPR: Gaussian process regression; MAE: mean absolute error; RMSE: root mean square error; EGT: exhaust gas temperature; BF: bleed flow; BAP: bleed air pressure; GOT: gearbox oil temperature.
RUL prediction of APU using RVM
Similar to the four kinds of implemented experiments in RUL prediction of APU using GPR, the input data for RUL prediction using RVM are carried out in this subsection. The dimension data for RVM are also from one to four, and the combination of input is same with the situation of GPR. Experimental results are compared and discussed in detail.
The sensing data adopted in Gorinevsky et al. 38 and Shannon 39 are also selected as the important comparison experiment. If the experimental results implemented by RVM can achieve relatively better prediction result, the adaptation and the scalability of the proposed method are verified at a large degree.
In the first experiment using RVM, only EGT is used to predict RUL of APU and experimental results are shown in Figure 8.

RUL prediction result with only EGT parameter using RVM.
For the experimental results illustration in this subsection, the curves have the same meaning with those in the “RUL prediction of APU using GPR” subsection. The predicted RUL in Figure 8 is a little bit far away from the actual RUL, especially at the beginning of prediction. The reason may be that RVM cannot reach effective performance when it only using EGT. Besides, the curves of predicted RUL in Figures 4 and 8 have similar change, which both utilizes only EGT. This verifies that data-driven method only mines the information contained in the sensing data. The metric values for measuring RUL prediction result which adopts only EGT using RVM are as follows


In the second experiment, two-dimensional data (i.e. EGT and BAP) are adopted as the input of RVM. The setting of this experiment is also same with the situation in Gorinevsky et al. 38 The only difference is that the prediction algorithm. Experimental results are shown in Figure 9.
RUL prediction result with two-dimensional data using RVM.
The variation of predicted RUL in Figure 9 is smaller than that in Figure 8. MAE and RMSE of RUL prediction result are as follows


In the third experiment, three-dimensional data (i.e. EGT, BAP, and GOT) are utilized as the input of RVM. Experimental results are provided in Figure 10.

RUL prediction result with three-dimensional data using RVM.
Compared with the above two experiments using RVM, the predicted RUL is obviously superior. MAE and RMSE of this experiment result are given as follows


In the fourth experiment, all four-dimension sensing data are adopted as the input of RVM. Experimental results are given in Figure 11.

RUL prediction of APU with four-dimensional sensing data using RVM.
Similar with the four-dimension input data using GPR, this experiment cannot achieve better result. The two metrics of RUL prediction result in Figure 7 are as follows


After implementing the above four experiments, the other four kind of sensing data combination for RUL prediction using RVM are also carried out. The details of experiments include two-dimension sensing data and three-dimension sensing data. The first two-dimension sensing data are EGT and BF. The second two-dimension sensing data are EGT and GOT. The first three-dimension sensing data are EGT, BF, and BAP. The second three-dimension sensing data are EGT, BF, and GOT. With the above four experimental results, all eight experimental results are given in Table 4.
RUL prediction result of APU using RVM.

RUL: remaining useful life; APU: auxiliary power unit; RVM: relevance vector machine; MAE: mean absolute error; RMSE: root mean square error; EGT: exhaust gas temperature; BF: bleed flow; BAP: bleed air pressure; GOT: gearbox oil temperature.
The minimum values of MAE and RMSE of RUL prediction among these eight experiments are 3.19 cycle and 3.79 cycle, respectively. The largest values of MAE and RMSE are 5.85 cycle and 7.12 cycle, respectively, when the sensing data input are EGT and BF. Compared with these two values, the minimum MAE and RMSE are reduced by 45% and 47%, respectively. The minimum values MAE and RMSE are also achieved by utilizing the same three-dimension input data, which are EGT, BAP, and GOT. Experimental results show that RVM can reach relatively better prediction results by the quantitative analysis between EGT and other two sensor data, which have larger mutual information with EGT.
Experimental results discussion
As shown in Table 2, among the four-dimensional sensing data of APU, their relationship of EGT with BAP and GOT is stronger than it with BF. Five insights can be found by analyzing the numerical values in Tables 2–4.
For the two-dimensional sensing data experiments using GPR and RVM, the relatively optimal results of RUL prediction are both achieved by using EGT and BAP.
For the three-dimensional sensing data experiments using GPR and RVM, the relatively optimal results of RUL prediction are both achieved by using EGT, BAP, and GOT.
To summarize the first and the second insight, the on-wing sensing data which has the largest mutual information with EGT help improve RUL prediction of APU. Based on these two-dimensional sensing data, another on-wing sensing data which have the second largest mutual information can help improve RUL prediction of APU in further. Therefore, the claimed C in section “The proposed RUL prediction method for APU” can be determined by the ratio of the second largest mutual information over EGT itself.
Compared with the existing research which only utilizes EGT for APU degradation analysis, the performance of RUL prediction can be improved with the help of other on-wing sensing data. This has been realized by the proposed method in this study.
For RUL prediction of APU, the proposed data-driven methods based on GPR and RVM are applicable. This insight not only helps to realize RUL prediction of APU, but also provides valuable reference for implementing the similar object.
Conclusion and future work
In this article, we study the on-wing RUL prediction of the aircraft APU. The utilization of mutual information provides the quantitative analysis of the on-wing sensing data, which can help improve the prediction result at a large degree. We also prove that GPR and RVM are available for RUL prediction of APU, which has the sparse dimension feature. By using the cross-validation, the relatively optimal results of RUL prediction are both achieved by the same combination of the on-wing sensing data. There is indeed the quantitative threshold of correlation between EGT and other sensing data to help improve the RUL prediction result. By the implemented experiments, the BAP and GOT can bring positive impact and can be regarded as the input for RUL prediction of APU. The future work will focus on how to automatically determine the dimension sensing data for achieving the optimal RUL prediction results.
Footnotes
Handling Editor: James Baldwin
Declaration of conflicting interests
The author(s) declared no potential conflicts of interest with respect to the research, authorship, and/or publication of this article.
Funding
The author(s) disclosed receipt of the following financial support for the research, authorship, and/or publication of this article: This work was supported in part by the National Natural Science Foundation of China under Grants 61803121 and 61771157, China Postdoctoral Science Foundation under Grant 2019M651277, and ROOTCLOUD Experiment Test and Validation Environment of Industrial Internet Platform Supported by 2018 Innovation and Development Project of Industrial Internet, and the Fundamental Research Funds for the Central Universities (Grant No. HIT. NSREF. 2020011).