
Abstract
Current displacement measurement methods cannot cope with the demands of the long-term measurement of small- or medium-span concrete bridges because of some technology or economic challenges. In this article, a displacement measurement method is proposed for concrete bridges based on fibre-reinforced polymer-packaged optical fibre sensors. The sensing principle and manufacture process of the proposed sensor are introduced as well as the strain sensing property. Then, a relationship is established between the strain and the displacement based on the distributed strain monitoring. Finally, some field tests are implemented using a simply supported concrete bridge. The tests include static loading test, dynamic loading test with specific speeds and dynamic random traffic loading test. The field test results show that the proposed method can measure the displacement of concrete bridges under traffic loads with reasonable accuracy. Moreover, different types of sensor distributions are proposed to investigate the displacement measurement effects to optimise the sensor installation. Although the sensors cover only some key parts of the girder, the results also verify the accuracy of the proposed method. Therefore, the proposed method can be implemented in concrete bridges in future.
Introduction
Concrete bridges are mostly used for transportation infrastructure in China because of their low cost, high durability and excellent mechanical performance. However, they often undergo structural performance degradation because of some factors that can affect bridge safety, such as overloading and environmental erosion. Therefore, the long-term measurement of some key structural parameters is considered as an essential means of ensuring safety.1–3
Concrete bridges with small- or medium-span length are the commonest bridges usually constructed. Their vertical displacement under traffic loads is usually selected as a critical parameter for evaluating bridge performance. This is because vertical displacement can easily be used to assess the structural performance based on the design code. Another reason is that it can be measured by simple methods such as linear variable differential transformer (LVDT) 4 and global positioning system (GPS). 5 However, it is difficult to measure the displacement of bridges with small- or medium-span length on a long-term basis, as each of the common traditional methods6–11 has some defects that can affect their performance.
Several types of sensing technologies are used for displacement measurements. Although all the technologies have some unique advantages, they also have some disadvantages that significantly prevent their application in small- or medium-span concrete bridges. For LVDT, an additional scaffold is required to support the displacement transducers or a line to pull the displacement transducers. Since there is often a road or river under the bridge, the scaffold or line significantly influences the traffic under the bridge when the displacement measurement system of LVDT is applied for a long time. 4 Moreover, for GPS, the actual static accuracy of vertical displacement is only ∼20 mm, 5 whereas the significant vertical displacement of the small- or medium-span concrete bridge is only ∼1–2 mm under a massive truckload. Thus, it is difficult to use GPS to successfully measure the displacement in this case, as it is partly limited by multi-path and cycle slips, low frequency of data and the need for good satellite coverage. 6 Furthermore, acceleration sensors cannot be used to measure the static displacement, and the accuracy of dynamic displacement is not sufficiently high because of the requirement of double integration. 7 For laser sensors, the accuracy of the long-distance measurement needs to be improved to measure the bridge displacement correctly.8,9 For vision sensor, although the measurement accuracy of the dynamic displacement can be up to several millimetres, it does not accurately measure the displacement of the small- or medium-span concrete bridge. 10 Meanwhile, some improvements have been made for the radar sensor. 11 However, the actual effects of long-term monitoring need to be further verified.
Besides the methods described above, several displacement measurement methods have also been developed based on strain sensors because of their low cost and easy application.12–15 Since strain is directly related to displacement, the sensor is expected to measure the displacement by sensing the strain. As the traditional strain gauge length is only several centimetres, it is often referred to as a point sensor. The point sensor is significantly influenced by local conditions such as concrete cracks and sensor installation condition. Therefore, for some applications, the displacement measurement accuracy can be increased using strain measurements at specific points. Moreover, in actual field measurements, the long-term sensing performance of the traditional strain gauge is not often good as expected. Thus, distributed strain sensing technology has been significantly developed in recent years.16,17 Distributed long-gauge optical fibre sensors have been developed for concrete structures. They have excellent strain sensing property and durability. Moreover, their gauge length is usually up to 1 m such that they can accurately measure the average strain of the 1-m-long zone. In our previous research, we investigated the displacement measurement performance on the basis of long-gauge strain sensing by finite element model. 18
In this article, considering the advantages of strain sensor-based displacement measurement for small- or medium-span concrete bridges, the actual measurement effects of the concrete bridge displacement under traffic loads are studied based on long-gauge strain sensing in the field tests. Moreover, fibre-reinforced polymer (FRP)-packaged optical fibre sensor is introduced, including the sensing principle, manufacture process and strain sensing property. Furthermore, a relationship is established between the strain and the displacement, based on the distributed strain measurement. Finally, the actual monitoring effects are investigated by some field tests with a simply supported concrete bridge.
FRP-packaged optical fibre sensors
Long-gauge optical fibre sensors for concrete structure measurement
Fibre Bragg grating (FBG) technology is commonly applied for long-term measurement of concrete structures because of its advantages of sensing accuracy, data acquisition speed and multiplexing performance. In the sensor, light is reflected at the FBG location when it is transmitted within the optical fibre, as shown in Figure 1. From the reflected light spectrum, some particular peaks are observed, from which the central wavelength of the peaks can easily be obtained. Meanwhile, the central wavelength is related to the grating length. When the optical fibre is extended by some strain, the grating length and the central wavelength are increased. A linear relationship can then be obtained between the change in central wavelength and change in the strain of FBG, as shown in equation (1). In the equation,


Strain sensing principle of FBG system: (a) light transmission within the FBG system, (b) input light spectrum, (c) reflected light spectrum and (d) transmission light spectrum.
FBG sensors are often used to implement a type of distributed monitoring mainly because of their multiplexing performance, as shown in Figure 1(a). However, the sensors may not be able to detect damages such as concrete cracks at the locations where the FBG sensors are not installed. In other words, when local damage occurs during the sensor installation (Figure 2(a)), the strain measurements have limited structural information.

Strain measurements for concrete structure: (a) point sensing and (b) long-gauge sensing.
Some improvements have been proposed that the FBG sensor should be installed on a structural surface with two fixed points to implement remote gauge sensing for inhomogeneous materials such as concrete, as shown in Figure 2(b). The strain measurement from the FBG sensor with long gauge indicates the average structural deformation between the two fixed points. If the sensors can encompass the affected parts of the structure, sufficient damage information and other structural performance assessments can be obtained.
Long-gauge optical fibre sensors with FRP packaging
In this research, long-gauge FBG sensors were made using package method, based on distributed long-gauge sensing. Considering that long-term measurements are often required in the civil engineering field, FRP is usually selected as the primary package material because of its excellent durability, high strength, low density and excellent bonding performance with concrete. Additionally, FRP is a typical linear elastic material when one type of fibre is applied in one direction, so there is no additional residual deformation and no deformation lag to influence the strain measurement.19,20 In this article, the proposed long-gauge FBG sensor was made using basalt FRP as it is much cheaper than carbon FRP, and its mechanical and durability performance is better than that of glass FRP.
Figure 3(a) shows the structure of the proposed long-gauge FBG sensor. Two fixed points were located in one sensing gauge where the inner optical fibre was bonded with the outer FRP. Meanwhile, the optical fibre between the two fixed points was not bonded with the FRP. The strain along the optical fibre was even, and it reflected the average strain of the sensing gauge length. Meanwhile, the Bragg grating is usually set at the middle of the sensing gauge. Moreover, the sensing gauge length can range from 10 to 200 cm, whereas the diameter of the sensor can range from 2 to 20 mm. The sensor with a small diameter (Figure 3(b)) is often bonded on the structural surface, whereas the sensor with a large diameter (Figure 3(c)) is usually buried into the concrete. The number of FBG sensors for series connection can be up to 20 if necessary.
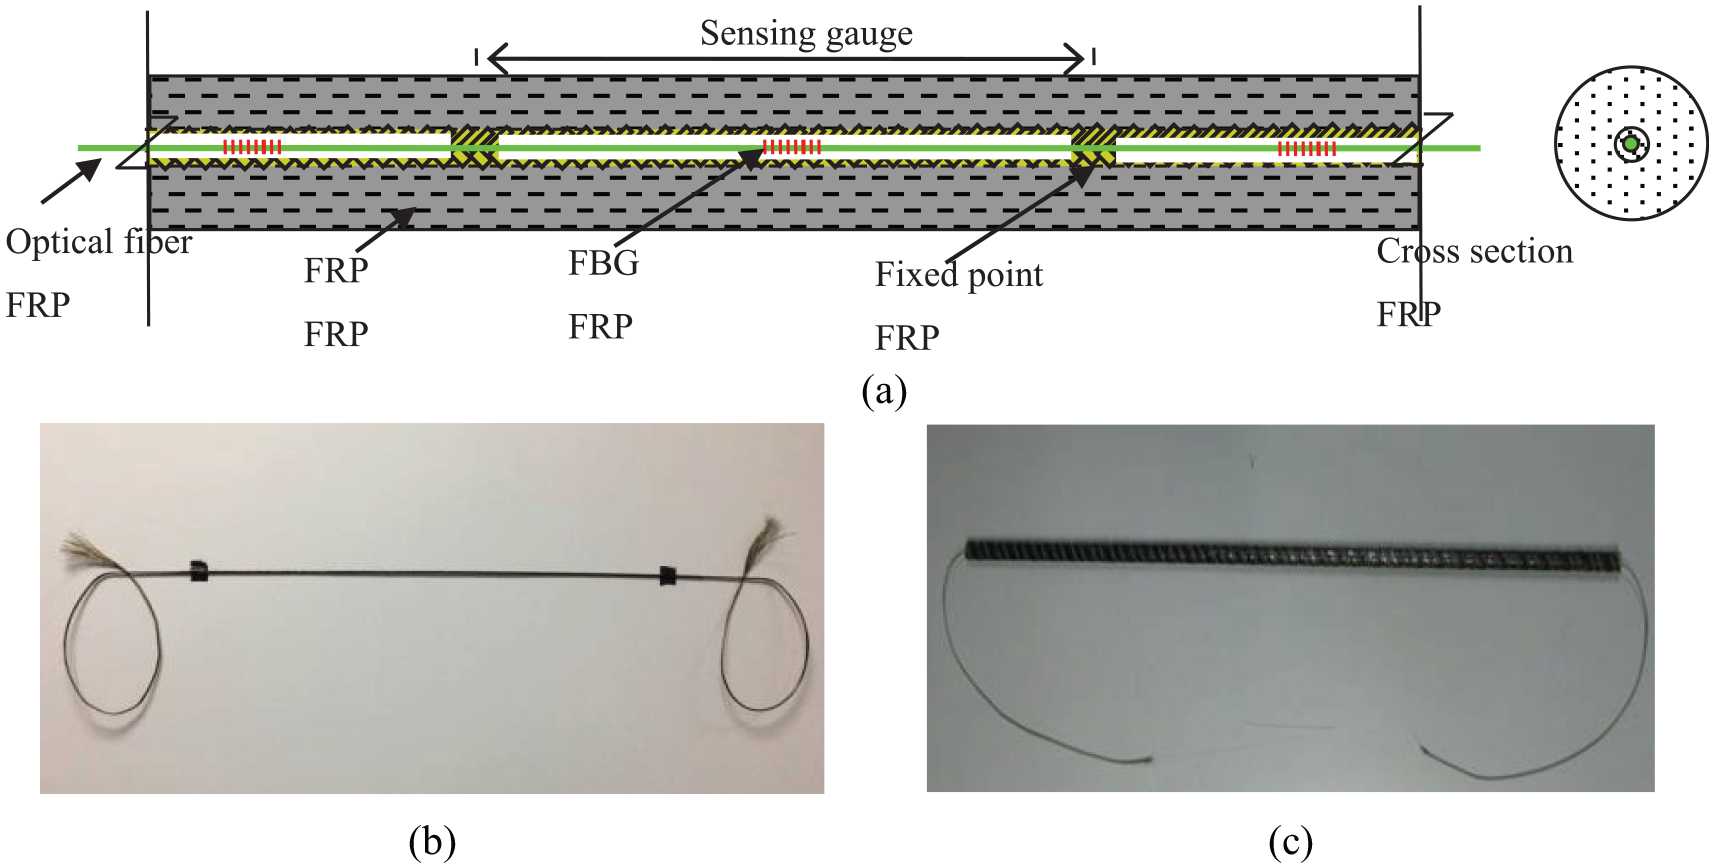
Long-gauge FBG sensors with FRP packaging: (a) structural diagram, (b) sensor of small diameter and (c) sensor of large diameter.
To further study the performance of the proposed sensor, some static experiments were implemented in the laboratory. Three specimens (Specimens 1–3) with a diameter of 10 mm were adopted in the experiments. As shown in Figure 4, the FRP-packaged sensor was 1.8 m long, whereas the 950 mm sensing gauge was located in the middle of the bar with two 50-mm-long bonding areas. Two steel anchors of ~250 mm length were installed on each side of the specimen with epoxy resin to perform the tensile test. An additional displacement metre with a sensing gauge of 200 mm was fixed on the surface of the specimen to measure the strain, which was considered as the average strain of the sensing gauge of the proposed FRP-packaged sensor. The data of the FBG were obtained using SM130 (Micron Optics, Inc.) with a strain sensing accuracy of about 2–3 μϵ.

Experimental specimen and setup.
During the experiments, two loading cases were applied: Case I, small strain and Case II, large strain. In Case I, the largest applied strain was ~200 µϵ with a loading step of ~20 µϵ, which was used to simulate the structural state before concrete cracking or in the early stage of cracking. In Case II, the largest applied strain was ~2000 µϵ with a loading step of ~200 µϵ, which was used to simulate the structural state after severe damages, such as large cracks and steel rebar yielding. For each case, the test was repeated three times.
Some typical strain sensing results were used to explain the strain measurement performance of the proposed FBG sensor, as shown in Figure 5. Meanwhile, the detailed results of the sensing properties are listed in Tables 1 and 2. From the results, some conclusions can be made: (1) there is a perfect linear relationship between the wavelength change of FBG and the applied strain; (2) there is excellent sensing repeatability as the most significant difference in the sensing property between the different specimens is 2.2%; (3) there is no noticeable difference in the strain sensing property between Cases I and II, as the largest difference is only 0.6%.

Typical strain sensing performance of Specimen 1: (a) small strain case and (b) large strain case.
Sensing property of the proposed sensors for small strain case (pm/µϵ).

Sensing property of the proposed sensors for large strain case (pm/µϵ).

Displacement assessment method based on distributed strain sensing
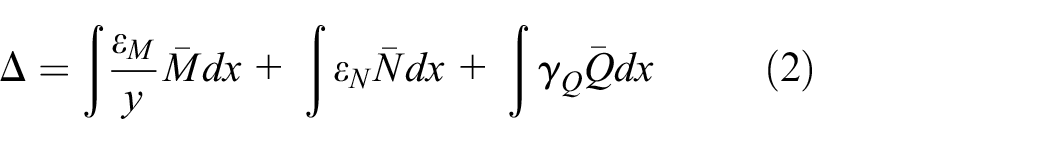
It is important to find a good relationship between the measured strain and the displacement. From classical mechanics, this relationship can easily be established as dummy unit load method or Maxwell–Mohr method, 21 given by equation (2)
where
Since the displacement of bridge girders under traffic loads is mainly caused by bending moments, the last two items can be ignored. In other words, the displacement caused by axial and shear forces was not considered in this article. Thus, the displacement can be expressed as

Considering the characteristic of the long-gauge sensing, equation (3) can be further expressed as

where
However, if the sensors cannot be installed to cover the entire beam, the strain distribution under traffic loads should be assessed based on some measured strain. Some methods such as linear interpolation can be used to calculate the strain, based on the measured strain. One of the main reasons why linear interpolation can be used in this case is that damages such as concrete cracks often happen locally. As most parts of the bridge are in the elastic state, the strain along the bridge is often distributed linearly under the traffic loads. The simply supported bridge explains the method. The method can also be used for other bridge types such as continuous bridge and arch bridge.
Experimental study on site
Experimental description
Description of the tested bridge
A typical bridge was selected to verify the effectiveness of the proposed method, as shown in Figure 6. The selected bridge is a simply supported bridge located in China National Highway 204 (G204) with daily movements of many heavy trucks. The section of the bridge is composed of 12 pre-stressed concrete girders, and the bridge surface is divided into three lanes, as shown in Figure 7(a). There are two directions, namely, the Yancheng and Nantong directions, as shown in Figure 7(b). Meanwhile, the structural composition for each direction is the same. Lane 1 is designed for cars or light trucks, whereas Lane 2 is designed for heavy trucks. Moreover, Lane 3 is referred to as emergency lane or pavement. Considering that heavy trucks usually cause the largest displacement, girder G6 was selected as the test girder for each direction.

Bridge condition: (a) side, (b) bottom and (c) surface.

Bridge size: (a) cross-section and (b) bridge surface.
Description of sensor installation
The length of the selected girder was 20 m and was divided into 20 elements. All the elements had an equal length of 1 m, as shown in Figure 8. For the tests, 18 sensors were prepared and installed on each girder to cover 18 elements of one girder, as shown in Figure 8. The FRP-packaged FBG sensor had eight sensing gauges of diameter ~10 mm and length ~8 m, as shown in Figure 8. Thus, one girder required two proposed sensors to cover the selected 18 elements. Therefore, four sensors were applied in the tests.
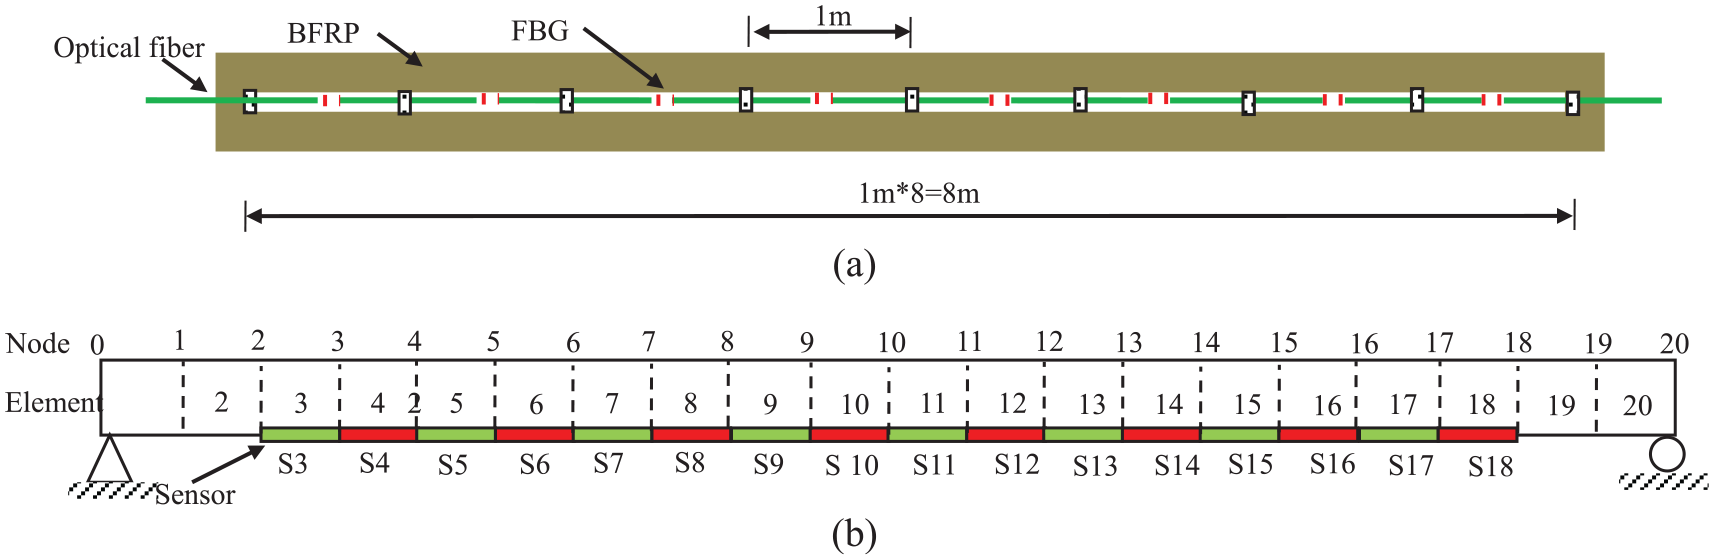
FRP-packaged FBG sensor and sensor distribution: (a) FRP-packaged FBG sensor and (b) element division and sensor distribution.
A groove was made at the bottom of the girder before the sensor was installed. The concrete was cut to form one groove with a depth of 20 mm and a width of 20 mm on the girder (Figure 9(a)). The resin was then filled into the groove (Figure 9(b)), and the sensor was inserted into the groove and fixed by clips (Figure 9(c)). Finally, the surface of the groove was smoothed and the optical fibre was inserted into the line box (Figure 9(d)). The resin was cured for at least 24 h before implementing the tests.

Sensor installation process: (a) making the groove, (b) filling resin into the groove, (c) burying and fixing the sensors into the groove and (d) smoothing the surface of the groove and inserting the optical fibre into the line box.
Description of loading cases
Some loading cases, including static loading test, dynamic loading test with specific speeds and dynamic loading test with random traffic loads, were used to investigate the effectiveness of the proposed method. For the first two loading cases, one truck loaded with sand and weighing ~25 t was applied. The distance between the two axles was 4.2 m.
In the static loading test, the truck was stopped at three different positions (Cases I–III), as shown in Figures 10(a)–(c). However, in the dynamic loading test with specific speeds, the same truck moved in Lane 2 with a speed of 30 or 60 km/h. For dynamic loading test with random traffic loads, traffic loads were applied, indicating that the weight and speed of the car were unknown and random. The two first loading cases were applied in the experiments. They were considered as a perfect loading condition to assess the method, whereas the last loading case was considered as the actual loading case.
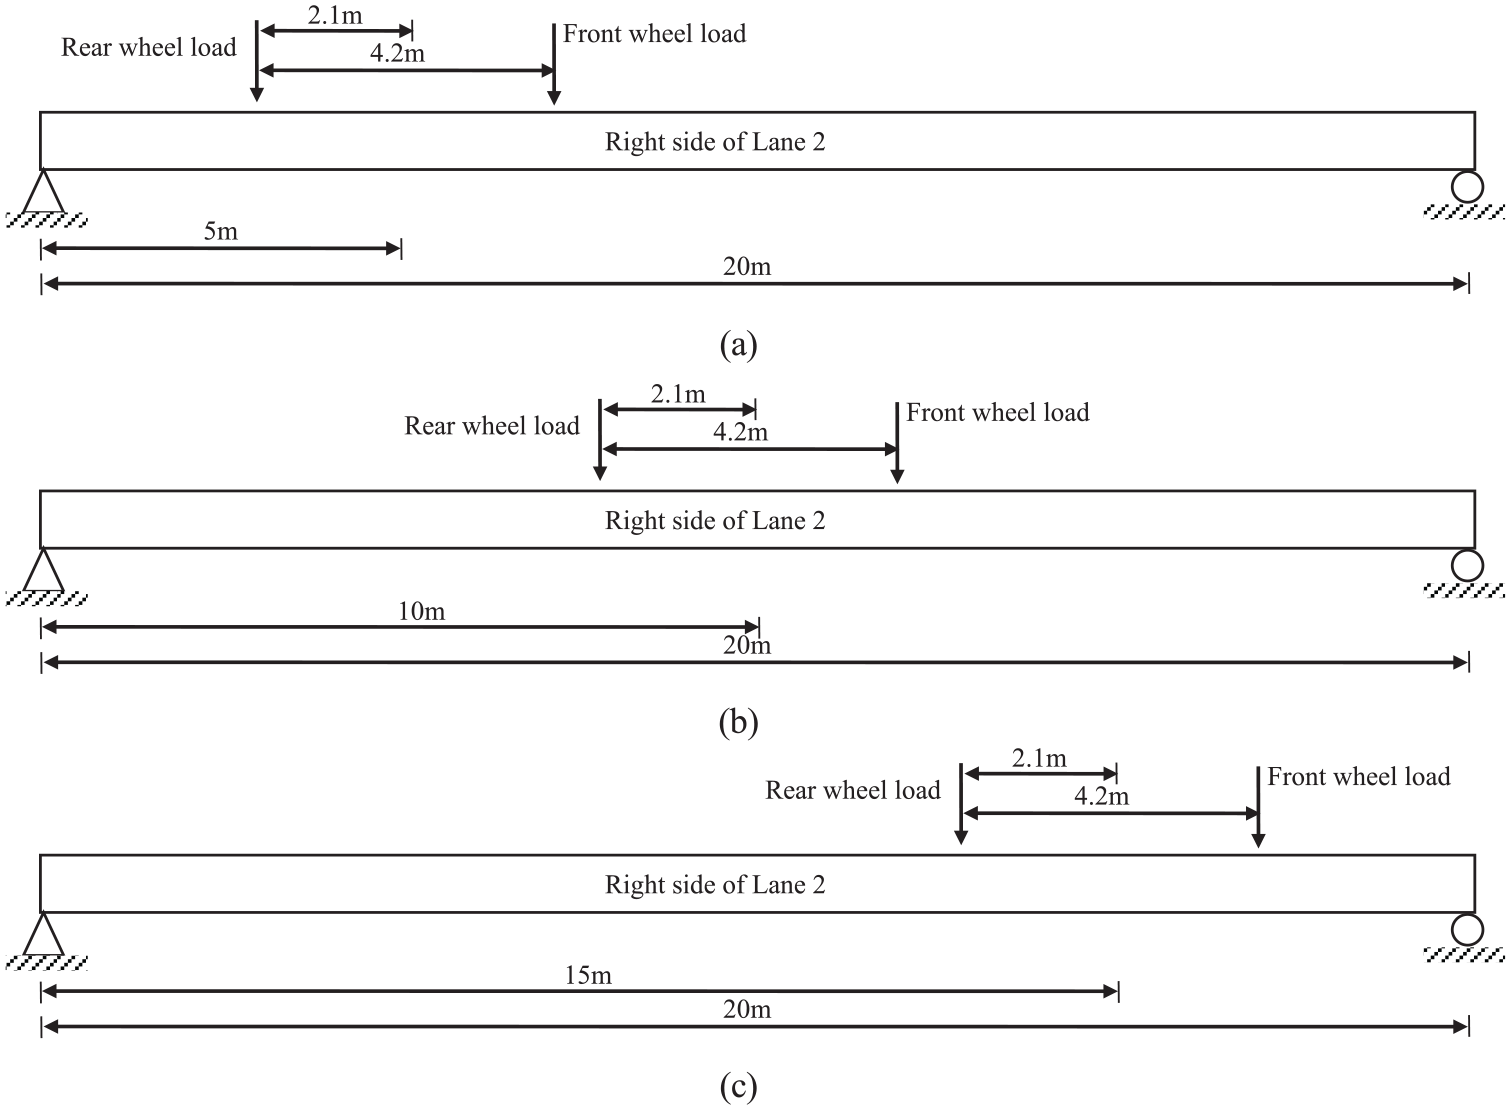
Load distribution of static tests: (a) Case I, (b) Case II and (c) Case III.
For comparison, a displacement transducer was used as the traditional displacement measurement method in the tests. Its displacement accuracy was 0.01 mm, whereas the displacement measurement range was 50 mm. The best sampling frequency of the displacement transducer can be up to 200 Hz. The transducer was installed in the middle of the girder, as shown in Figure 11. The sampling frequency was set at 500 Hz for both the FBG sensor, and the displacement transducer in the dynamic loading tests and 1 Hz for the static loading tests.
Displacement transducer distribution.
Results and discussion
Static loading test with experimental trucks
The strain distribution was measured by the FBG sensing system for the two tested girders, as shown in Figure 12. The strain indicates the average strain of the element the FBG sensor covers and the coordinate represents the position of the middle of the element. In Figure 12, the strain of some elements was assessed by the strain measurements of the adjacent element, namely, Elements 1, 2, 19 and 20. Meanwhile, the strain of Elements 3 and 18 was applied as the basis, using linear interpolation method. From the strain distribution, the position of the loading truck can be easily identified.
Results of strain distribution under static load: (a) Yancheng side and (b) Nantong side.
The main procedure for calculating the displacement is as follows: First, construct a simply supported beam model for the monitored deck and divide the beam model into several elements (Figure 8) to obtain the element length di. Second, calculate the neutral axis location yi for each element, using basic material mechanics. Third, calculate the virtual bending moment
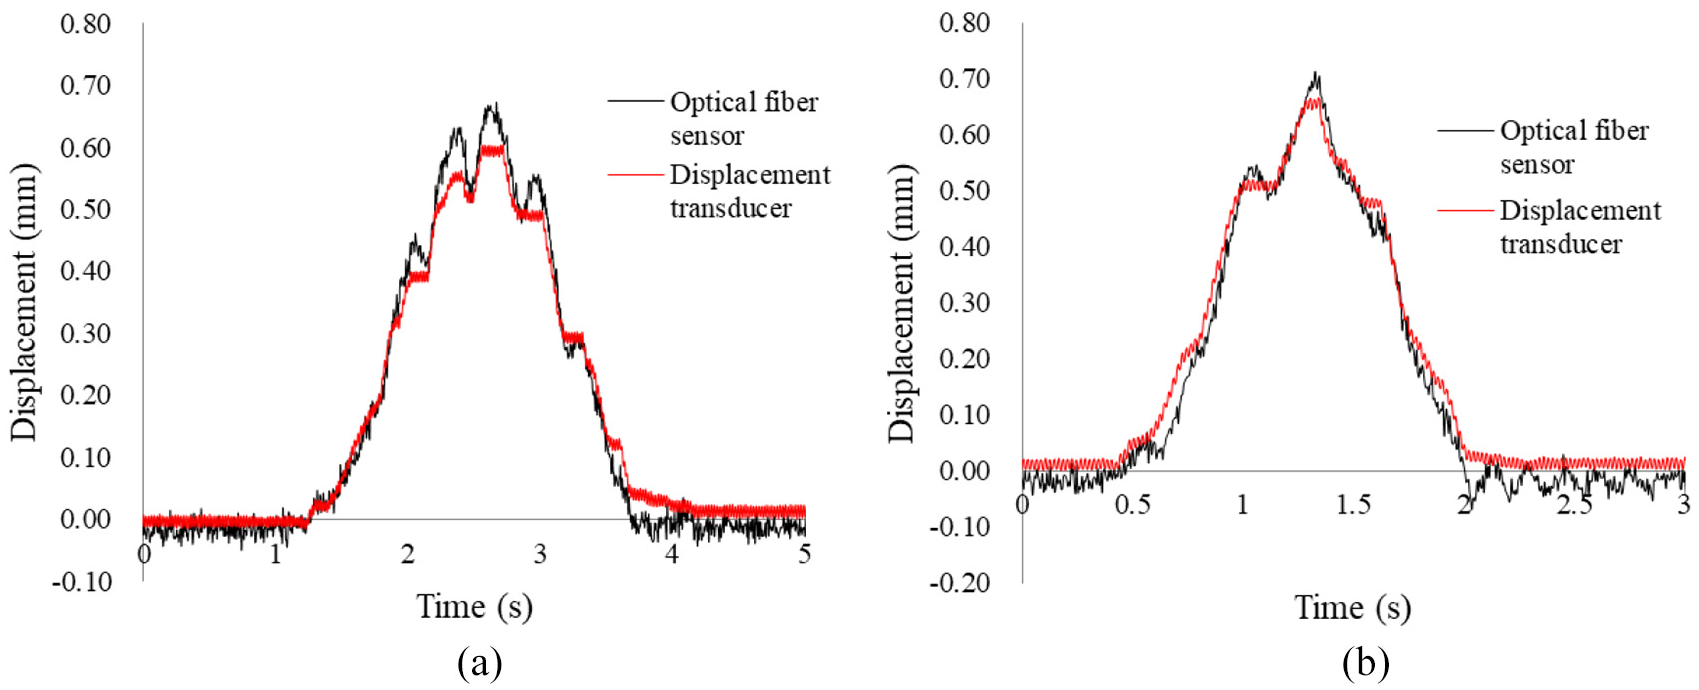
In this research, only the vertical displacement at the middle of the girder was calculated as the displacement transducer was set at the same position. The displacement at other positions can also be calculated with the equation and the strain distribution. Figure 13 shows that the displacement value calculated based on the strain measurement by FBG sensors is close to the value measured by the displacement transducer. Thus, the proposed method can accurately measure the static displacement of the medium-span bridge. Moreover, all the measurement errors were smaller than 0.1 mm, and the largest error was 0.05 mm.

Results of vertical displacement at the middle of the bridge span: (a) Yancheng side and (b) Nantong side.
Dynamic loading test with experimental trucks
When the test truck passed the bridge, the dynamic strain was measured using FBG sensors, as shown in Figures 14 and 15. A measurement noise of ~1 μϵ was observed. Moreover, the peak strain value was slightly larger than the strain value in the static loading test. Meanwhile, some differences exist in the strain–time relationship of the dynamic and static loading tests because of the difference in the truck speed. Moreover, the dynamic loading test had a more substantial strain value at a higher speed, especially for the Nantong side.

Typical strain results at Yancheng side under different truck speeds: (a) 30 km/h and (b) 60 km/h.

Typical strain results at Nantong side under different truck speeds: (a) 30 km/h and (b) 60 km/h.
The dynamic strain distribution was substituted into equation (4) to calculate the dynamic displacement. The strain of Elements 1, 2, 19 and 20 was also assessed with the strain measurements of the adjacent element as the static test. The results of the dynamic displacement at different speeds are shown in Figures 16 and 17 for Yancheng side and Nantong side, respectively. The results show that the displacement results from the FBG sensors are close to the value measured by the displacement transducer. Meanwhile, no slag was observed in the results, which is important for dynamic measurements. However, there were some obvious errors, of which the largest values occurred at the peaks. In the tests, the largest error was ~0.1 mm. Thus, there is no relationship between the measurement error and the vehicle speed.
Results of vertical displacement at the middle of the bridge span at Yancheng side under different truck speeds: (a) 30 km/h and (b) 60 km/h.

Results of vertical displacement at the middle of the bridge span at Nantong side under different truck speeds: (a) 30 km/h and (b) 60 km/h.
Dynamic loading test with random traffic loads
In actual measurements under traffic loads, the type, speed and weight of the car will be unknown. To further investigate the proposed method, some dynamic tests under random traffic loads were performed. In the tests, the strain was recorded at 8–10 min intervals, within which different types of vehicles such as small cars, buses, light trucks and heavy trucks may be observed. Different strain responses were observed under several types of vehicles, as shown in Figures 18 and 19.

Typical strain results at Yancheng side under random traffic loads: (a) whole record and (b) part of the record.

Typical strain results at Nantong side under random traffic loads: (a) whole record and (b) part of the record.
Moreover, the displacement was also calculated. As shown in Figures 20 and 21, some typical displacement results were selected to explain the displacement assessment accuracy of the proposed method, including large displacement, medium displacement and small displacement. These results show that the proposed method can measure the dynamic displacement under random traffic loads with reasonable accuracy. However, some obvious errors still exist, such as ~0.2 mm for large displacement, 0.1 mm for medium displacement case and 0.05 mm for small displacement. The difference in the errors may be caused by the strain sensing accuracy of the sensor, as it is well known that the absolute value of measurement error for most sensors increases when the value of the measured strain increases. The results also show that there is no slag in the dynamic displacement measurement even under free vibration. However, a more significant noise was observed for the optical fibre sensor compared with the displacement transducer. This is because some noise filtering methods were applied in the measuring system of the displacement transducer, whereas the noise has not been filtered in the optical fibre sensing system. If a noise filtering method is applied, the noise in the proposed method will decrease.
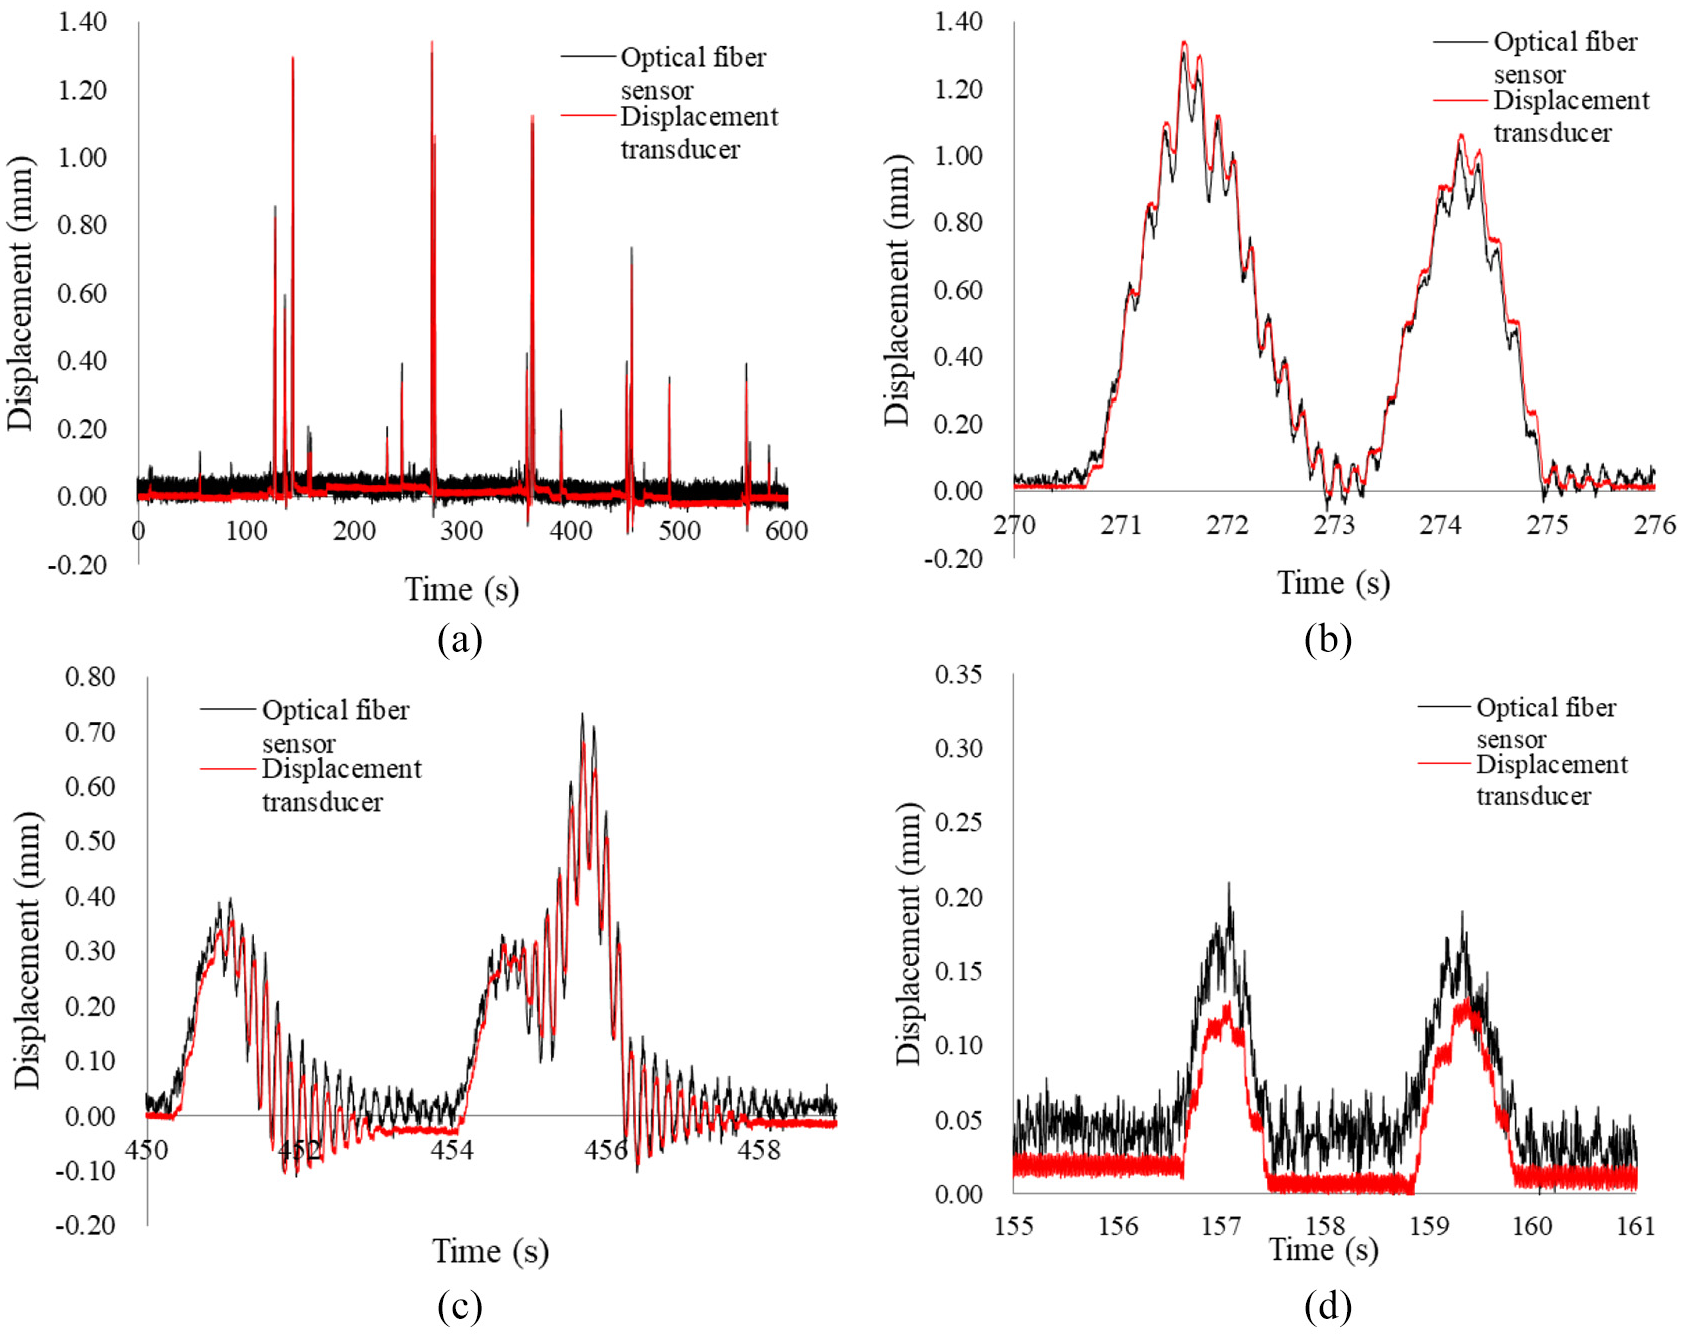
Results of vertical displacement at the middle of the bridge span at Yancheng side under random traffic loads: (a) whole record, (b) typical large displacement, (c) typical medium displacement and (d) typical small displacement.
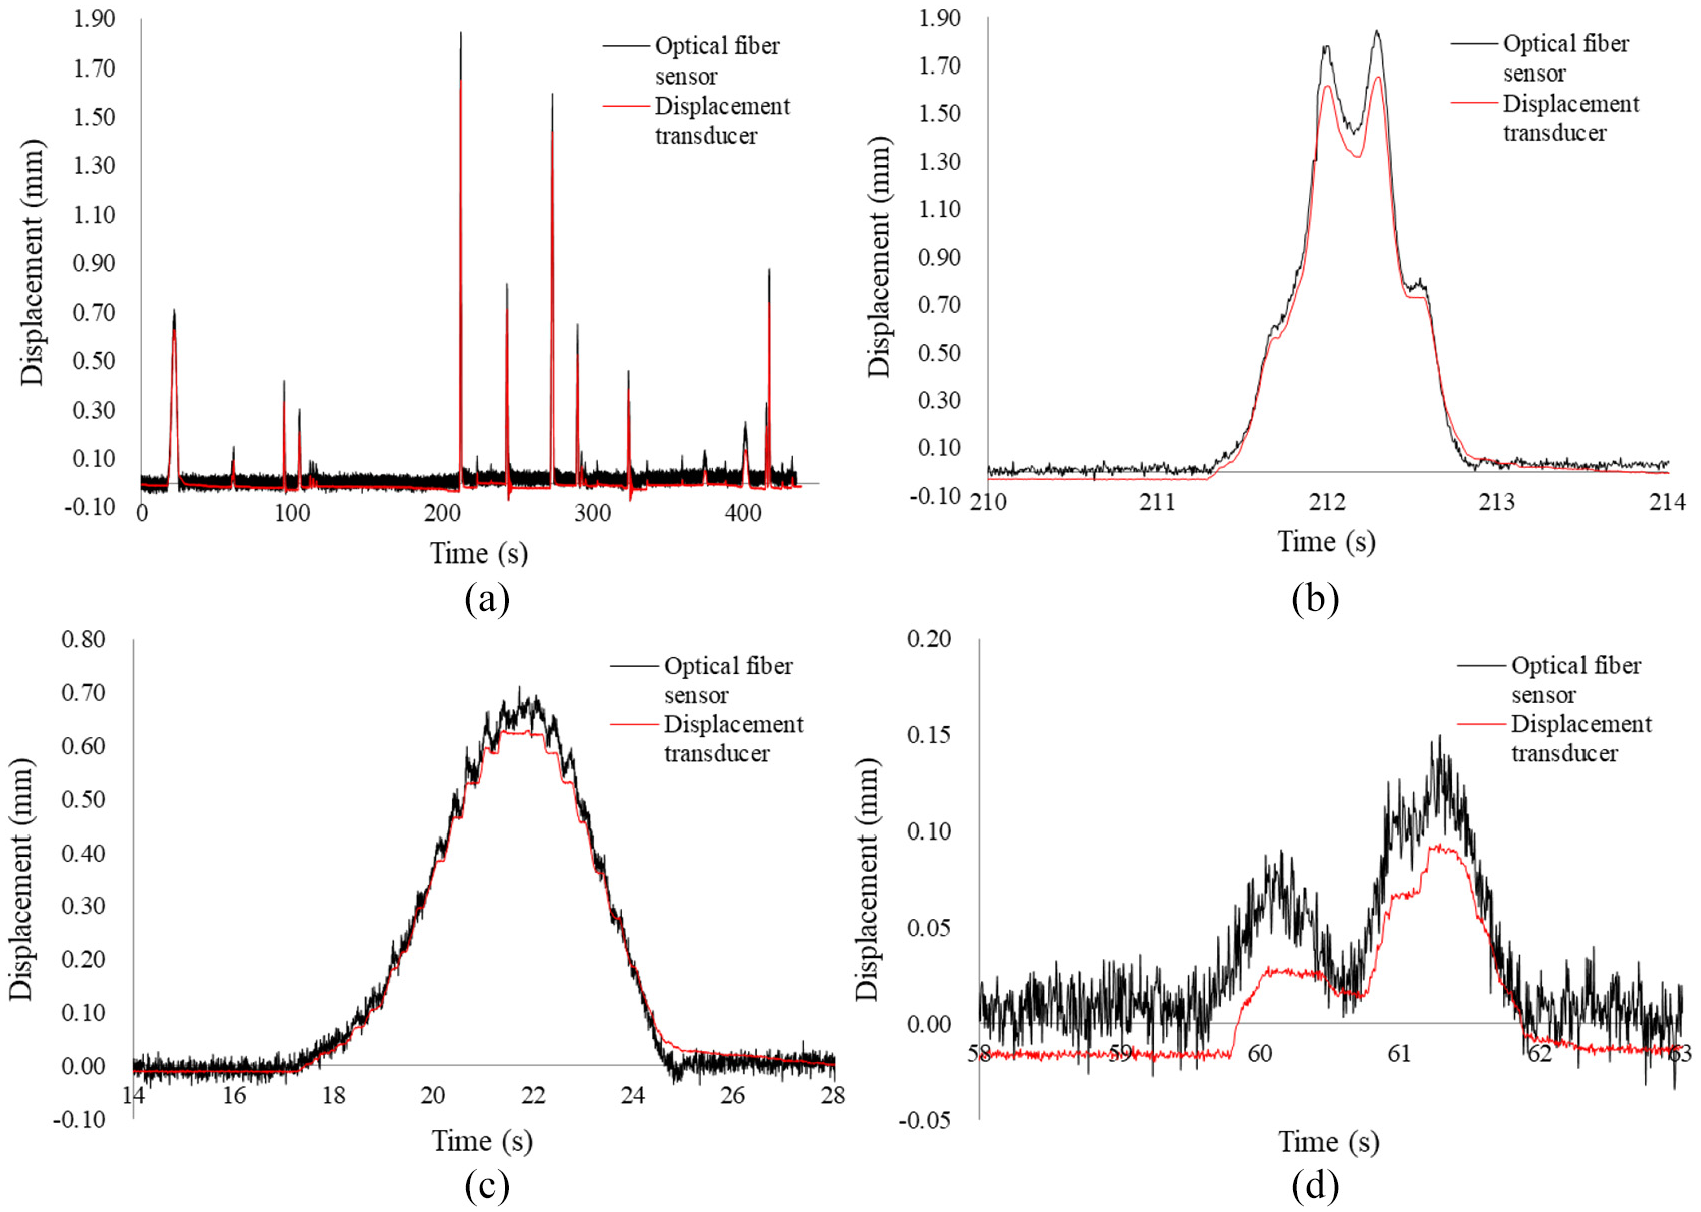
Results of vertical displacement at the middle of the bridge span at Nantong side under random traffic loads: (a) whole record, (b) typical large displacement, (c) typical medium displacement and (d) typical small displacement.
Analysis of optimising sensor distribution
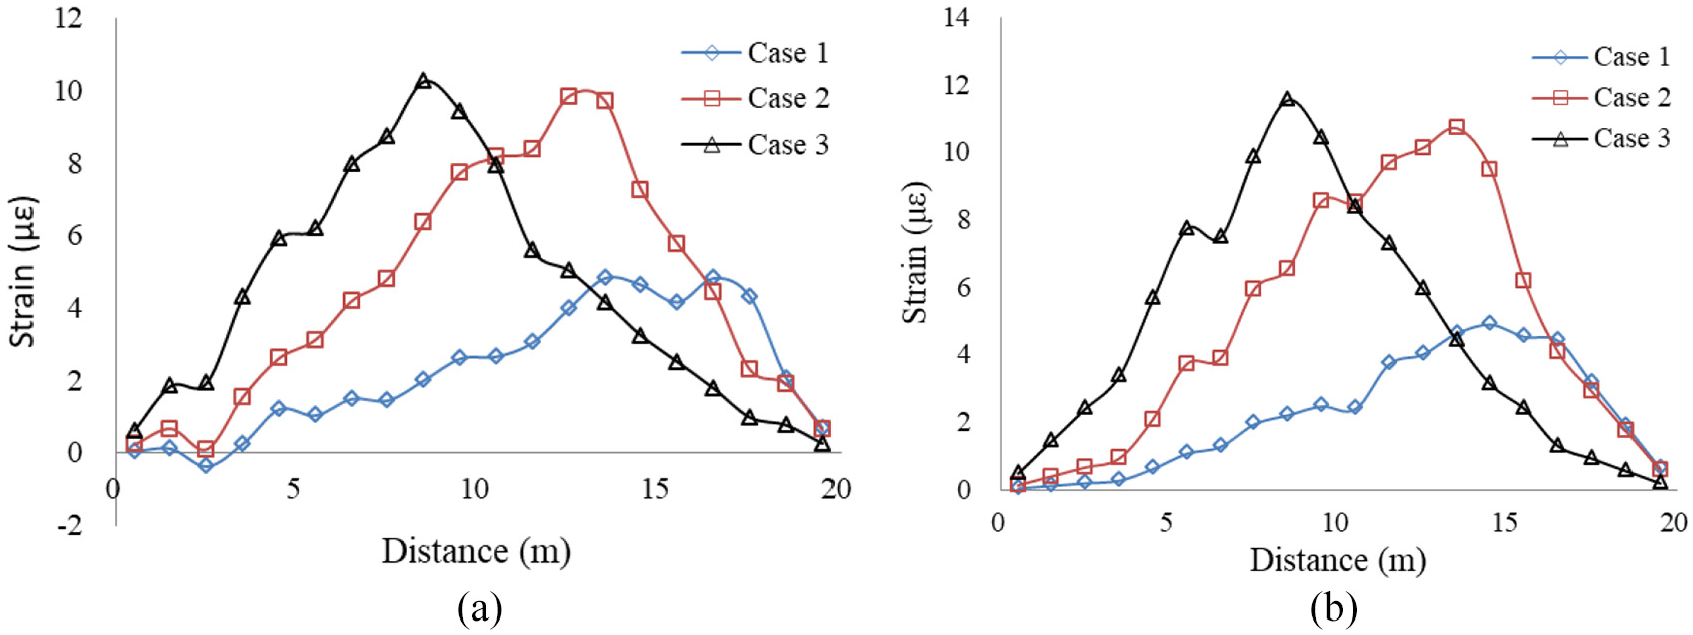
The strain distribution of the entire beam is required to calculate the displacement described by equation (4). This indicates that the sensors should be installed to cover the entire beam. However, this is often impossible. One reason is that the cost may be too high. For example, a 100-m-long bridge needs 100 sensors if the sensor gauge is 1 m. The cost may be as high as US$20,000, as one optical fibre sensor costs ~US$200. Another reason is that it is difficult to install the sensor in some unique parts. As shown in Figure 6, only 80% of the girder was covered by the sensors, as the parts at the two ends on the pier have insufficient space for the sensor installation. From the technical side, it may be unnecessary to measure the strain distribution of the entire beam. One reason is that the strain of some parts is small under traffic loads, thereby having an insignificant influence on the displacement calculation as far as the most substantial displacement response is concerned. For example, the accuracy of the strain measurement of the elements at the two ends may have only a small error in the calculation of the displacement at the middle of the bridge. Another reason is that there is some simple relationship between the strains of different elements under the traffic loads, which is easy to apply some mathematical method to evaluate the strain of the unmonitored element by the strain measurement nearby, such as linear interpolation. Therefore, if the condition is not satisfied, the sensors are not needed to cover all the girder length before the displacement can be measured. In other words, the sensor distribution can be optimised.
To investigate the effect of different sensor distribution, three types of sensor distribution were designed as shown in Figure 22, namely, Modes A, B and C. The strain of some critical parts were virtually measured, such as the area at 1/4 span, 1/3 span, 1/2 span, 2/3 span and 3/4 span, because the strain is often required in stress measurements. Compared with the sensor distribution in Figure 6, there are only 1/2, 5/16 and 3/16 times of sensors for Modes A, B and C, respectively. Meanwhile, the strains of all the elements are required to calculate the displacement using the proposed method. It was easy to obtain the strain of the element when the sensor was installed on the element. However, the strain of the elements on which no sensors were installed was calculated using linear interpolation. Meanwhile, the strain measurements of the adjacent sensors were applied as the basis of the calculation. Finally, the obtained strain distribution was substituted into equation (4) to calculate the displacement.
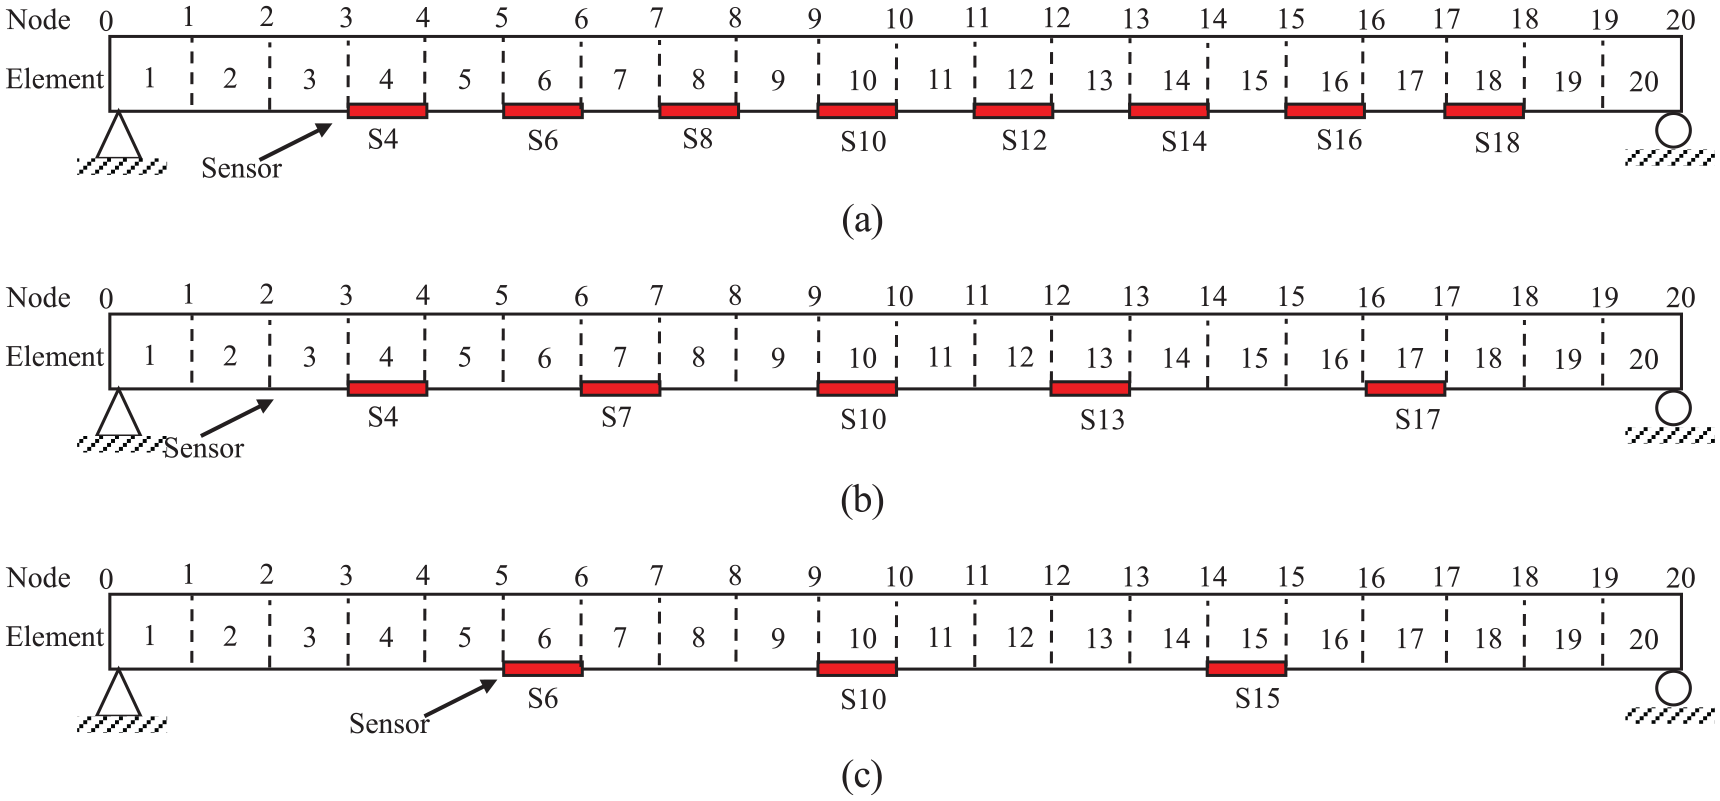
Different optimised sensor distribution modes: (a) Mode A, (b) Mode B and (c) Mode C.
In this article, the static loading and dynamic loading test with experimental truck at a speed of 60 km/h at Nantong side were used to investigate the effect of calculated displacement of different sensor distributions. Other test cases can also be applied to obtain the same conclusion. In Figure 23, the strain distribution of the static tests was listed as examples to explain the strain results. From the results, there were some differences in the strain results of some elements. However, the main shapes of the strain distribution at the three different sensor distribution modes were close to one another. Figures 24 and 25 show the displacement results of the static loading and dynamic loading tests, respectively. For the static loading test results, the errors were slightly larger compared with the results in Figure 13(b). Moreover, there was no obvious relationship between the number of sensors and the error value. However, the displacement measurement error was less than 0.1 mm, although there were only three sensors. For the dynamic loading test results, as shown in Figure 25, different observations were made. The largest errors at the displacement peak were within 0.1 mm for Modes A and B and ~0.2 mm for Mode C. Compared with the results in Figure 17(b), the displacement errors of Modes A and B were at the same level (0.1 mm), whereas the error of Mode C was slightly larger. Meanwhile, the results of Mode C can be accepted if the accuracy requirement is not as high as the standard requirement. Therefore, the proposed sensing method can be used to measure the displacement of a bridge under traffic loads with reasonable accuracy, based on the strain measurements of some key parts. Moreover, the measurement accuracy can be increased if a larger number of sensors are used.
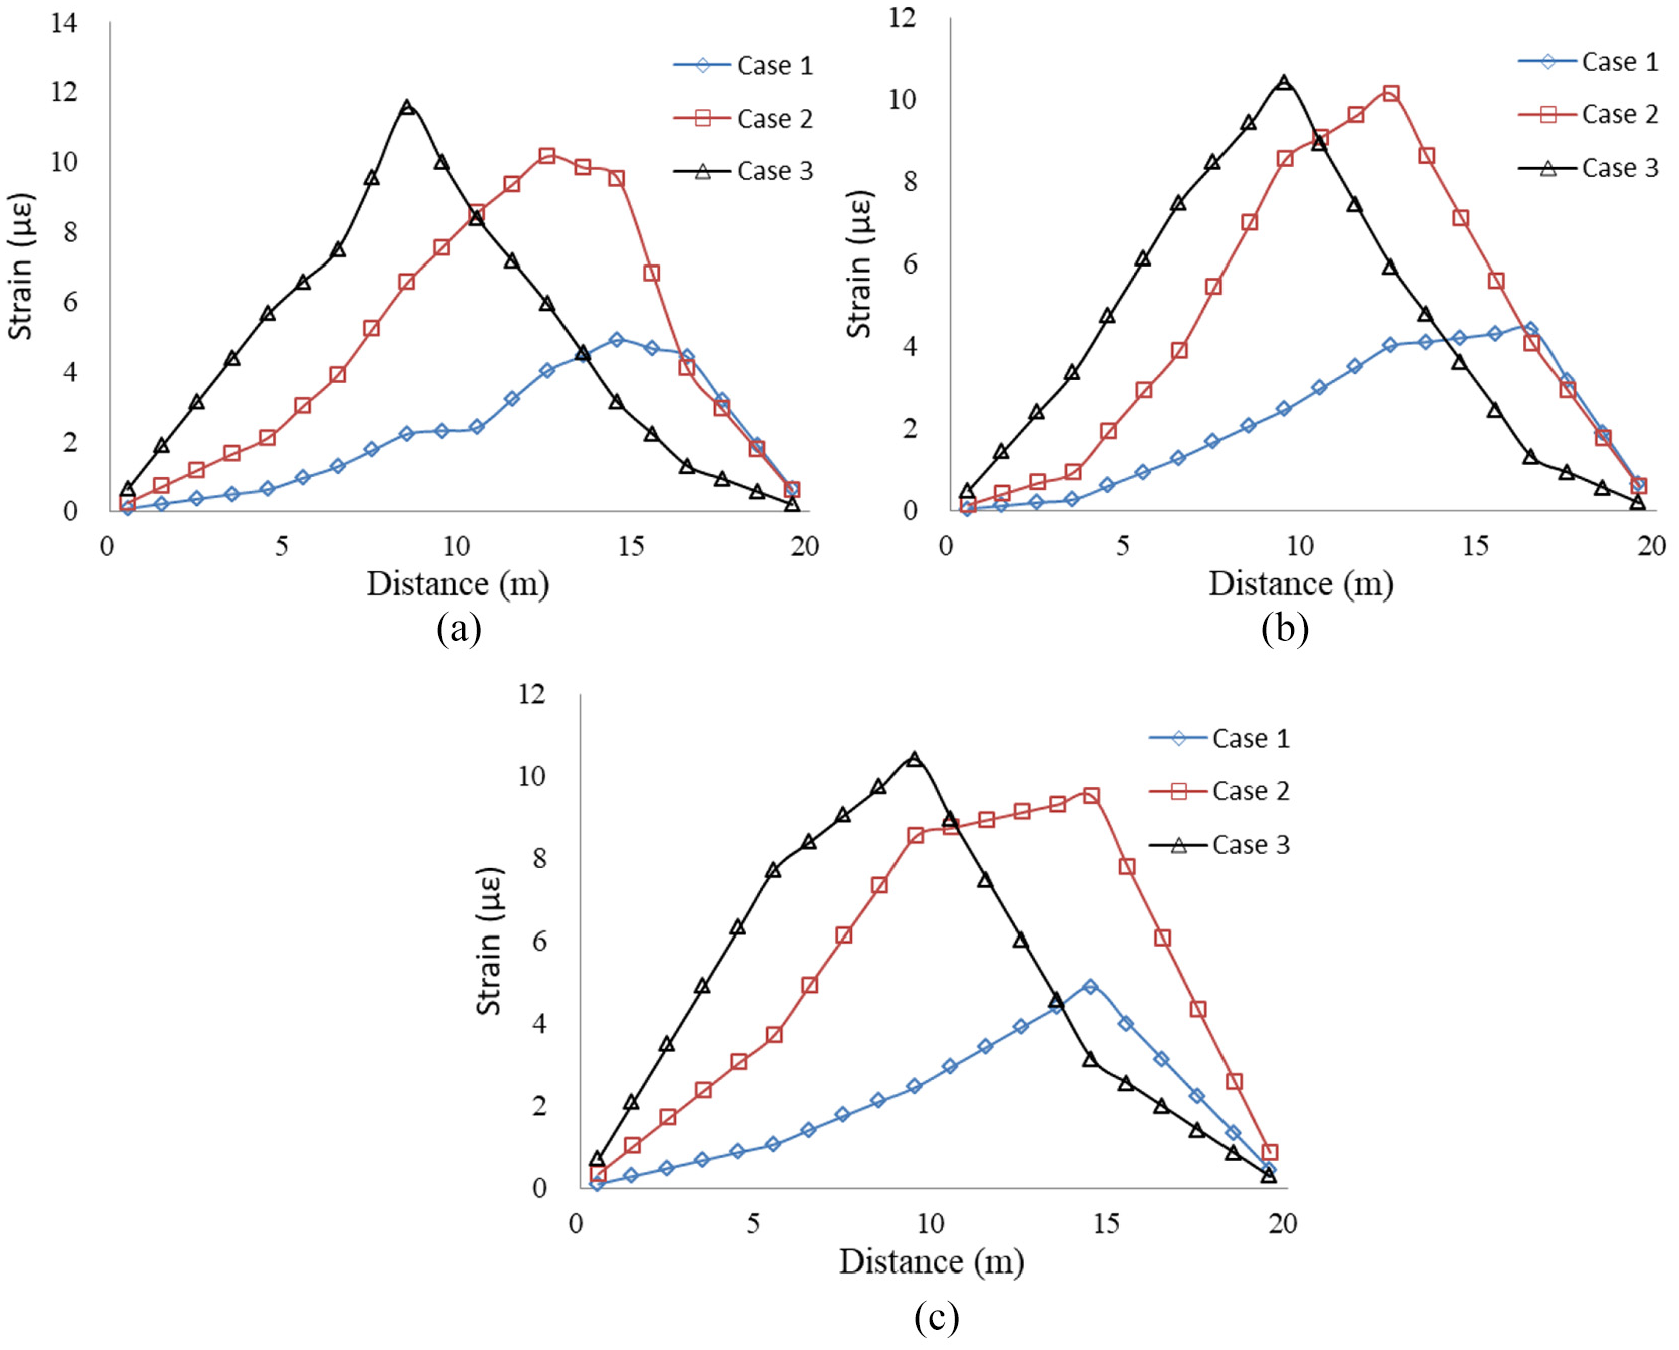
Static

Results of static vertical displacement at the middle of the bridge span with different sensor distribution modes.
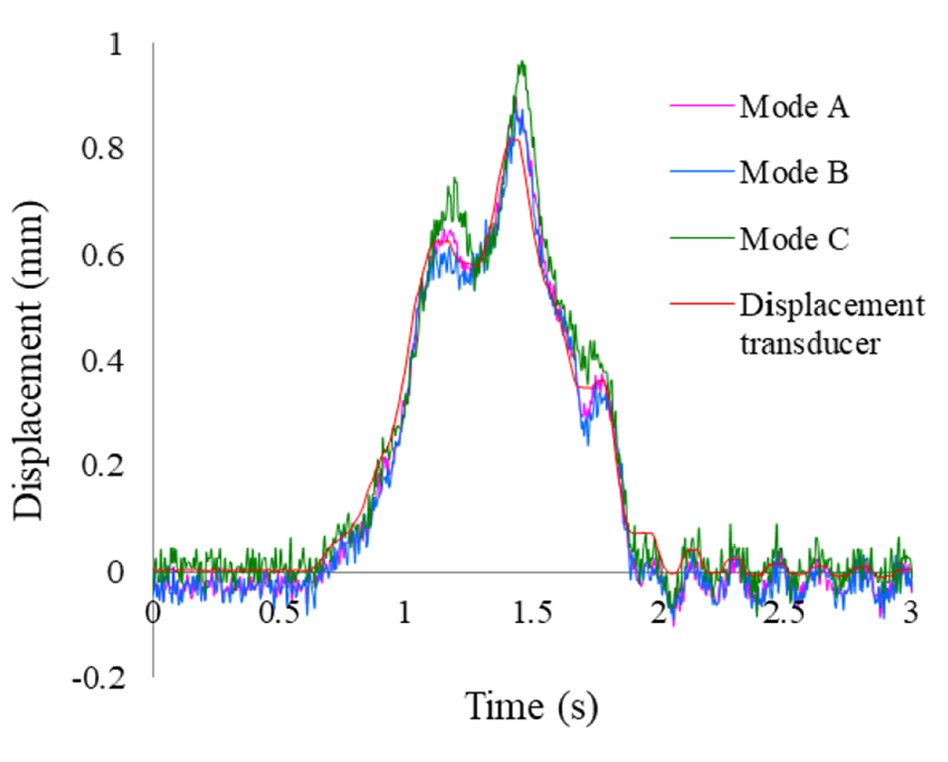
Results of dynamic vertical displacement at the middle of the bridge span with different sensor distribution modes under the loading case of 60 km/h speed.
Conclusion and remarks
In this article, a new method was proposed to calculate the displacement of a concrete bridge, based on strain sensing with long-gauge optical fibre sensor. Thus, the following conclusions were made:
The proposed FRP-packaged optical fibre sensor measured the average strain of the structural elements of a concrete bridge under traffic loads with high accuracy.
A relationship was established between the strain and the displacement not only for the simply supported bridge but also for some other types of bridge, such as continuous bridge and arch bridge. Meanwhile, the strain measurement is based on the proposed long-gauge strain optical fibre sensor.
The proposed method was used to calculate the displacement under traffic loads with good accuracy. The displacement measurement error was smaller than 0.1 mm when the displacement was within 1 mm. Meanwhile, it could be controlled within 0.2 mm if the displacement is up to 2 mm.
The displacement was also measured with good accuracy when the sensor covered some critical parts of the girder. If more sensors are used, better accuracy will be obtained.
However, further work still needs to be done in the future to make the proposed method more useful and applicable. First, different types of bridges, such as continuous bridge and arch bridge, should be investigated to further verify the proposed method. Second, the long-term measurement of field tests should be implemented to verify the proposed method under traffic loads. Third, some typical damages such as concrete cracks should be considered to verify the effectiveness of the proposed method.
This research is in its early stages. Because of the excellent properties of the proposed method, it can be applied in concrete bridges with small- or medium-span lengths.
Footnotes
Appendix 1
In this article, a simply supported beam was used to demonstrate how to use the proposed method to measure the vertical displacement based on strain measurement. The section is equal along the beam length L. There are four main steps in the calculation.
Handling Editor: James Baldwin
Declaration of conflicting interests
The author(s) declared no potential conflicts of interest with respect to the research, authorship and/or publication of this article.
Funding
The author(s) disclosed receipt of the following financial support for the research, authorship and/or publication of this article: This work was financially supported by the Fundamental Research Funds for the Central Universities (grant no. 2018B01014).