
Abstract
In order to comprehensively investigate the influence of the thickness of thin spray-on liners on their adhesive strength with different surrounding rock environments, pull-off tests were employed to measure the adhesive strength of thin spray-on liners of different thickness on the surface of various substrates (granite, sandstone, concrete, and coal), which were used to simulate different surrounding rock environments. The results indicated that the failure mode was mainly liner material–substrate adhesion failure when granite, sandstone, or concrete was used as the substrate, while substrate failure was observed to occur more frequently when coal was used as the substrate. The variation rules of the adhesive strength (σ) of thin spray-on liners, along with liner thickness (t), for different surrounding rock environments were obtained:
Introduction
Thin spray-on liners (TSLs) represent an emerging support technology that originated in Europe and the United States in the 1990s.1,2 For this technology, novel spraying materials with special mechanical properties are employed to rapidly form super-thin liners (<10 mm) that play a role in projects such as roadway support and sealing.3–6 In addition, TSL support technology has great significance for preventing mine disasters. First, a thin liner requires less material and thus dust production is greatly reduced compared with dry and wet spray concrete.7,8 Therefore, TSL is beneficial to workers’ health. Second, TSL displays better sealing performance once the material has cured and thereby effectively reduces the occurrence of accidents such as coal and gas outburst. Third, liner materials possess high tensile strength and display superior adhesion to substrate surfaces, which efficiently improves the stability of the surrounding rock. Therefore, TSL technology is gradually becoming one of the most important means of support by increasing the number of both domestic and foreign coal mining enterprises. 9
The effectiveness of TSL has been confirmed by researchers through both analytical and numerical methods.10–14 The adhesive strength between liner material and substrate was proposed by researchers to be one of the key parameters affecting the support effect.15–17 During the support process, the liner material is in close contact with the substrate surface. With sufficient adhesive strength, the liner material can transfer the load generated by gravity falls or loose substrate onto a stable or continuous substrate surface, avoiding possible injury to workers or damage to equipment caused by falling loose substrate. 18
The factors influencing the adhesive strength of liner materials have also been the focus of many scholars’ research.15,19–27 Achievements in understanding the influence of various factors on the adhesive strength of liner materials have been accomplished by researchers in various countries. Li et al. 23 carried out pull-off tests on liner materials adhered to both complete and fractured coal areas under different curing time conditions. It was found that the adhesive strength between the liner material and coal increased with longer curing time, and much higher adhesive strength was demonstrated with a complete coal area compared with a fractured coal area. Therefore, both curing time and substrate integrity were proposed to affect the adhesive strength of liner materials. Subsequently, Li et al. 28 investigated the influence of substrate strength and surface roughness on the adhesive strength of liner materials. Adhesive strength was observed to initially increase with increasing substrate strength before eventually stabilizing. Also, significantly higher adhesive strength was achieved when using a rough substrate surface than when using a smooth substrate surface. The adhesive strength was found to increase slightly with further increases in surface roughness. In addition to the aforementioned factors, according to a study carried out by Ozturk et al., Kendall and Yang et al.,29–31 the thickness of a liner material also affects its adhesive strength. An inversely proportional relationship between adhesive strength and the square root of liner thickness was identified. 29 Ozturk and Tannant 32 also conducted a study on the effects of substrate properties and surface contamination conditions on the adhesive strength of liner materials. Lower adhesive strength was observed on contaminated substrate surfaces, and a tensile strength higher than 2 MPa was required for the substrate to ensure good adhesion.
So, according to previous studies, the factors currently known to affect the adhesive strength of liner materials are substrate surface roughness, substrate material, curing time of liner materials, liner thickness, and environmental conditions. Despite these achievements, there are still some limitations of the previous research, which are as follows. (1) Most of the studies only included qualitative determinations of the influence of certain factors on the adhesive strength of TSL; quantitative research based on comprehensive experimental results is very rare. (2) The published research does not apply to coal mines. For example, Ozturk and Tannant 29 studied the influence of liner thickness on the adhesive strength of liner materials when applied to the surface of paving stone and granite, without measuring any data relevant to coal surfaces.
In addition, according to previous studies, vinyl acetate/ethylene (VAE) emulsion can significantly improve the mechanical properties of cement mortar, such as its adhesive strength and tensile strength.33–35 Therefore, in the current study, the liner material used was compounded with VAE emulsion, aluminate cement, and several additives (the composition and ratios are shown in Table 1; the main mechanical properties are shown in Table 2). This material is a non-reactive TSL and, compared with other TSLs, it has advantages of low cost and high adhesive strength.
Composition and ratio of material tested.

The solid content of VAE emulsion was 40%.
Main mechanical properties of the material tested.

Therefore, in this work, we focused on the influence of substrate material and liner thickness, two important factors affecting the adhesive strength of liner materials. The material described in Table 1 was used as the experimental material. A quantitative analysis, based on experiments, of the adhesive-strength variation rule of liner material, along with liner thickness, on various substrate materials under coal mine conditions was carried out. The findings will provide a theoretical guide for subsequent on-site practical applications of this novel material.
Experimental method
Preparation of substrate material
Considering the complexity of the geological conditions in coal mines and the feasibility of conducting experiments, and to simulate the actual underground spraying environment more realistically, the substrate materials selected were granite, sandstone, concrete, and coal (Figure 1). The reason for selecting concrete is that, in addition to the support effect, liner materials also act as a “double-sided glue” between shotcrete and surrounding rock in coal mines, ensuring better adhesion of concrete to the surrounding rock surface. 39 The tensile strength and surface roughness of each substrate were obtained from previous experiments (Table 3). Surface roughness was measured based on the constructed surface morphology by employing a Lycra three-dimensional shape measurement instrument (Figure 2).
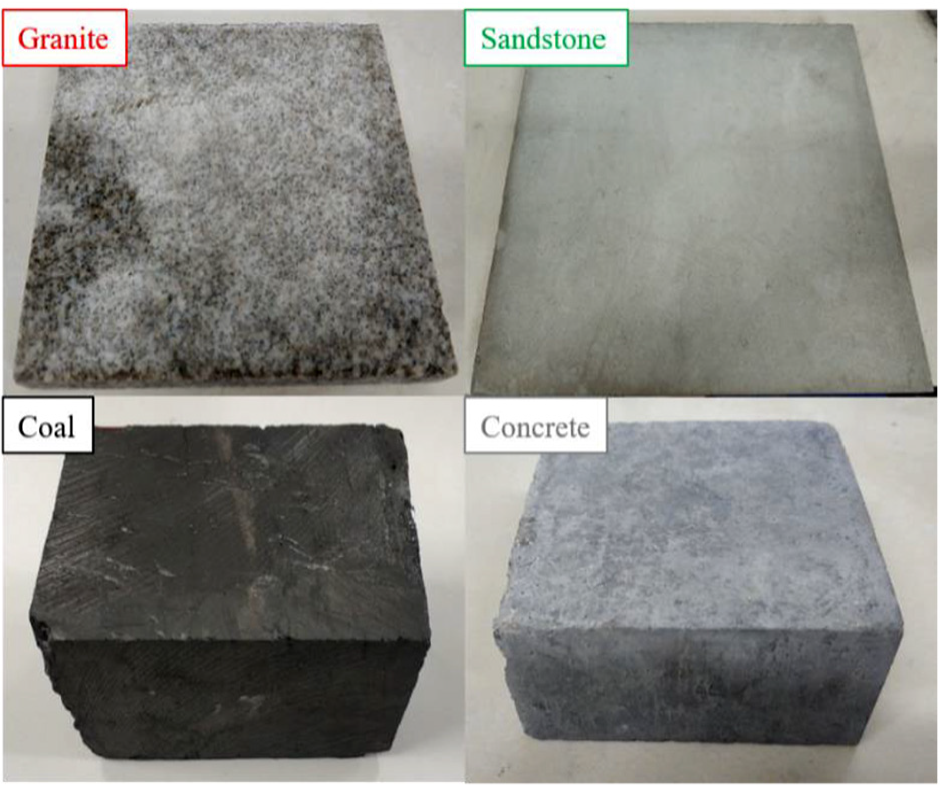
Various substrate materials.
Tensile strength and surface roughness of the substrates.


Lycra three-dimensional shape measurement instrument and the measurement of roughness (using granite as an example).
Preparation of TSL material
The TSL material was prepared according to the description in Table 1. During the mixing process, a small, variable-speed hand-held mixer was used for uniform stirring at a low speed. This helped to avoid bubble formation, from the introduction of excessive air, that would normally be induced by a high stirring speed, and therefore ensured the accuracy of the experimental results. The mixture was subjected to uniform stirring until all bubbles disappeared, and it was then immediately sprayed onto the substrate surface to prevent the liner material being exposed to the air for any length of time, which would result in solidification and agglomeration. 17
Sample preparation
The procedure for sample preparation is shown in Figure 3 (using granite as an example).

Sample preparation procedure: (a) Fixed acrylic plate; (b) Spraying TSL material; (c) Thickness control; (d) Take the mold off; (e) Apply epoxy evenly to the pull-off unit; and (f) Place the pull-off unit on the liner layer.
Fixed acrylic plate
A processed acrylic sheet was placed on a flat substrate surface and fixed in place with tape. This helped to prevent both movement of the sheet and the formation of large gaps between the sheet and the substrate surface during spraying, as both scenarios would result in diffusion of the material and reduced thickness (Figure 3(a)).
Spraying TSL materials
In the laboratory, liner materials are normally applied onto a rock surface through manual pouring.1,17,22,29,32 However, in field applications, liner materials are sprayed onto a rock surface using high-pressure air, which when compared with manual pouring leads to a different internal structure of the liner and enables easier permeation of liner materials into substrate fractures, thereby increasing the contact area. Therefore, a suitable laboratory spraying method would provide more scientific and accurate results regarding the adhesive strength of liner materials in field applications. In addition, considering the size of the experimental site and the feasibility of conducting experiments, instead of a powder jet machine, an air compressor and a spray gun (Figure 4) were used for spraying the liners. After thorough mixing, the liner material was poured into the spray gun and sprayed onto the substrate plane using high-pressure air (Figure 3(b)).

Process of spraying the liner material.
Thickness control
The liner thickness was strictly controlled because it is related to the adhesive strength of the liner material. The liner thicknesses currently applied in practice range from 1 to 8 mm.40,41 Therefore, eight sets of experiments were designed with liner thicknesses of 1, 2, 3, 4, 5, 6, 7, and 8 mm.
The liner thickness was controlled by placing acrylic sheets of different thickness (1, 2, 3, 4, 5, 6, 7, and 8 mm) onto the surface of each substrate material. Each acrylic sheet was machined with six cylindrical cavities, each with a diameter of 50 mm. The pull-off unit also had a diameter of 50 mm (Figure 5). After being sprayed onto the substrate surface, the liner material was then smoothed using a spatula to remove excess material while ensuring a uniform thickness (Figure 3(c)).
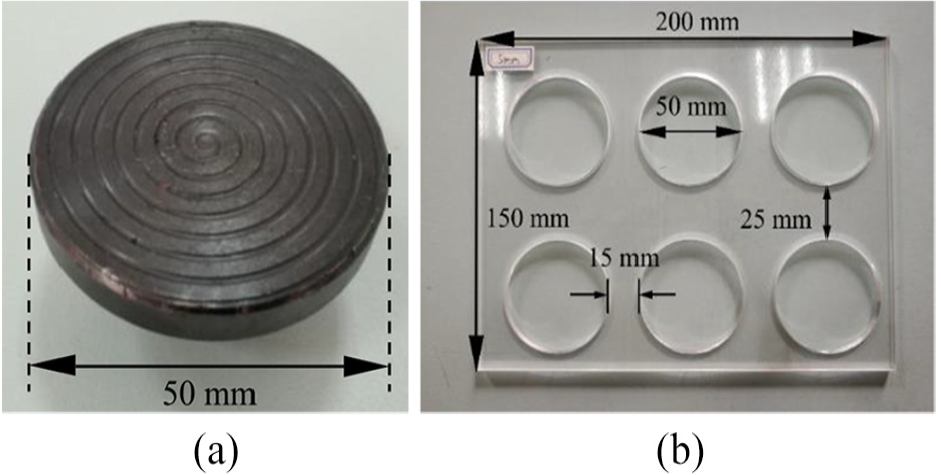
(a) Pull-off unit and (b) acrylic sheet mold.
Curing conditions
The curing conditions influence the adhesive strength. The variation of adhesive strength with temperature and humidity was obtained by experimentation (the curing time was 7 days, and the liner thickness was 5 mm), as shown in Figures 6 and 7. It can be seen from Figure 6 that as the temperature increases, the adhesive strength decreases; this is due to an increased number of cracks inside the material due to the thermal expansion effect, which weakens the adhesive strength. It can be seen from Figure 7 that as the humidity increases, the adhesive strength increases; this is because the higher the humidity, the lower the shrinkage rate of the material, reducing the tensile stress in the interface and improving the adhesive strength. All samples were cured under laboratory conditions with a temperature of around 20° C and relative humidity of around 60%.29,32
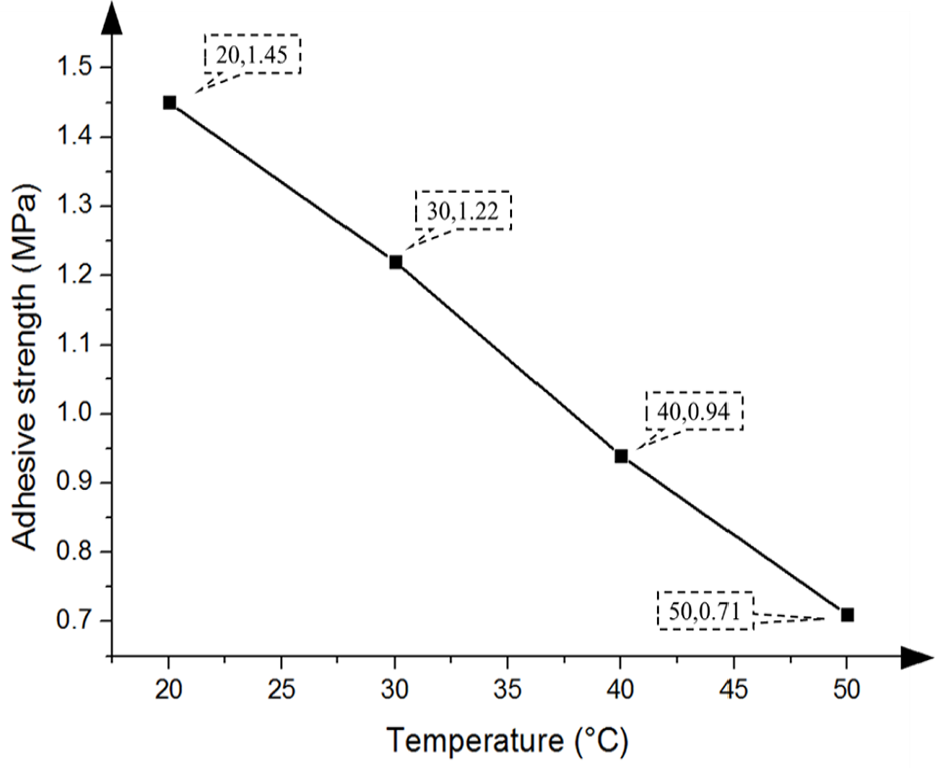
Variation of adhesive strength with temperature (relative humidity 60%).
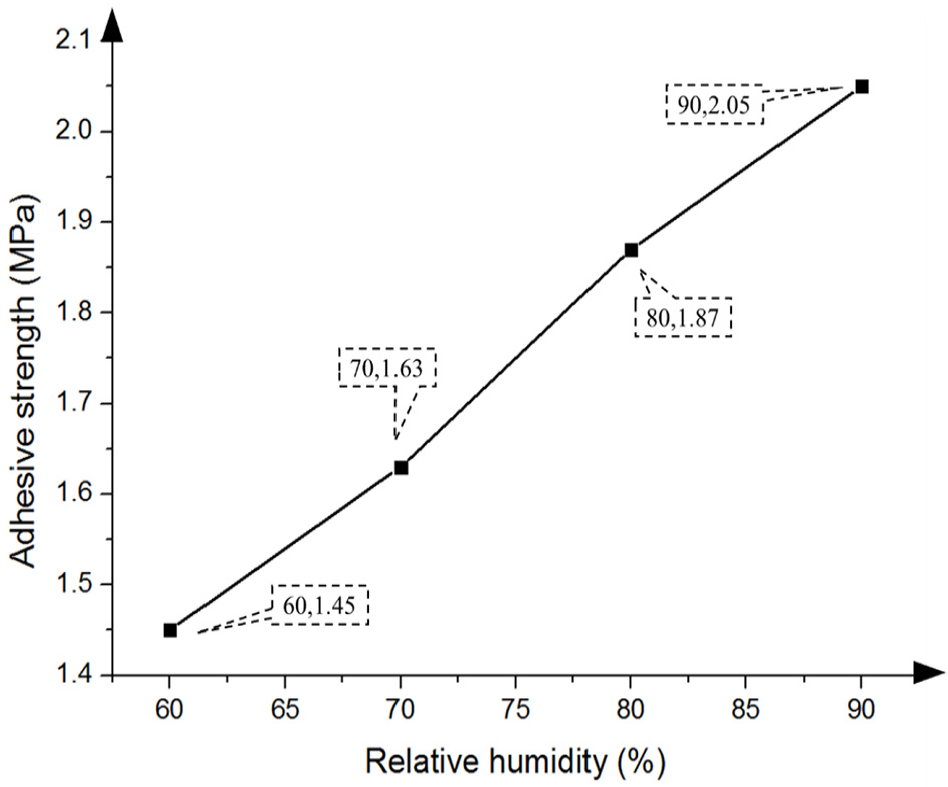
Variation of adhesive strength with relative humidity (temperature 20°C).
Curing time
The curing time also affects the adhesive strength. The change rule of adhesive strength with curing time was obtained by experimentation (the curing temperature was 20°C, the curing relative humidity was 60%, and the liner thickness was 5 mm), as shown in Figure 8. It can be seen from Figure 8 that when the curing time was less than 7 days, the adhesive strength increased with time. In addition, by observing the sections, it could be seen that most failure modes were internal fracture failures of the material. When the curing time was more than 7 days, the adhesive strength was basically unchanged. In addition, by observing the sections, it could be seen that most failure modes were a failure of adhesion between material and substrate.

Adhesion strength with different curing times.
The findings described above indicate that the complete curing time of the material is about 7 days. Therefore, in order to ensure the accuracy of the experiment and to limit the time taken for the experiment, a curing time of 7 days was applied for all groups of experiments to ensure the consistency and accuracy of the experiment.
Taking the mold off
After 7 days, the liner material was completely cured. The acrylic sheet was carefully removed, leaving a cylindrical liner material layer with a diameter of 50 mm and uniform thickness (Figure 3(d)).
Laying pull-off unit
The surface of the pull-off unit was cleaned, after which epoxy resin was evenly applied to the surface. The pull-off unit with epoxy resin was then pressed onto the liner layer as soon as possible and left to stand for 24 h for the epoxy resin to cure (Figure 3(e) and (f)).
Implementation of the pull-off test
Experimental device
All tests were carried out using an HCTC-10 coating adhesion tester manufactured by Beijing Haichuang High Technology Co., Ltd (Figure 9). The tester comprised multiple mechanical units, including a handle, a sensor, a screw, and a reaction support. During the pull-off test, the pull-off unit and the liner were in a bonded state, and then the pull-off unit connected to the handle through the screw was moved upward by manually rotating the handle while the substrate was immobilized due to the reaction force imposed by the reaction support. In this way, the liner material eventually becomes completely separated from the substrate, and the adhesive strength between the liner and the substrate can be measured. The maximum tensile force of the tester was 10 kN, with a tensile distance of 65 mm.
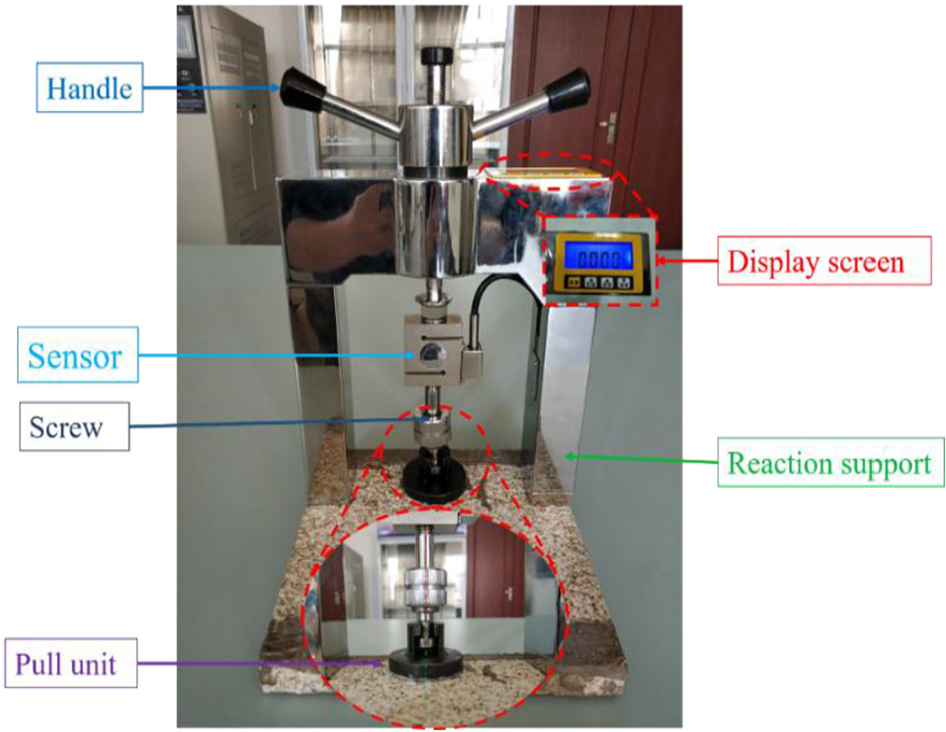
HCTC-10 coating adhesion tester.
The pull-off test
Once sample preparation had been completed, the free end of the screw was inserted into the pull-off unit. The medial axis of the screw and the pull-off unit had to be aligned (Figure 9) to minimize the influence of eccentric loads and bending moments. The handle was rotated at a displacement rate of 50 mm/min to pull the liner material adhering to the pull-off unit from the substrate surface, until complete separation occurred. The peak force value during the process was displayed on the monitor, representing the adhesive strength of the material.
Pull-off tests were carried out on each type of substrate (granite, sandstone, concrete, and coal) using liner thicknesses of 1, 2, 3, 4, 5, 6, 7, and 8 mm. Each pull-off test was repeated six times, giving a total of 192 pull-off tests performed.
Analysis of results
Four failure modes
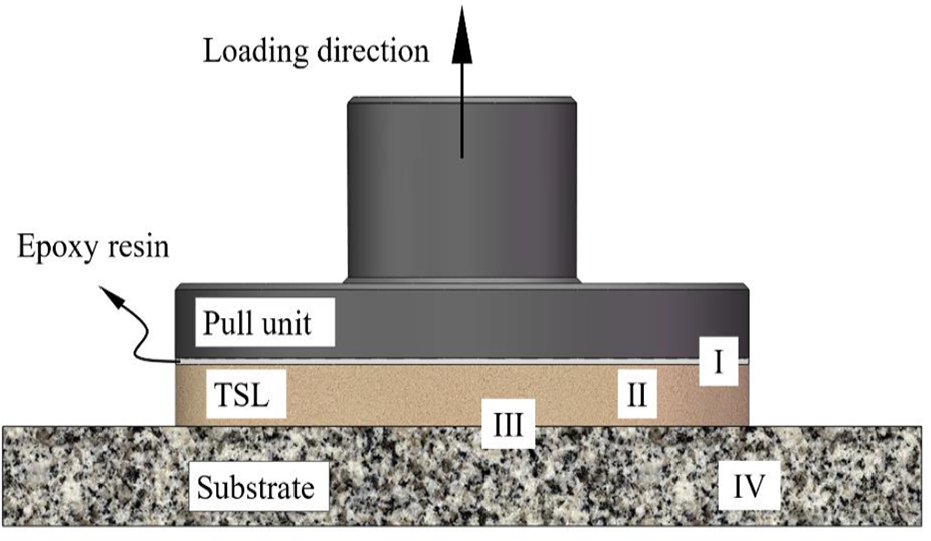
As shown in Figures 10 and 11, the four modes of potential pull-off failure are as follows:
I. Epoxy resin failure. This failure is located at the interface between epoxy resin and the pull-off unit or between epoxy resin and the liner material (Figure 11(a)). This mode of failure is caused by insufficient contact between epoxy resin and the surface of the pull-off unit or the liner material. A small actual contact area results in epoxy resin adhesion failure. The solution to avoid this mode of failure is to uniformly apply epoxy resin and ensure a smooth surface of the liner material, with the absence of obvious protrusions or depressions.
II. Liner material failure. This occurs inside the liner material and is caused by a higher adhesive strength than its own tensile strength (Figure 11(b)).
III. Liner material–substrate adhesion failure. This is the most desirable mode, occurring at the interface of the liner material and the substrate. The adhesive strength measured in this failure mode is valid (Figure 11(c)).
IV. Substrate failure. This occurs inside the substrate in cases where the adhesive strength is higher than the substrate tensile strength (Figure 11(d)). This mode only occurs with substrates of low tensile strength.
Four failure modes of the pull-off test.

Actual failure modes: (a) Failure mode I: Epoxy resin failure; (b) Failure mode II: Liner material failure; (c) Failure mode III: Liner material–substrate adhesion failure and (d) Failure mode IV: Substrate failure.
The determination of the mode of failure must be clarified if either of the following two situations occurs during the experiment:
Part of the substrate material adheres to the liner surface. If the substrate adhering to the liner surface accounts for 33%16,17 or less of the entire liner area, the failure belongs to mode III, otherwise it belongs to mode IV.
Part of the liner material adheres to the surface of the pull-off unit. If the liner material adhering to the pull-off unit surface accounts for 33% or less of the entire area of the pull-off unit, the failure belongs to mode I, otherwise it belongs to mode II.
The method used to determine the percentage area is as follows: An image of the failure interface was taken, which was then subjected to image binarization to obtain a grayscale image. The white area in the image was calculated (the white area represents either substrate adhering to the liner surface or the liner material adhering to the surface of the pull-off unit) as a percentage of the total area (Figure 12). The interface failure after each pull-off test was analyzed using the method described above, and the analysis results are shown in Table 4.

Image processing.
Counts of all failure modes that occurred during the pull-off tests.

Results and discussion
The counts of all failure modes that occurred during the pull-off tests are shown in Table 4. As shown in Table 4, when using granite as the substrate, most of the failures (91.6%) which occurred during the pull-off tests were mode III. The proportions of failure modes I and II were relatively small (both 4.2%), and both failure modes occurred with liners of 1 and 2 mm. Failure mode IV was not observed.
When sandstone was used as the substrate for pull-off tests, failure mode I accounted for 4.2% of failures, which all occurred with liners up to 2 mm thick. Failure mode II comprised 6.2% and occurred once for liners of 1, 3, and 4 mm, respectively. The largest proportion (89.6%) involved failure mode III, while failure mode IV did not occur.
When the substrate used was concrete, failure mode I only occurred once for liners of 3 mm, comprising 2.1%. Failure mode II accounted for 8.3% and occurred for liners of 6, 7, and 8 mm. Failure mode III comprised 72.9%, and failure mode IV occurred with concrete (16.7%) when the liner thickness was 5 mm or less.
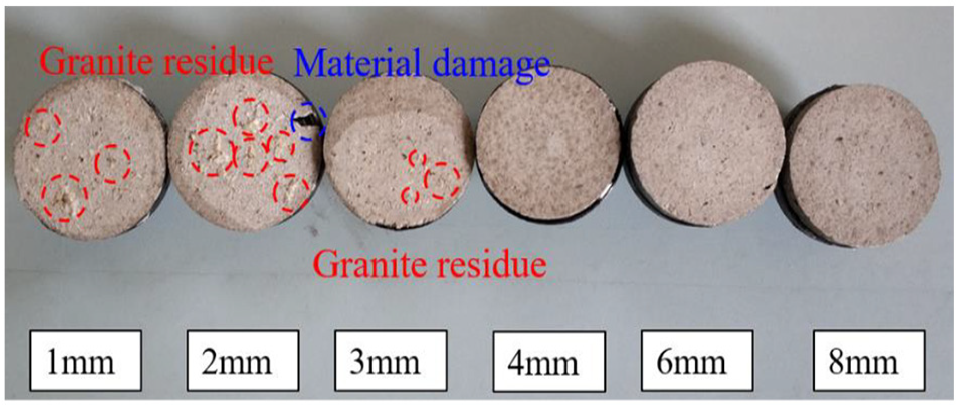
With coal as the substrate, failure mode III only occurred for liners of 5 mm or more, compromising 39.6%. The proportion of failure mode IV was 60.4%. This failure mode occurred less frequently as the liner thickness increased. The results of the pull-off tests for liners of different thickness with granite as the substrate are shown in Table 5, and the pull-off situation with granite as the substrate is shown in Figure 13.
Pull-off test results for liners of different thickness (using granite as the substrate).

Pull-off test situation using granite as the substrate.
As shown in Table 5, liners with a thickness of 1 mm displayed the highest adhesive strength of 3.02 MPa, while the weakest adhesive strength of 1.04 MPa was observed for liners of 8 mm. According to Figure 13, for liner thicknesses of 1, 2, and 3 mm, there was small amount of granite residue on the liner material surface. In addition, a small area of the liner material was damaged when the thickness was 2 mm. When the liner thickness was increased to more than 3 mm, essentially no granite residue was observed on the liner material surface. The reason for the above observation may be that the cohesion of the liner material is less for thinner liner layers, therefore the liner material is more likely to permeate cracks inside the granite, which then increases the actual contact area. Adhesive strength is related to the actual contact area and is therefore higher with larger actual contact area. The high adhesive strength between the liner material and granite then leads to an easy adhering of granite residue on the liner surface during pull-off tests. The small area of damage observed with liners of 2 mm may have resulted from the epoxy resin and the liner material being poorly adhered. The results of the pull-off tests for liners of different thickness using sandstone as the substrate are shown in Table 6, and the pull-off situation of the sandstone substrate is shown in Figure 14.
Pull-off test results for liners of different thickness (using sandstone as the substrate).


Pull-off situation using sandstone as the substrate.
According to Table 6, liners of 1 mm again exhibited the highest adhesive strength of 2.66 MPa, while the lowest adhesive strength of 0.97 MPa was observed with liners of 8 mm. As shown in Figure 14, damage to the liner material was observed in all cases where the liner thickness was 4 mm or less. The only difference was that when the liner thickness was 2 mm, the area of liner material residue accounted for less than 33% of the pull-off unit area, which suggested this was an epoxy resin failure. When the liner thickness was increased to 4 mm and above, neither sandstone residue on the liner material surface nor liner material damage was observed. This situation may have been due to stronger adhesion between the liner material and the sandstone surface than between the liner material and epoxy resin when the liner thickness was less than or equal to 4 mm, resulting in liner material residue on the sandstone surface during the pull-off tests. The results of the pull-off tests for liners of different thickness on concrete substrate are shown in Table 7, and the pull-off situation for concrete substrate is shown in Figure 15.
Pull-off test results for liners of different thickness (using concrete as the substrate).


Pull-off situation using concrete as the substrate.
Once again, the liners with thickness of 1 mm showed the highest adhesive strength of 2.86 MPa, while the lowest adhesive strength of 1.02 MPa was observed for liners of 8 mm (Table 7). As shown in Figure 15, when the liner thickness was 1 mm, a large area of damage on the concrete substrate was observed for some pull-off tests. Also, liner material failure, which was absent for the other three substrate materials, occurred in some of the pull-off tests for liners of 8 mm when using a concrete substrate. This may be due to the high surface porosity of concrete, which resulted in more liner material permeating the substrate, leading to higher actual contact area and therefore a greater adhesive strength between the liner material and the concrete substrate. The adhesive strength was greater than the cohesion of the liner material, which resulted in damage to the liner material. The results of the pull-off tests for liners of different thickness on coal substrate are shown in Table 8.
Pull-off test results for liners of different thickness (using coal as a substrate).
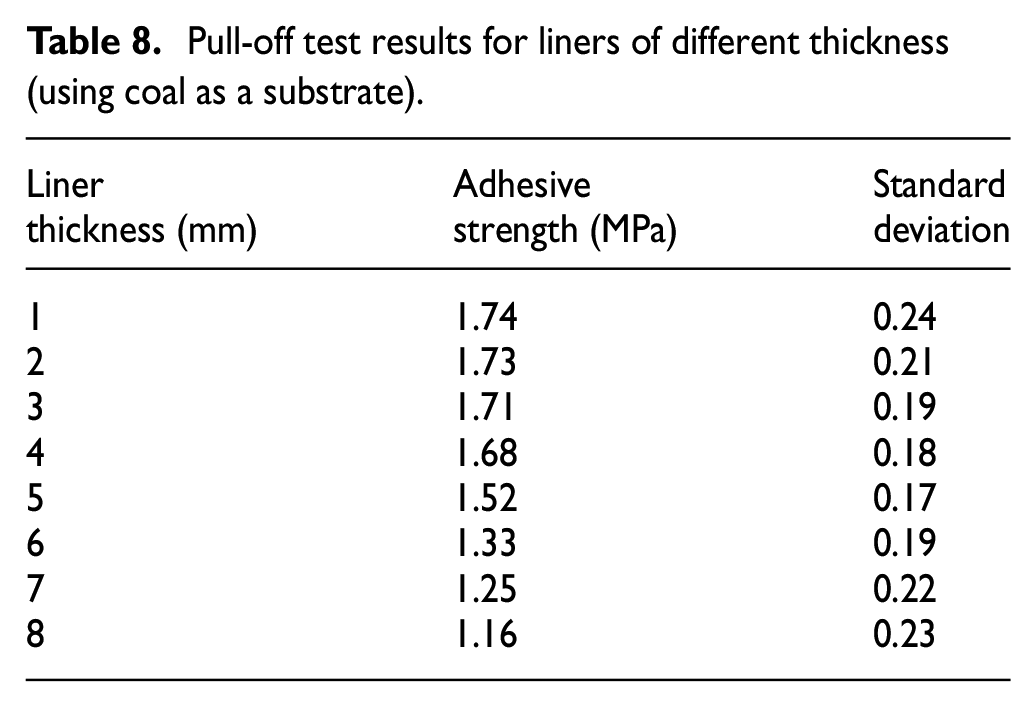
As shown in Table 8, the highest adhesive strength of 1.74 MPa was observed for liners of 1 mm, while liners of 8 mm displayed the lowest adhesive strength of 1.16 MPa. Data fitting for the pull-off test results listed in Tables 5–8 was carried out using Origin 8.5. The functions of adhesive strength (σ) of the liner material versus liner thickness (t) on different substrate materials were obtained and are shown in Figure 16. The adhesive strengths of the liner material with granite, sandstone, concrete, or coal as the substrate were denoted as

Variation curves of adhesive strength (σ) of the liner material versus liner thickness (t) on different substrate materials.
Based on these four functions, the relationship between the adhesive strength (σ) of the liner material and liner thickness (t) on a substrate can be summarized as

where A was defined as the adhesive-strength coefficient of the liner material. The equation confirms the rule proposed by Ozturk and Tannant 29 that the adhesion strength of a liner material is inversely proportional to the square root of the liner thickness.
As illustrated in Figure 16, the adhesive-strength coefficient (A) of the liner material on granite, sandstone, concrete, and coal was
In addition, when t ≥ 3.35 mm, the adhesive strength of the liner material of same thickness on different substrate materials followed the order of
When t ≤ 4 mm, the adhesive strength of the liner material on coal only changed within a limited range, mostly centered around 1.70 MPa. In addition, the tensile strength of coal is 1.75 MPa (Table 1). Taking into account the fact that the failure modes of the pull-off tests on coal all belonged to type IV (coal substrate failure) when t ≤ 4 mm (Table 2), the data obtained from the corresponding tests reflected the maximum tensile strength of coal, instead of the actual adhesive strength of the liner material.
The standard deviation scatter plots of the adhesive-strength data obtained from the pull-off tests are shown in Figure 17. Under the premise of the same liner thickness, the standard deviation of the adhesive-strength values measured on the four substrate materials followed the order of S4 > S3 > S2 > S1, while the tensile strength of the four substrates was in the reverse order Rm4 < Rm3 < Rm2 < Rm1. Therefore, the adhesive strength of the liner material varied the most on coal, followed by concrete, then sandstone, with the least change on granite. These differences may be caused by the different tensile strengths of the substrate materials: the lower the tensile strength, the easier it was for the substrate material to be damaged when subjected to the pull-off test, leading to greater randomness and variability in the measured data.

Standard deviation scatter plots of the adhesive-strength data obtained from the pull-off tests.
In addition, as shown in Figure 17, the standard deviation was initially observed to reduce with increasing liner thickness, reaching a minimum value at a thickness of 5 mm, after which it increased with increasing liner thickness. The same rule applied to all four types of substrates. This may be due to the adhesion between the liner material and substrate being relatively stable at a thickness of 5 mm, resulting in better data convergence among the six sets of measured data.
Conclusion
In this article, the adhesive-strength coefficient (A) of a novel liner material on four types of substrate materials (granite, sandstone, concrete, and coal) was obtained through pull-off tests with different liner thicknesses. The corresponding values were determined to be
The current study provides a method for defining the four failure modes. First, an image of the failure interface was taken, which was then subjected to image binarization to obtain a grayscale image. The white area was calculated as a percentage of the total area, and the failure mode could then be identified according to the percentage. Based on the analysis of interface failures, failure mode III was found to be the most common mode of failure on the surface of granite, sandstone, and concrete, accounting for more than 70% of failures in each case. However, due to the low tensile strength of coal, failure mode IV was observed to occur more frequently when coal was used as a substrate compared with the other three substrates, comprising nearly 40%.
According to the standard deviation analysis of the measured adhesive-strength data, the standard deviation initially decreased with increasing liner thickness, before increasing along with the liner thickness. The adhesive strength of the liner material varied the most on coal, followed by concrete, then sandstone, with the smallest variation seen on granite.
Footnotes
Handling Editor: James Baldwin
Declaration of conflicting interests
The author(s) declared no potential conflicts of interest with respect to the research, authorship, and/or publication of this article.
Funding
The author(s) disclosed receipt of the following financial support for the research, authorship, and/or publication of this article: This study was funded by the National Key Research and Development Plan of the 13th Five-Year Period (Grant No. 2017YFC0805203), National Natural Science Foundation of China (Grant Nos 51604163 and 51974177), Shandong Key Research and Development Program (Grant No. 2018GSF116001), Natural Science Foundation of Shandong (Grant Nos ZR201801280006 and ZR2019 QEE007), and Exchange Projects of the 43rd Routine Session of the China–Czech Committee for Scientific and Technological Cooperation (43-4).