
Abstract
Scientific and rational public transit network planning, not only can effectively alleviate city traffic congestion, but also can reduce the risk of accidents. First, based on the data of residents’ travel survey, this article employs the multiple regression method to forecast the traffic generation and adopts the double-constrained gravity model to forecast the residents’ travel distribution of small cites. Second, by aiming at public transit planning objectives, the unsafe roads for public transit are screened, and the public transit trip-mode sharing rate is set as the interval value. According to the interval value, the public transit trip-mode sharing rate is divided into three cases, and the three alternatives of public transit network are calculated based on the network optimization method and the public transit-oriented development model. Next, the alternatives are evaluated by the set pair analysis method, and the optimal scheme is selected. Finally, this article takes the public transit network planning of Huaiyuan County in Anhui Province as an example, and the results show the proposed method is feasible.
Introduction
In recent years, with the rapid increase in the number of motor vehicles, many cities have run into traffic congestion, including small-, medium-, and large-sized cities. Compared with large- and medium-sized cities, small cities have the characteristics of fewer public transit routes, shorter line, smaller passenger travel volume, and so on. Thus, it is difficult to import the existing public transit network planning method (PTNPM) for large cities into the small cities, especially for the methods of public transit origin and destination (OD) matrix acquired in large cities, which cannot be directly applied to small cities. Planners should learn how to adjust measures from the local conditions, to plan scientific and rational public transit network of small cities and further to increase the attractiveness of public transit to passengers, which is a question worthy of study.
Previous scholars have done a lot of research on city PTNPM. Silman et al. 1 took the number of operating vehicles in the periods of a day unchanged as the premise, and under the condition of budget, took the minimum travel time and congestion degree as the objective function, the public transport network optimization was carried out by modifying the network and the departure frequency. Janarthanan 2 developed an interactive knowledge expert system to provide the support of interactive graphics; they also simulated and analyzed the designing program of the public transport network to achieve the implementation of the program. Pattnaik et al. 3 provided a method of the public transport network optimization, which was based on genetic algorithm to reduce the cost of operators and shorten the travel time of passengers as the goal, and the time headway as the constraint. The method produced the candidate road networks, and then determined the optimal road network from the candidate road networks by the genetic algorithm. In order to achieve the purpose of the maximum passenger flow volume and the shortest travel distance, Wang 4 presented the layout method of public transit network, which was “one by one layout, optimized the network.” Lee and Vuchic 5 proposed a public transport network design-iterative method, which was first applied into the shortest path to form the alternative line sets, and then in order to optimize the public transit network, the iterative method was adopted to remove the line of low efficiency. Shafahi and Khani 6 aimed at the shortest transfer time of the public transit network which was assumed that the departure intervals of each line were fixed during the planning period. Then a mathematical programming model was established to achieve the purpose of optimizing the public transit network by setting the departure time of the buses on the line. Wang et al. 7 introduced a multi-level PTNPM based on regional service, layer planning, and the optimization of public transport network. The goal of optimization was to maximize the efficiency of the road network operation and increase the direct passenger density. The branch optimization goal was to maximize coverage of the bus station. Chen and Lu 8 produced a PTNPM based on circulation, which took the overall interests of passengers and bus operators as the objective function, and compared with the different trip purpose and travel options through the objective function, ultimately the optimal line was achieved. Baloian et al. 9 proposed the use of existing large data and cloud services (such as Google Maps) to support the decision-making process of the traffic transportation network, which was used to predict the initial points and the end points of the city residents taking the buses and to analyze the effectiveness of site settings. Xu et al., 10 in the interests of passengers and bus companies, established the bi-level programming model for public transit network planning (PTNP), simulated annealing algorithm to solve the model, and searched neighborhood solutions through the seven search methods. After the model and the algorithm were verified through the example, it was found that the algorithm and the model were applied to the optimization of public transport network was effective. Chen et al. 11 introduced the concept of “diagnostic standard values of index,” and proposed a method to optimize and adjust the public transit network in the order of “distinguishing primary and secondary, rolling propulsion and continuous optimization” from the overall perspective of the system.
Generally speaking, the research on the city PTNPM is relatively widespread, but the study on the city passenger flow forecasting and setting the interval value of the public transport travel-mode sharing rate is relatively few. The methods proposed by the scholars are mainly focused on the specific planning of the public transit network in the city, instead of integrating and applying its planning method comprehensively, the transit-oriented development (TOD) model and the characteristics of small cities. Therefore, on the basis of the achievements of the predecessor scholars, this article puts forward a small city PTNPM with a certain reference value in order to promote the comprehensive development of the city, improve the people’s living standard and alleviate the traffic congestion.
A new public transport network planning process for small city
For the purpose of alleviating the traffic congestion and rationally planning the public transit network of small cities, a comprehensive PTNPM is put forward. First of all, on the basis of accessing to information, this article investigates the current travel volume of city residents, travel mode, and trip distribution. According to the survey data, the model and method are used to predict the trip generation and traffic assignment, and the OD matrix of the city public transit is obtained by determining the interval value of the public transit travel-mode sharing rate (divided into large, medium, and small three cases). Second, the influencing factors of city PTNP are analyzed. Based on the traffic forecast data, the optimized network method and the TOD mode are employed to generate three alternatives of the public transit network. Next, the set pair analysis (SPA) method is adopted to evaluate the alternatives, and ultimately, the optimal scheme of the PTNP is obtained. Finally, the PTNP of Huaiyuan County is taken as an example to verify the above planning method. The specific flow chart is shown in Figure 1.

Planning flow chart.
Prediction of city residents’ transit travel
Trip generation forecast
The multiple regression models are used to predict the amount of trip production and trip attraction. The trip generation of traffic zone is taken as explained variable, while the corresponding social and economic variables, such as the land area of traffic zone, populations, the number of employees, the number of students, and all kinds of vehicle ownerships, are regarded as explanatory variables, so the goal is to try to establish a linear relationship between the explained and explanatory variables, and then extrapolate its relationship to predict the date which is needed.
Trip distribution forecast
According to the OD matrix of the city resident trip and the amount of each traffic zone trip generation in the planning year, the OD trip distribution of planning year is calculated by a certain mathematical method. The representative methods of traffic distribution forecasting are Follett method and double-constrained gravity model method, and in this article, the double-constrained gravity model is adopted for PTNP of small cities. 12
Formulating the planning objectives of public transit network
After completing the trip generation and trip distribution forecast above, the public transit trip-mode sharing rate is divided. Due to the influencing factors of traffic demand forecast, the single sharing rate cannot accurately reflect the real carrying capacity of the city transits, so according to the three grades of big, medium and small, the sharing rate is set to the interval value. And then, after the three alternative schemes are evaluated by the preferred evaluation method, the optimal scheme is obtained, which is reasonable and conforms to the actual situation.
Setting the interval value
According to the “city road traffic planning and designing technical standard” in the aspect of public transit trip-mode carrying capacity, the current public transit (PT) travel mode sharing rate can be obtained by combining with the predicted total amount of city residents trip under all trip-modes. And then in accordance with the per capita travel times and total travel volume of the current city, the forward forecast is performed, so the total amount of long-term city residents trip can be achieved. On this basis, the suggested interval value of the long-term PT trip-mode sharing rate is set and divided into such as large, medium and small three cases, and the optimal sharing rate is determined according to the evaluation of the PT network alternatives.
The commonly used methods of forecasting the trip-mode sharing rate include transfer curve method and probability model method, 13 in which the former can determine the current trip-mode sharing rate through the survey, but cannot predict the forward sharing rate, while the latter is mainly based on the Logit model, which requires only a small sample size, the result error is small, the modeling process and the parameter calibration is complex, as well as the application calculation process, so the scope of application is limited. In the all trip-modes forecasting, the PT network trip-mode sharing rate can be predicted according to the forecasting model.
Planning objectives
This article mainly concentrates on the long-term PTNP of small cities, whose reasonable planning objectives are not only the premise of generating PT network optimal scheme, but also are the feasible criterion of the optimal scheme. The specific planning objectives are as follows:
The all operation of PT in small cities realizes intelligent management and control.
The average non-linear coefficient of the PT network is no greater than 1.4.
The one-way travel time of 90% residents is not more than 25 min.
The service area of PT station (calculated with 500-m radius) is not less than 90% of the city construction area.
The density of the PT network in the city center is 3–4 km/km2, and the density of the PT network in the edge area is 2–2.5 km/km2.
There are the advanced PT priority development policies, the higher level of PT services, intelligent, safe, and perfect PT scheduling system.
Calculate the PT travel OD matrix
In terms of the sharing rate interval value divided by the method above, the three sharing rates of the PT trip-mode can be gotten, and then the daily PT travel OD matrix can be obtained according to the total daily traffic volume of the residents.
The PT travel OD matrix well reflects the changes in the traffic demand of the each traffic area and can accurately understand the travel tendency of the city residents. It is very important for the construction of long-term city functional blocks, the comprehensive planning of the long-term city PT and the reasonable layout of the city structure.
Generation and evaluation of alternatives for PT network
Screening of alternative road segments
Research on unsafe road section of PT network
The PT network “unsafe road segment” is referred to such a type of road segment that exists in the road traffic network. One is that, it has obvious unsafe features (such as the road geometry is not in conformity with the standard road section, the unmarked line segment, and the long-lost road section). The other is to combine the existing road traffic indicators, traffic accident data, and safety conditions in the traffic network, by designing advanced soft computing models and algorithms, using computer programming deep-mining calculations to obtain potentially unsafe sections, so when these two sections are selected as the alternative sections of the bus network, they are all unsafe. Thus they do not meet the conditions of the public transportation opening section. Therefore, such sections are called “unsafe sections” of public transportation.
On the basis of the concepts above, this article decides to use the artificial neural network theory to establish the Levenberg–Marquardt neural network (LMNN) based on the public transportation “unsafe road section” screening algorithm, and design the screening program to complete the determination of unsafe road section set.
Index system for screening unsafe sections of PT
According to the characteristics of unsafe sections of PT, existing traffic accident statistics and traffic safety data, the index set
Neural network structure of unsafe section screening system in PT
According to the unsafe section screening system in PT established in the previous section, there are 15 input parameters and 3 output parameters in this system. In this article, the three-layer neural network structure is adopted, and according to the empirical formula, the specific structure of the neural network 17 is determined as 15-31-3, and its neural network structure is shown in Figure 2.

LMNN structure for the screening of unsafe sections of public transportation.
Dimensionless processing of initial input data of neural network model
There are three kinds of indexes: benefit, cost, and interval. The data of these indexes need to be dimensionless before they can be used as input data of neural network.
Let the matrix composed of collected data be
Case 1: For the profit-oriented attribute index (i.e. the larger the index value, the better the index value), the conversion formula is as follows
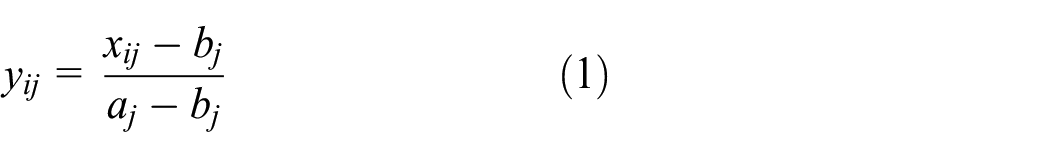
Case 2: For the cost-oriented attribute index (i.e. the smaller the index value, the better the index value), the conversion formula is as follows
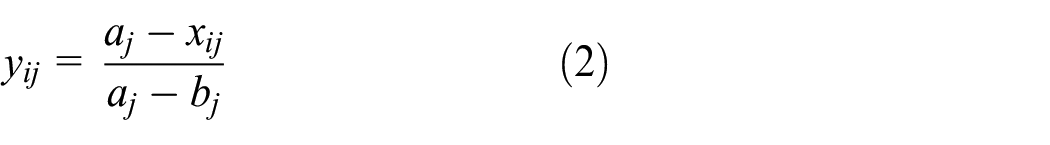
Case 3: For the interval type attribute index (i.e. the index value is the best indicator falling within a certain range), the conversion formula is as follows

where
In the unsafe road segment screening system of public transportation network, the benefit index is
Neural network training for the unsafe road segment screening system of PT network based on Levenberg–Marquardt method
The Levenberg–Marquardt (LM) algorithm is a combination of the gradient descent method and the Gauss-Newton method. It utilizes approximate second-order derivative information. The LM algorithm does not require excessive adjustment parameters and runs faster than the gradient descent method. 19 When training the neural network with the LM algorithm, the weight adjustment formula is as follows

where
LMNN-based public transportation network unsafe road segment screening steps
Step 1: Determine the decision-making indicator system for the unsafe road segment screening system of the bus line network.
Step 2: Collect historical data and perform dimensionless processing on the input data.
Step 3: Determine the neural network structure of the unsafe road segment screening system of the bus line network.
Step 4: Determine the initial weight and threshold of the neural network of the unsafe road segment screening system of the bus network.
Step 5: Use the LM method to refine and test the network weights and thresholds. If the test fails, return to step 3; if the test is acceptable, proceed to step 6.
Step 6: Use the trained LMNN model to screen unsafe sections of the road segments in the transit network.
Step 7: Determine the unsafe road segment collection of the PT network.
At this point, it is possible to identify alternative road sections for PT to operate.
Generation of alternatives
There are many methods of layout planning for city conventional PT network, but most of them are limited to theoretical research and are difficult to operate in the practical projects. 20 Comparatively speaking, “one by one layout, optimized the network” and public TOD model 21 have more practical value. The former is based on the transit passenger OD matrix of each traffic area, regarding the maximum number of passengers as the main target (the smaller the number of transfers, the larger the amount of delivery). By analyzing the starting and ending position of the alternative routes and passenger flow distribution, we can determine the optimal direction of the lines, and the reasonable and coordinated network is achieved. The latter takes PT as the main body, emphasizes the close integration of PT and land planning, and advocates the city layout with the PT corridor as the bond, with the PT as the guide, and the integrated user low group as the node, is to achieve the change of city PT from the traditional “Passive adaptation” to “active induction.”
Therefore, the optimized network and TOD model are comprehensively applied in the PTNP of small city, which is to realize the effective integration of energy and resources within the city, and to reduce the problems such as traffic congestion, environmental pollution, and ecological deterioration caused by the use of city private vehicles. In the city newly-built area, “the TOD is the main, the optimized network is auxiliary.” The PT stations are taken as the center, and the station coverage of 500–800 m is taken as the radius to establish the square center or the city center. The TOD model can integrate the city land types including work, business, culture, education, residential, and so on into a “mixed-use” city functional block. In the old town, “the optimized network is priority, the TOD is auxiliary.” As the planned city structure has been basically formed, it is difficult to plan with PT as the guide.
Three different PT travel OD matrixes are calculated based on the three different PT trip-mode sharing rates, and the different travel OD matrixes reflect the different passenger flow distribution in each traffic area. The passenger flow distribution shows the different travel trend of the city residents. Therefore, the PT routes determined by the above planning method are different, and then the alternative schemes of three small cities PTNP can be obtained.
To sum up, according to the principle of “Point-to-line, Line-to-surface,” the PT network of the whole city is finally obtained. With this, it can not only optimize the internal structure of the city and the allocation of elements and control the unreasonable expansion of the city but also improve the efficiency of land use around the traffic facilities, guide the comprehensive development of the city, and reduce the commuter cost of residents.
Evaluation of alternative schemes
This article is based on the selection principle of evaluation index and takes the setting function of evaluation index as the purpose; the evaluation index system of city transit network is established through comprehensive analysis and investigation 22 as shown in Table 1 below.
Small city public transit evaluation index.

Determine the evaluation criteria and the weight of the indicators
Determine the evaluation criteria
According to the “city road traffic planning and designing technical standard,” on the basis of a large number of investigation and research, the evaluation results of the indicators in the small city PT network evaluation index system are divided into Excellent (Level 1), Good (Level 2), Medium (Level 3), General (Level 4), and Poor (Level 5) 5 levels. 22
Calculate the weight of the indicators
Generally speaking, in order to complete the comprehensive evaluation of multiple indicators, the weight of the each indicator needs to be objectively determined. 23 The SPA of previous research is to conduct the equal weight processing of the each indicator, which inevitably brings some irrationality. In order to avoid this deviation, the principle and method of information entropy is adopted to determine the weight distribution of index. The main calculation steps are as follows:
1. Assume that there are m evaluated objects, the evaluation indicator of each evaluated object has n indexes, and the judgment matrix R is constructed

2. The judgment matrix R is normalized, and the normalized judgment matrix B is obtained:
For the greater the value, the better the index, there is

For the smaller the value, the better the index, there is

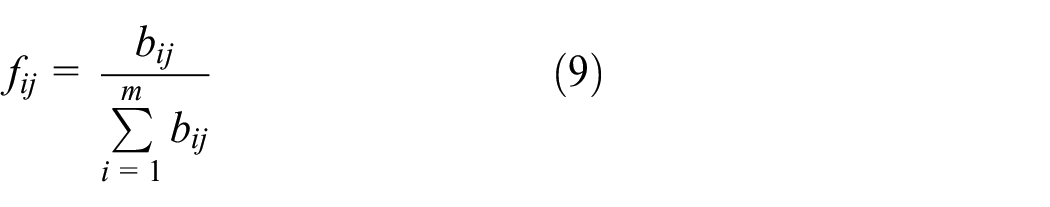
3. According to the traditional concept of entropy, the entropy of each evaluation index can be defined as
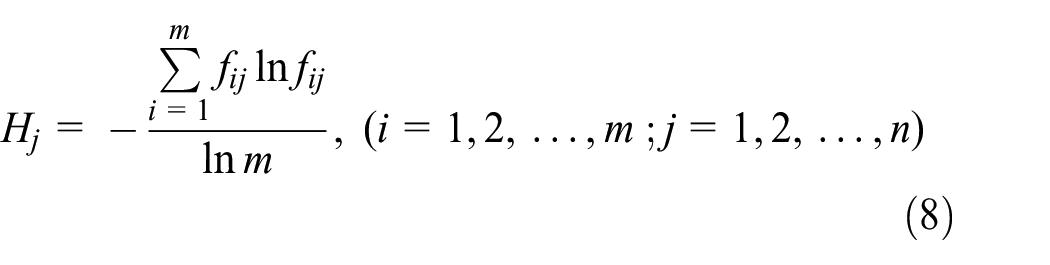
Obviously, when

4. The entropy weight W of each evaluation indicator is calculated as


Comprehensive evaluation model
The SPA is a new theory of uncertainty that studies certainty and uncertainty on the whole, especially in the decision-making of evaluation scheme. The decision-making of the scheme is made using the difference between the criteria of evaluators and the corresponding indexes of the evaluation scheme itself. In this article, the SPA method is very suitable to evaluate the PT network alternative schemes in small cities.
The SPA is a theoretical method proposed by Zhao and Xuan 24 that describes a quantitative analysis of certainty and uncertainty problem about the same, different, and opposite. The core idea is to regard the certainty and uncertainty problem as a certainty and uncertainty system, and the connection and transformation between things are analyzed from the same, different, and opposite three aspects. The basic concept of SPA is the set pair and its connection degree.
For the two given sets, set
where

where
According to the above equation, when i is 1, the uncertainty degree can be transformed into the same degree. When i is equal to −1, then the uncertainty degree can be transformed into the alignment degree. When the value of i is determined in the (−1, 1) range, it can respectively reflect the proportion of certainty and uncertainty.
The evaluation of the PT network alternative schemes is the process of selecting the optimal planning scheme. 25 When the SPA method is adopted to evaluate the alternative schemes of the PT network, the alternative schemes are regarded as a set, and its every evaluation indicator is the each characteristic of this set. The evaluator’s opinion on the alternative scheme is seen as another set. Obviously, in the process of evaluating the scheme, the two sets constitute of a set pair, while the concept of the same, different, and opposite in the SPA is equivalent to the approval, abstain, and against in the process of program evaluation and decision. For example, when the evaluator keeps the “approval” on the alternative scheme, it means that the evaluator’s opinions are “the same” as the evaluation scheme itself, and so on. According to the evaluation criteria, the evaluation and analysis of the different alternative scheme is made from six aspects: network capacity, economic benefits, environmental impact, service level, passenger capacity, and passenger satisfaction. Ultimately, the optimal planning scheme is obtained.
Case study
This article takes Huaiyuan County as an example to verify the aforementioned PTNPM of small cities, that is to say, this article makes a case study on the long-term (2030) PTNP of Huaiyuan County in terms of the passenger flow forecasting, the generation of the PT network alternatives, the evaluation of alternatives, and result analysis.
Huaiyuan County passenger flow forecasting
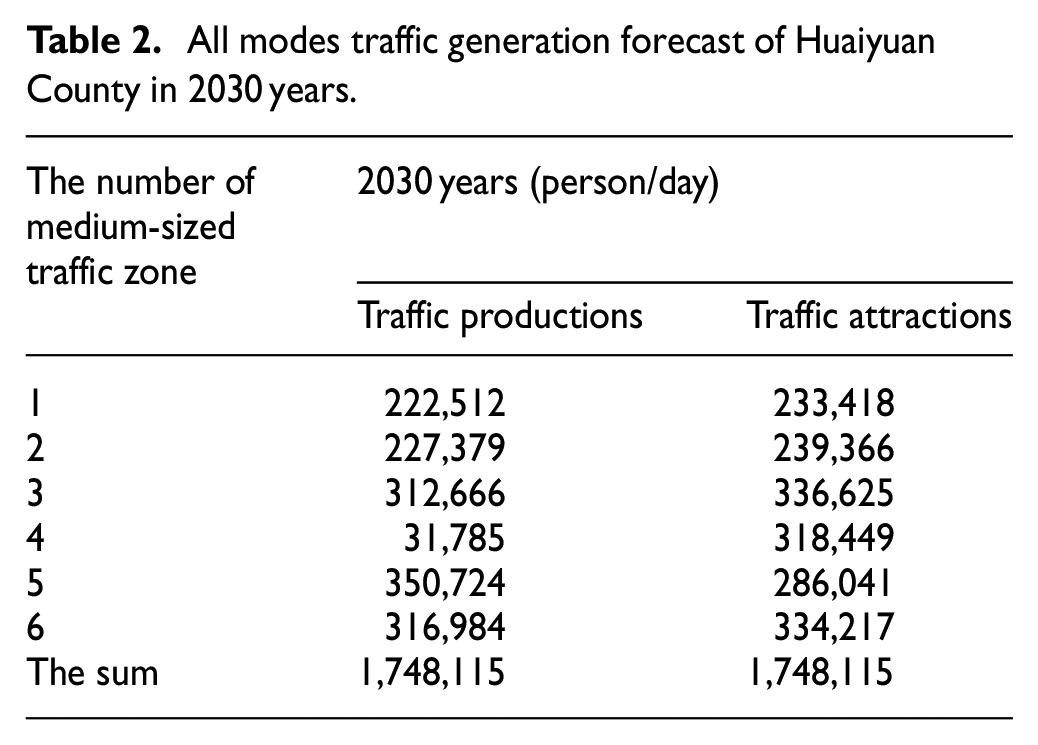
According to the total number of residents’ travel and the average daily travel times of residents predicted in Huaiyuan County Planning Year (2030), the traffic productions of medium-sized traffic zone in Huaiyuan County is calculated, and then based on the interaction between traffic attraction and land-use types, the traffic attractions of medium-sized traffic zone in Huaiyuan County is figured out. The total amount of traffic generation of Huaiyuan County in 2030 years is shown in Table 2 below.
All modes traffic generation forecast of Huaiyuan County in 2030 years.
According to the traffic productions and the traffic attractions obtained by the traffic generation forecast, the double-constrained gravity model that includes the calibration parameters of balance coefficient and impedance function is used to predict the traffic distribution of Huaiyuan County planning year. And the daily traffic distribution between different medium-sized traffic zones is calculated. The total daily traffic distribution between all traffic middle-areas is shown in Table 3 below.
All modes traffic distribution forecast of Huaiyuan County in 2030 years (person/day).

OD: origin and destination.
Remark: The parameter
According to the current residents trip proportion of PT in Huaiyuan County, the Logit model is employed to calculate the interval value of Huaiyuan County long-term PT trip-mode sharing rate, which is [15%, 19%]. The interval value is divided into large, medium, and small three grades, which is 15%, 17%, and 19%. Then three OD matrixes of the PT trip can be calculated. The OD matrix with the trip-mode sharing rate of 15% is shown in Table 4.
The OD matrix with the trip-mode sharing rate of 15% in 2030 years (person/day).

OD: origin and destination.
Remark: Since the paper is limited in length, the OD matrixes with the trip-mode sharing rate of 17% and 19% are omitted.
Screening of unsafe sections of PT network in Huaiyuan County
According to the contents described above, public transportation network planning is considered as an example to verify the example of the bus line network in the new and old urban areas of Huaiyuan County. According to the established neural network structure of the public transportation insecure road segment mentioned in this article and the screening steps of the unsafe road segment, the unsafe road sections that are not suitable for the bus line network in Huaiyuan County are filtered and assembled in turn. The final screening of unsafe sections that are not suitable for the operation of the bus network includes the following five roads:
College Road: There are more non-motor vehicles or motor vehicles occupying motor vehicle lanes on this road section, which makes the original two-lane road have a narrow available width, causing the traffic control environment of the road section to be poor, whereas the interference from the bus stop operation is too large. Therefore, through comprehensive assessment, it is determined that the section of the road is not suitable for the construction of public transportation network.
East Liuhua Road: In the recent public transportation network planning of Huaiyuan County, due to the construction of a large number of residential buildings on both sides of the road, there is no good facilities and equipment in the recent traffic management. The traffic control environment is poor, and the traffic volume in the recent passenger flow forecast is relatively small, which cannot meet the conditions for the opening of public transportation. Therefore, it is classified as an unsafe road in the recent Huaiyuan public transportation network planning. However, in the mid- and long-term planning, the re-prediction of the passenger flow and the re-evaluation of the municipal facilities and equipment installation plan can be used to adjust and optimize the bus route.
Huancheng Road: The width of the single-side motor vehicle lane of this section is too narrow to meet the opposite traffic of public transportation vehicles, which seriously affects the smooth operation of public transportation lines. Therefore, it is regarded as an unsafe section.
Yingbin Road: Due to the long-term maintenance and management of the traffic sign marking line and the two-way median treatment, the road section has become a two-way mixed road section, and the traffic control environment is not good. Therefore, it is not suitable for the opening operation of public transportation lines.
Xiangdao Road: There are fewer residents living along the road. It is predicted by passenger flow that there is very little passenger flow. If the operation of the open line causes waste of bus transportation capacity, the passenger flow of this public transportation line will be lower. Therefore, the road section is not suitable for driving bus lines.
Generation of the Huaiyuan County PT network alternatives
The long-term planning of Huaiyuan County aims to expand the connection between the old city zone, new city zone, and industrial park. According to the three PT travel OD matrixes, by combining the TOD model, and avoiding unsafe sections of public transportation network operation, three types of PT network alternatives are obtained. The details are as follows:
Scheme 1: the PT trip-mode sharing rate of this program is 15%. According to the predicted passenger flow distribution of long-term PT travel OD matrix, the result finds that the long-term passenger flow is mainly distributed in the expansion zones of the current PT network blank besides the old city zone by comparing with the current passenger flow distribution, so this scheme is based on the current adjustment of the current PT network. Taken TOD mode as the main body, the long-term PT networks are mainly to fill the PT blank in the expansion zone of Huaiyuan County. A total of 12 new PT networks are planned in this scheme, after the 13 PT routes planned and adjusted in the short-term are added. Therefore, there are 25 PT routes in the long-term planning of Huaiyuan County.
Scheme 2: the PT trip-mode sharing rate of this program is 17%. In this scheme, the distribution trend of the PT travel OD matrix is the same as that of Scheme 1. Therefore, the purpose of this planning program is equally to fill the PT blank in the expansion zones of Huaiyuan County. However, in this scheme, due to the large traffic volume forecasted in the each traffic zone and the leading role of TOD mode, the long-term planning of Huaiyuan County newly adds one PT route based on Scheme 1. The roads passed through by its route are Jing Tu hub station, New River Road, Yu Du Road, Wo River Bridge, Yu Du Avenue, and Original and Terminal Stations in the west-city. Accordingly, there are 13 new routes in the long-term planning, and the total number of PT routes in the Huaiyuan County long-term is 25.
Scheme 3: the PT trip-mode sharing rate of this program is 19%. With the increase of sharing rate, the Huaiyuan County resident trip demand in the each traffic zone is constantly rising, so the predicted passenger flow volume is taken as the premise, regarded the PT corridor as the bond, and the PT travel demand is produced under active induction while meeting the city residents travel demand. Hence, the long-term planning of Huaiyuan County newly adds one PT route based on Scheme 2. The roads passed through by its route are Jing Tu hub station, BE3, Five Fork Road, Yu Du Avenue, BS5, Ke Ren Er Group, and the newly added PT route number of the Huaiyuan County long-term planning are 14, and the total number of PT routes reaches 27.
Evaluation and analysis of alternatives
The SPA method is used to evaluate decision-making alternatives, and the results show that Scheme 1 is optimal in the Huaiyuan County long-term PTNP. The detailed information of the optimal scheme is shown in Table 5.
Huaiyuan County long-term (2030) newly added public transit routes.

In scheme 1, there are 25 PT routes, with its total route length 255.93 km, the length of PT network 134 km, the average daily passenger traffic volume 26.22 (unit: 10,000 passengers per day), and the number of buses in the whole PT network 651 cars. The scheme basically meets the travel demand of residents and could carry 15% of the resident trip volume in Huaiyuan County. Other evaluations are basically the same as the evaluator’s opinions on the scheme; the detailed data are shown in Table 6. As can be seen from Table 6, all indicators of Scheme 1 are consistent with the standard recommended value, which indicates that the optimal scheme is reasonable. To sum up, the evaluator has the “approval” attitude toward Scheme 1, that is to say, the opinions of the evaluator on Scheme 1 is the same as the indicator values of Scheme 1 itself. In other words, the program is coordinated with the long-term development of Huaiyuan County, which can greatly promote the economic development of Huaiyuan County. Moreover, it is consistent with the development direction of the Huaiyuan County, and the various passenger hub stations of city are connected. Ultimately, the purpose of facilitating the transfer of passengers is achieved.
Huaiyuan County long-term (2030) public transit route indicators list.

Conclusion and prospect
The method of optimizing the network and TOD model are comprehensively employed to plan PT network of small cites, which could ensure the close combination of PT development and city comprehensive development in small cities. The PTNPM takes the PT as the bond, and the living level of city residents is improved while the level of PT service is upgraded.
Due to the complicated factors in the city passenger flow forecast and the PT operation environment, it is difficult to reflect the actual carrying capacity of the PT according to the single PT trip-mode sharing rate. The example shows that it is more reasonable to set the interval value of PT trip-mode sharing rate. The optimal solution is better suited to the planning objectives than being expected.
The concept of the same, different, and apposite in the SPA is adopted to evaluate the alternatives of the PT network. The results show that, in the optimal scheme, many indicators of various aspects are considered comprehensively. The optimal scheme is more reasonable and can meet the residents travel demand of the planned cities.
There are many comprehensive evaluation methods for the planning schemes of PT network in small cities, and the superiority of SPA and other comprehensive evaluation methods in the evaluation of PTNP schemes need further study.
Footnotes
Handling Editor: James Baldwin
Data availability
The data used to support the findings of this study are included within the article.
Declaration of conflicting interests
The author(s) declared no potential conflicts of interest with respect to the research, authorship, and/or publication of this article.
Funding
The author(s) disclosed receipt of the following financial support for the research, authorship, and/or publication of this article: This study is supported by the Natural Science Foundation of China (grant no. 71861023), the Program of Humanities and Social Science of Education Ministry of China (grant no. 18YJC630118), and the Foundation of A Hundred Youth Talents Training Program of Lanzhou Jiaotong University.