
Abstract
Periodic impact is a common phenomenon experienced by functional components. The mechanisms governing the adhesive wear growth caused by the periodic impact are not well understood, which limits the development of antiwear and lubricating behavior. In this work, the periodic impact action caused by rubbing surface velocity and contact load is studied in the sliding wear process under mixed lubrication condition. At each wear simulation circle, the material removal at each asperity contact location is evaluated and the surface topography is renewed correspondingly. The evolutions of friction and wear track are revealed during wear process. We find that the friction coefficient changes periodically caused by the periodic speed, and the wear rate increases almost linearly with either speed period or speed amplitude. The load impact results in an abrupt variation in friction coefficient, while it appears to be limited in adhesive wear state compared to speed, highlighting the critical role of velocity impact in wear formation.
Introduction
Wear, the loss of material in a solid surface, is a major surface failure resulted from a surface being stressed mechanically, thermally, or chemically. In most situations, lubricant is widely applied to the contact pairs in mechanical components to minimize wear. The surface roughness height is generally equal to or larger than the oil film thickness; thereby, asperity contact is inevitable due to rough peaks. 1 Many models have been proposed to study the complicated wear processes, among which the adhesive wear model developed by Archard 2 is the most widely used.
Rowe 3 was the first researcher who extended Archard’s law on adhesive wear to the lubricant systems. Stolarski 4 then developed an adhesive wear model in a lubricated sliding system considering the load-sharing effect based on Rowe’s model. But the model is limited as it could only predict wear at very low sliding speeds. Wu and Cheng 5 developed a sliding wear model for partial elastohydrodynamic lubrication (EHL) contacts, in which both the thermal desorption wear mechanism at low asperity contact temperature and the oxidative wear mechanism at elevated asperity contact temperature are considered. Morales-Espejel and Brizmer 6 developed a micro-pitting model in lubricated line contacts, in which the distribution of the load between asperities and lubricant was calculated based on Johnson et al.’s 7 classical iterative approach of flow balance. Hu and Zhu 8 and Zhu and Hu 9 have proposed a numerical solution of deterministic mixed lubrication model, which solves both hydrodynamic lubrication and surface contact problems simultaneously, and predicts the distribution of pressure, film thickness, asperity deformation, friction, and so on as functions of location and time. Their work makes the full numerical wear simulation in mixed lubrication conditions possible. Then, Zhu et al. 1 published a full numerical simulation of sliding wear under lubricated point contacts based on their previous work. Zhang et al. 10 also published a numerical prediction method of surface wear in lubricated line contacts.
Much work has been done on surface evolution during the wear process from both experiment11–13 and statistic simulation14–17 perspectives. There were few relevant reports that studied the factors affecting the wear in mixed lubrication theoretically. Although Archard’s law holds that the amount of wear has a simple linear relationship with the sliding distance, load, material hardness, film thickness play important roles in preventing wear under mixed lubrication. Impact, shifting, Young’s modulus and the lubricant characteristics can all influence the film thickness. Quantitative prediction of wear under mixed lubrication is complicated because it is difficult to estimate how the surface morphology changes, how much material is removed, how the surface roughness changes, and how the contact pressure is redistributed due to changes in surface topography. Kaneta and colleagues18,19 found that in EHL, the impact will make oil remain at the entrance area. Wang et al. 13 pointed out that impact would increase the temperature and affect film thickness. Janakiraman et al. 12 verified impacts on wear coefficient through a twin-disk wear experiment, and they discovered that the pressure–viscosity characteristics of the lubricant have a great influence on the wear, while that influence of the load is small and the influence of roughness texture is moderate. Lewis and Dwyer-Joyce 20 presented that impact could cause increased wear of diesel engine inlet.
This study extends the methodology proposed by Zhu et al. 1 to investigate the relationship between changing working conditions and dynamic wear behavior. Three assumptions are made in this article: (1) wear occurs at positions where the gap is zero, (2) the pressure considered is greater than the yield limit, and (3) the wear rate at each contact point is related to Archard’s wear law. In this study, the effects of load impact, shifting impact, and variable slide-to-roll ratio (SRR) on wear are studied in mixed lubrication conditions.
Research methodology
The modeling methodology in this work is designed to simulate adhesive wear behavior in any type of lubricated contact. It can simulate the entire lubrication status even if the working conditions are rigorous, and no matter whether they are smooth or rough contact surfaces.
Modeling method
We develop a model to calculate the adhesive wear damage of an actual ball on disk contact arising from asperity contact, including the transient distributions of pressure, film thickness (gap), flash temperature, surface evolution, and material removal due to sliding wear with a time-marching numerical solution. Figure 1 shows the flowchart of the numerical wear model. First, based on the mixed EHL model, the model could achieve dynamic convergence after adequate number of time steps. At each time step, the film thickness distribution and the pressures (the EHL pressure and asperity contact pressure) are obtained. Asperity contact is determined as where the gap is zero. Then, Archard’s wear law is used to calculate wear. Material removal is determined by asperity contact and stress yielding judgment. Surfaces’ movements and their positions are updated according to the wear height and relative speed as time goes by.
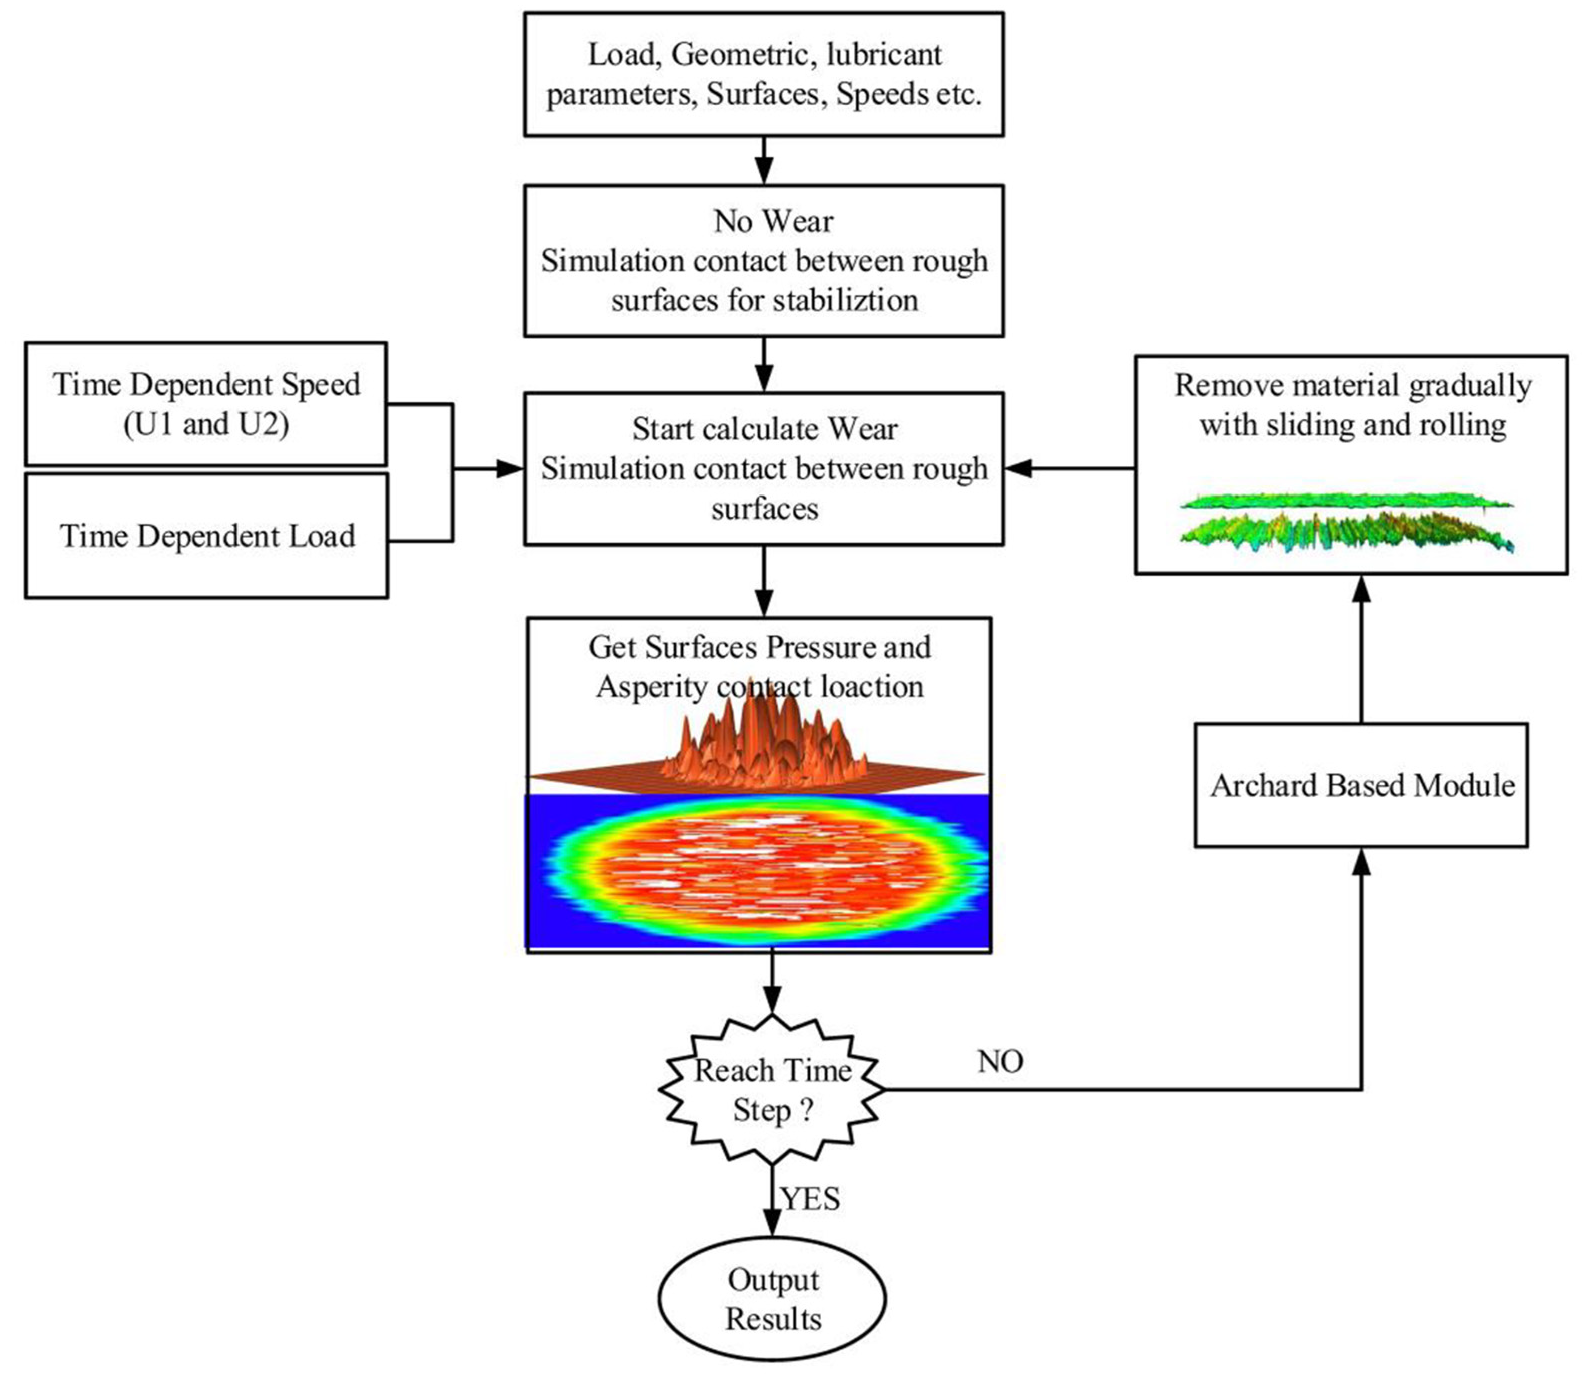
Flowchart of the dynamic wear model.
It is necessary to point out that the solution domain is set to be constant in the solving process, though the contact width changes with load impact and wear process. Because impact and wear expand the contact area, so a larger solution domain is used to avoid inaccuracy. The solution domains are −1.9a ∼ 1.5a in the x direction and −1.7b ∼ 1.7b in the y direction. The solving region is divided into a 256 × 256 matrix. Two surfaces are scanned by equipment to get real statistics of the machined samples. By simulating the real movements, surfaces are updated as the calculation progresses.
Figure 2 shows a sketch for point contact domain, mesh, and movement. Three computational meshes are used in the numerical model. 21 The first one is used for discretizing the Reynolds equation on the solution domain, and its dimensionless mesh size is assumed to be DX and DY. The second one is for discretizing the surface of the ball with a denser mesh size than the Reynolds region. The third one is for discretizing the roughness topography of the disk, which is like that of the ball. The height values of the rough surfaces are passed among the three meshes by interpolation. The size of the surfaces is 1.67 mm in the x direction and 1.9 mm in the y direction with 1811 × 1811 points, which is several times larger than the real Reynolds solving region for numerical accuracy. 22

Schematic view of the numerical simulation.
Basic equations
Referring to the model developed by Zhu and Hu, 9 a general form of equation was proposed for the mixed EHL problem in point contacts as the following

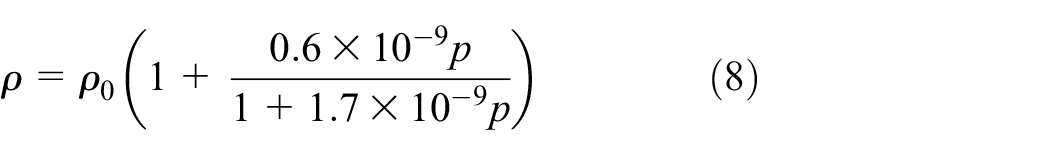
In equation (1), p is the pressure and it is set to be 0 at the border of the solving region as a boundary condition. The direction of x is consistent with the rolling direction. The density ρ of oil and the effective viscosity

Bx and By are equivalent geometry parameters of the contact pair in the x and y directions, respectively.
In the contact region, the pressure consists of EHL pressure and boundary contact pressure, which means that the friction is composed of the shear stress from EHL contact and boundary contact. 22 Friction is usually dealt as an empirical constant (0.08–0.15) multiplied by normal pressure in the boundary region, and it can also be calculated by Bair and Winer’s 22 equation in the EHL region as

In the above equation,
Friction and temperature are interdependent. Assuming that the contact area is very small compared to the entire body in contact, the heating system on the friction surface can be modeled as a finite heat source moving over a semi-infinite uniform body. 24 Temperature of two surfaces can be expressed as

where
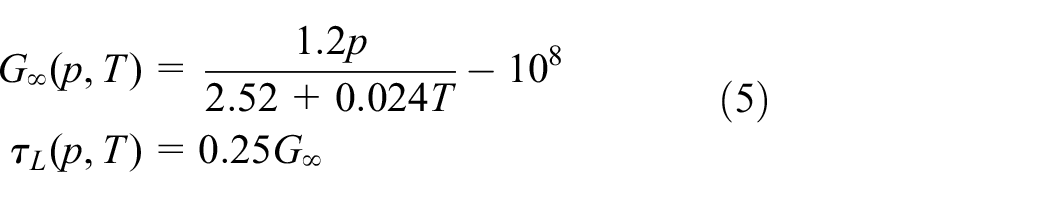
The two parameters of lubricant (

Meng and Ludema 25 reviewed lots of wear equations, and they put three factors (contact pressure p, relative sliding velocity us, and hardness H) that could affect wear, into a formula

In equation (9), wear coefficient k is usually tested by experiment.

The value of acceleration coefficient
Results and analysis
Simulation parameters
Material properties used in the ball-on-the-disk simulation are shown in Table 1. The diameter of the ball is 40 mm. The lubricant in the simulation is assumed to be purely base oil, though additives are often added in commercial lubricants to improve lubrication properties. The lubricant has a viscosity of 0.023 Pa s, a pressure–viscosity coefficient of 12.51 GPa−1, and a density of 0.88 g/cm3. The effect of temperature on viscosity and density is ignored.
Material properties for the mixed EHL simulation cases performed.

RMS: root mean square.
Surfaces used in the simulation are real scanned surfaces, and they are shown in Figure 3.
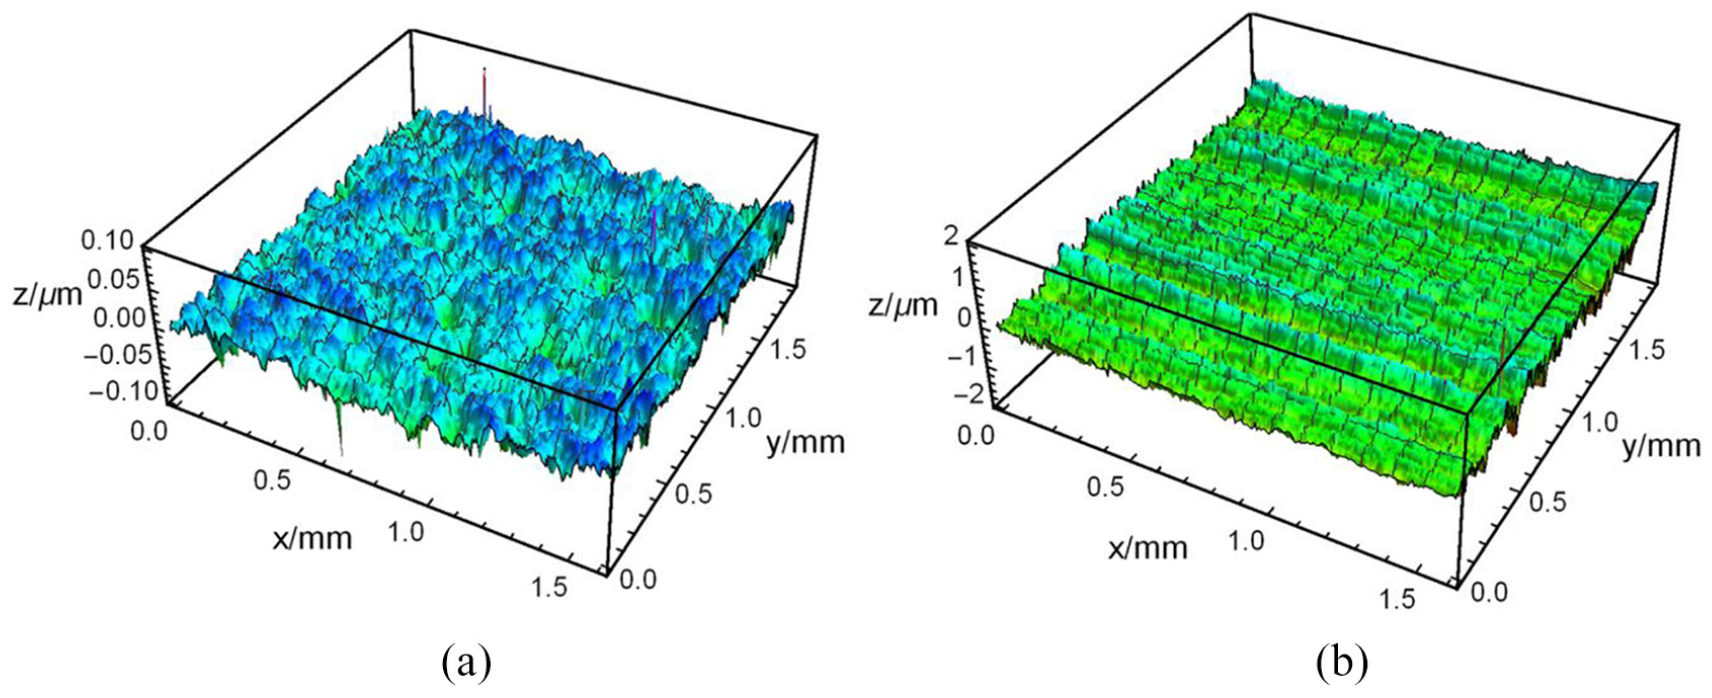
Scanned machined surfaces: (a) ball surface and (b) disk surface.
Effect of periodic speed impact on wear
In most engineering conditions, the working environment of mechanical components is time-varying. Even under stable conditions, the transmission parts may also be subject to mechanical shock and stiffness. It is meaningful to study the influences of periodic speed impact on wear.
Since the speed is variable in the simulation, different lengths of time step may cause fluctuations in the results. The time step should be small enough to satisfy the numerical accuracy. While the small time step length can always remarkably rise the total computing time, a suitable time step is preferred in the present study. The following figure shows the effect of four dimensionless time steps on the average film thickness during sinusoidal shifting operation. The dimension of DT is a/umax. The load is 800 N. The period (T) of speed change is 1.18 ms. The entraining speed is 0.2 m/s.
Figure 4(a) shows that when DT equals 0.01, the simulation results of film thickness and pressure are close to that from DT = 0.005, but large time step lengths such as DT = 0.1 lead to considerable discrepancies. Thereby, DT = 0.01 is used in the next simulation.

Effect of DT on simulation results: (a) average film thickness versus t; (b) film thickness at 8.5 ms; and (c) pressure distribution at 8.5 ms.
Effect of speed amplitude on wear
The initial speed of the ball is 0.1 m/s and the initial speed of the disk is 0.3 m/s. The SRR, load, and the period of shifting remain unchanged in the simulation. The load is 800 N. The period (T) of speed change is 4.7 ms. The wear coefficients are assumed to be 5E−4 for ball and 5E−3 for disk, and wear is introduced at 4.7 ms (after 400 cycles). The entraining speed as a function of time is shown in Figure 5. It needs to be noted that the change in speed consists of two parts, sudden change from constant speed (7.8–9.4 ms) and sinusoidal fluctuation (after 9.4 ms). The impact between 7.8 and 9.4 ms cannot be avoided in order to maintain consistent average speeds for different cases.

Entraining speed versus t (different speed amplitude).
The data in Figure 6 suggest that the periodic speed has a negative effect on lubrication and wear performance. We find that at a fixed speed, the friction coefficient, contact area ratio, and contact load ratio first decrease rapidly after the introduction of wear due to running-in process and then stabilize to constant values. But the periodic speed results in that the friction coefficient changes periodically. The friction coefficient growth is directly related to the speed amplitude. The reason is that a strong squeezing action is generated by the periodic speed, leading to periodic variations in the asperity contact load ratio and asperity contact area ratio as shown in Figure 6(c) and (d). Figure 6(b) shows the wear behavior with respect to different speed amplitudes. The greater the speed amplitude is, the faster it wears, and the difference in wear becomes more and more obvious over time. This agrees with the evolution of friction and asperity contact load ratio.

Evolution of friction coefficient (a), wear volume (b), contact area ratio (c), and contact load ratio (d) as a function of time (different speed amplitude).
Figure 7 shows the changes in friction coefficient, average film thickness, contact area ratio, and contact load ratio during acceleration and deceleration in one period, when AMP = 0.075. During the deceleration process, the friction coefficient decreases first and then increases, and the average film thickness rises first and then decreases. This can be explained by the hydrodynamic squeeze effect of the film. Due to the hydrodynamic squeeze action, the film thickness rises briefly first, resulting in a decrease in asperity contact load and contact area. As the hydrodynamic shear stress is smaller than that of the boundary one, the friction coefficient appears to decrease at the beginning. When the speed continues to decrease, the film thickness decreases, causing asperity contact load and contact area increase, which leads to the friction coefficient growth. During the acceleration process, the friction coefficient slowly decreases with a moderate increase in the average film thickness. It is obvious that the contact area and asperity load will decrease as the speed increases. Since the change of film thickness with time is continuous, the average film thickness during the acceleration period is thinner than that during the deceleration period. A similar effect is also found in Bassani et al.’s 26 pure sliding experiment. The wear rate in the acceleration period is higher than that in the deceleration period.

Evolution of friction coefficient (a), average film thickness (b), wear rate (c), contact area ratio (d), contact load ratio (e), and max pressure (f) during the first speed cycle (9.36–15.6 ms, AMP = 0.075).
The cases of 0.025 speed amplitude show similar trends, as shown in Figure 8.

Evolution of friction coefficient (a), average film thickness (b), wear rate (c), contact area ratio (d), contact load ratio (e), and max pressure (f) during the first speed cycle (9.36–15.6 ms, AMP = 0.025).
Compared with the 0.075 AMP cases, the contact parameters for the cases of 0.025 speed amplitude fluctuate less with the change of speed. The wear rate in the acceleration period is also higher than that in the deceleration period.
Figure 9 shows the topography of the disk surface after 1500 time steps (23.5 ms). The wear of the periodic speed cases is more serious than the uniform speed cases. As the amplitude increases, the local wear becomes more and more serious. This is because the surface length is limited, which results in the harsh working conditions periodically acting on the same position.
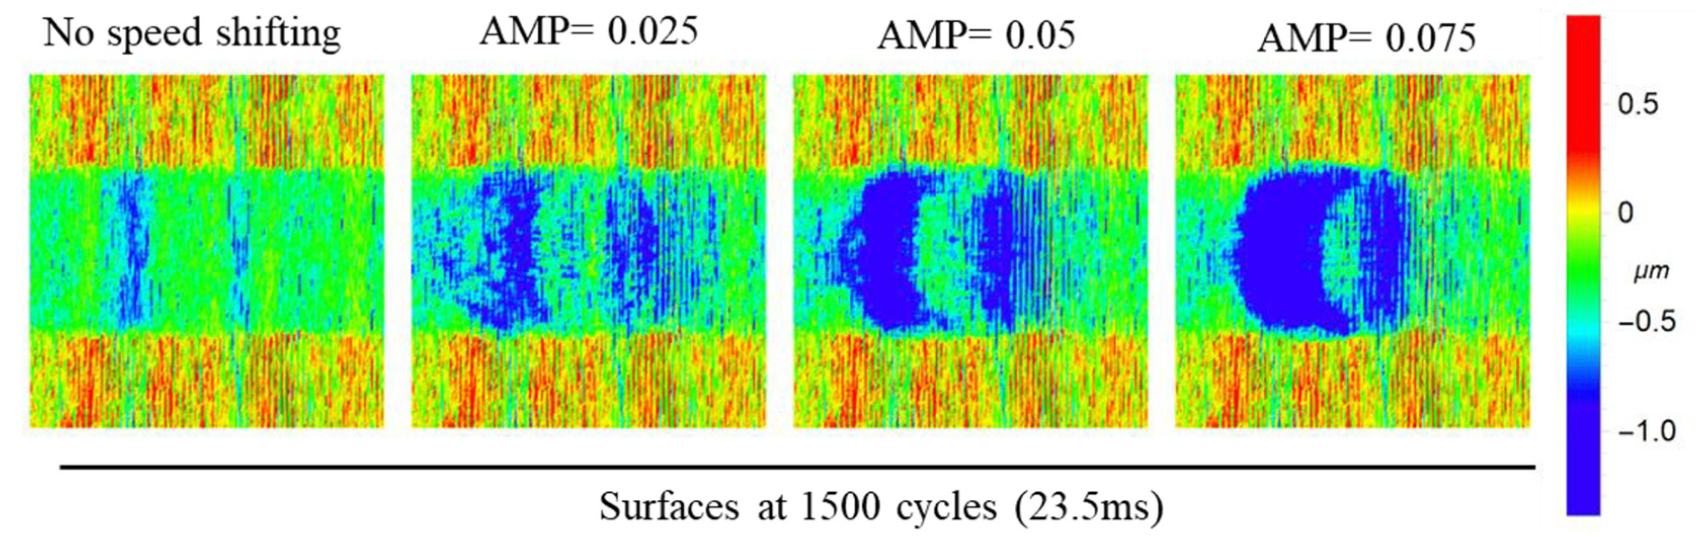
Evolution of disk surfaces at different speed shifting amplitude.
Effect of speed period on wear
The effect of speed period on wear at a constant amplitude is studied in this section. The initial speed of the ball is 0.1 m/s and the initial speed of the disk is 0.3 m/s. The SRR and load remain unchanged in the simulation. The load is 800 N. The amplitude of the speed change is 1 ± 0.05. The wear coefficients are assumed to be 5E−4 for the ball and 5E−3 for the disk. The entraining speed, as a function of time, is shown in Figure 10. The speed with infinity T is equal to the uniform velocity. The total simulation period is 5000 cycles (78.4 ms).
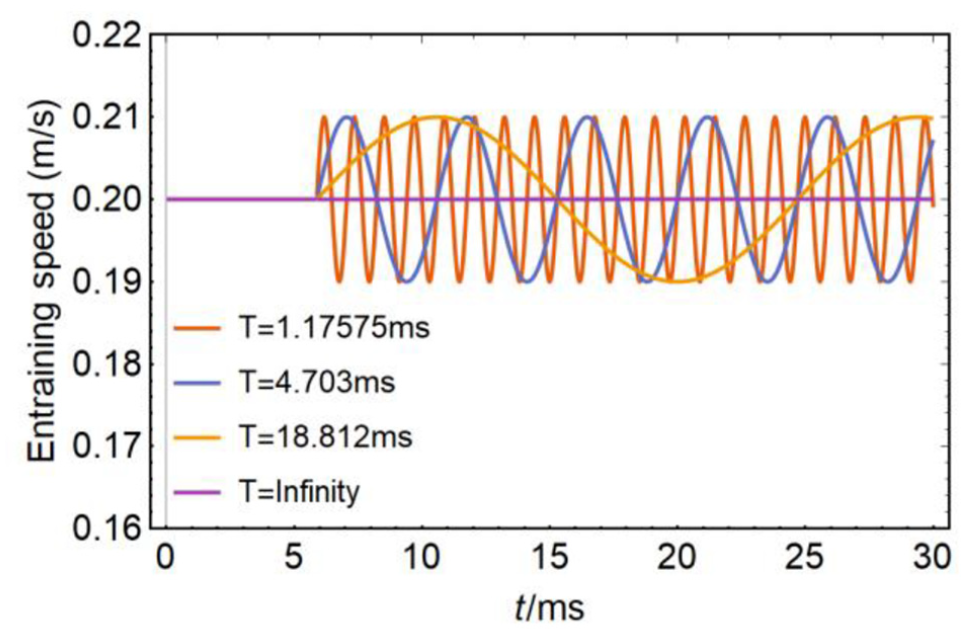
Entraining speed versus t.
Data in Figure 11 suggest that the speed period (T) has a strong influence on the friction coefficient and wear process. The frequency of friction coefficient variation is positively correlated with the frequency of velocity change, resulting from the changes of asperity contact area and load. Note that the speed with high frequency obtains low friction coefficient due to the enhanced squeezing action. The wear volume increases as the speed period increases, which agrees with the evolution of friction coefficient affected by the frequency. Besides, it suggests that the wear volume growth rate gradually increases with time, while the value is almost constant from speed with infinity T. The reason is that the asperity contact area ascends remarkably due to excessive wear compared to the constant speed. Figure 12 further reveals observable increase in surface roughness caused by wear with decreasing frequency of speed.

Evolution of friction coefficient (a), wear volume (b), contact area ratio (c), and contact load ratio (d) as a function of time (different speed periods).
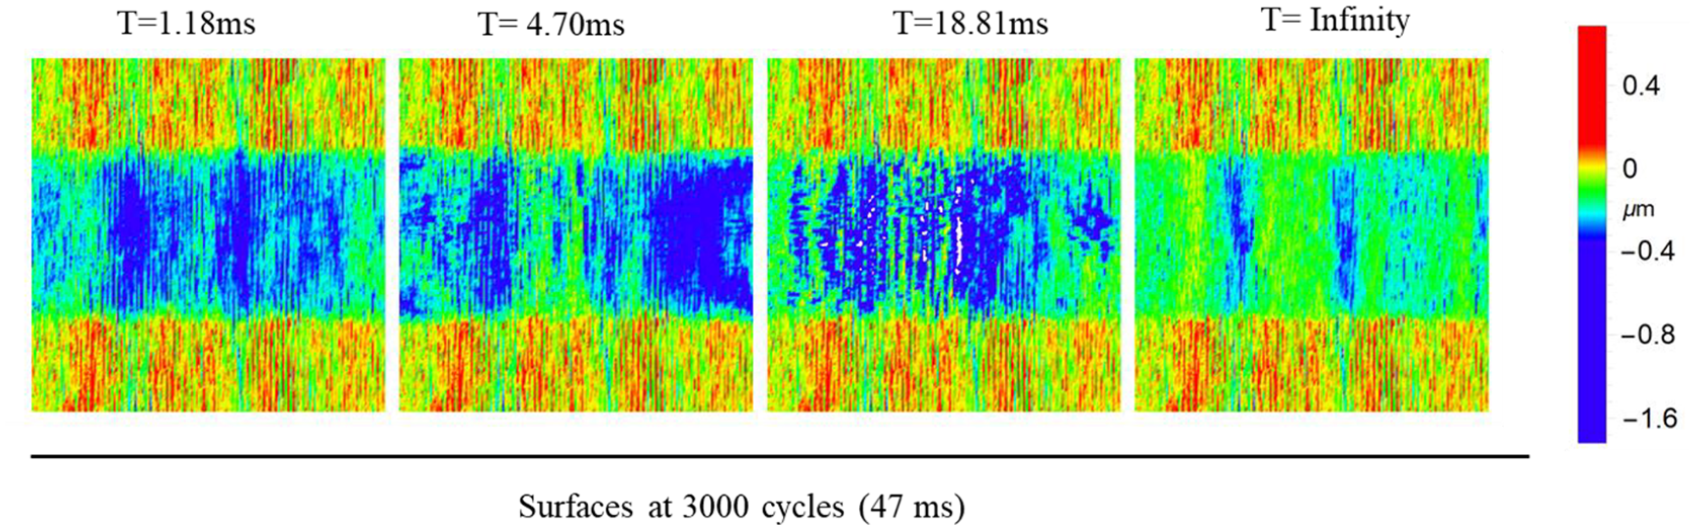
Evolution of disk surfaces at different speed shifting periods.
Effect of SRR amplitude on wear
In some transmission, such as gear, the SRR is usually time-varying. The sliding speed is usually 0 at the pitch circle and relative sliding occurs at the tooth tip and root. Therefore, based on this transmission phenomenon, the cases of changing SRR are studied. The entrance velocity is 0.2 m/s, the load is 800 N, and the wear coefficients are assumed to be 5E−4 for the ball and 5E−3 for the disk. The waveform of SRR, as a function of time, is shown in Figure 13.

SRR versus t.
Figure 14 records the variation of friction and wear in running-in process. It suggests that the friction coefficient changes periodically with the periodic change of SRR. This interesting phenomenon is more obvious with larger amplitude of SRR. The reason can be explained as follows. In the running-in process, the friction coefficient decreases monotonously if the wear goes up continuously due to roughness reduction. Thereby, the surface wear changes periodically caused by SRR, resulting in periodic variation in friction coefficient. Besides, the total wear volume is positively correlated with the amplitude of SRR, but the wear rate appears to be changed in periodical owing to the variation of contact area ration and contact load ratio. Figure 15 further shows the topography of the disk surface after 1500 time steps (35.3 ms). According to Archard’s theory, wear is caused by relative sliding. When SRR = 0, there is no wear in Figure 15. Wear increases as the absolute value of SRR increases. The changing of SRR causes uneven surface topography due to wear. It can be seen that when the amplitude of SRR is 0.1, the wear level is the most, and the wear near the pure rolling contact point is much smaller than that in the area where SRR is near ±0.1.

Evolution of friction coefficient (a), wear volume (b), contact area ratio (c), and contact load ratio (d) as a function of time (different SRR amplitude).

Evolution of disk surfaces and their formation mechanism under changing SRR.
Effect of load impact on wear
Vibration and shock are almost inevitable during the transmission process, and it is meaningful to study the influences of load impact on wear. The waveform of load, as a function of time, is shown in Figure 16. The speed of ball is 0.1 m/s and the speed of disk is 0.4 m/s. The wear coefficients are assumed to be 5E−4 for the ball and 5E−3 for the disk.

Load versus t.
Figure 17 compares four loads in terms of the changes of friction coefficient (a), wear volume (b), contact area ratio (c), and contact load ratio (d) as a function of time. The load impact is introduced when the wear is stable (after running-in). It is seen from Figure 17(a), (c), and (d) that the effect of load impact on friction is relatively small compared to periodic speed. When the load is abrupt, the friction coefficient, contact area ratio, and contact load ratio change significantly at the same time and eventually become stable as the load stabilizes. It can be seen that the friction and wear curves exhibit periodic changes in different load cycles. Wear increases during the loading phase and it decreases during the load reduction phase. For the AMP = 0.4 cases, this trend is the most obvious. However, the total wear volume growth is limited with the cycle of load. At 15.23 ms after three cycles of load loading, the wear volume of AMP = 0.4 case is 5.21E−4 mm3 while the wear volume of no impact case is 5.12E−4 mm3. The change is only 1.83%. Although the effect of impact amplitude on wear volume is very limited in the simulation, the changes in topography are still observable. Figure 18 shows the topography of the disk surface after 1500 time steps (17.6 ms).

Evolution of friction coefficient (a), wear volume (b), contact area ratio (c), and contact load ratio (d) as a function of time (different load amplitude).

Evolution of disk surfaces and their formation mechanism (load impact).
Figure 18, in the first line, shows the wear tracks at 17.6 ms under different load impacts. The wear track depths at different impact amplitudes are similar even though the widths of the wear track are different. For the cases with no impact (AMP = 0), the wear track is almost a straight line. When the impact is introduced, wear track is partially widened. The mechanism of this formation is shown in the second line of Figure 18, the contact width changes as the load fluctuates. The increase in load causes an increase in the contact width, resulting in an increase in the width of wear track. Although the effect of load on lubrication is not very significant and the friction coefficient changes little, the wear volume increases as the load increases. Meanwhile, it is worth noting that although the total wear volume is similar in the simulation, the wear width changes, which may indicate the existence of uneven wear of the surfaces.
Figure 19 shows that the pressure and contact zone during loading are larger than that during unloading, but the height of film does not change much in the contact zone. Although the load is variable, the total load and the film thickness in the contact zone appear to be nearly the same. That may explain why the total wear volume is similar for all load impact cases.
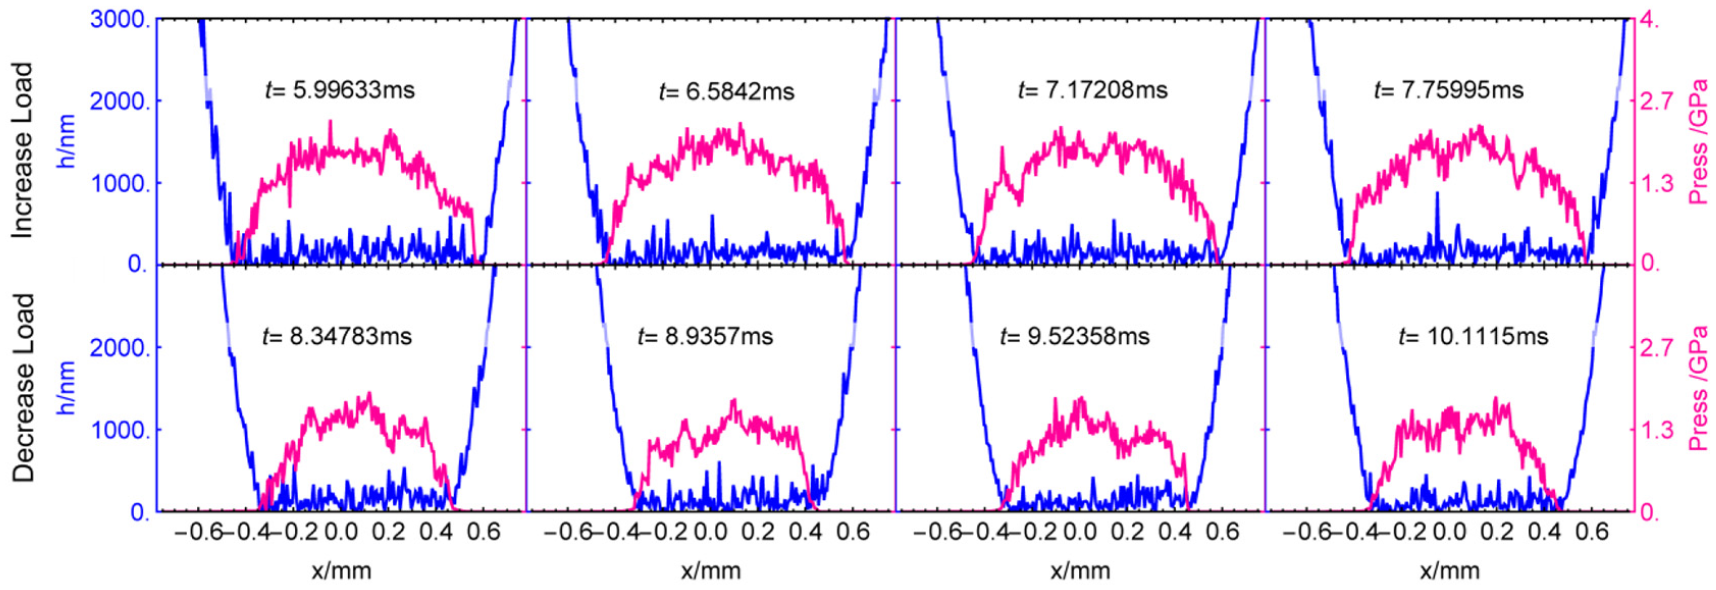
Film thickness and pressure distributions during the 0.4 impact process.
Conclusion
In this article, we develop a point contact wear model with consideration of periodic impact for real engineering rough surfaces. Through numerical simulation, the influences of impact load, speed shifting, and variable SRR on wear are studied. The following conclusions are drawn:
Periodic speed impact accelerates wear. The changes in speed could change the film thickness and wear rate. It causes uneven wear on the surfaces when the velocity periodically acts on the same area. Increasing the amplitude and period of speed can increase wear.
For the variable SRR transmission in mixed lubrication, the wear near the pure rolling contact point is much smaller than the other areas, but the friction coefficient near the pure rolling contact point is larger than the other areas due to asperity contact and the lack of running-in. Wear will increase as the absolute value of SRR increases.
The film thickness is not very sensitive to the load impact, though the contact width will change during the impact process. The wear track will widen when the load increases. The load impact can change the wear rate, but when the total load remains the same, the change of total wear volume is not obvious.
Footnotes
Appendix 1
Handling Editor: Michal Kuciej
Declaration of conflicting interests
The author(s) declared no potential conflicts of interest with respect to the research, authorship, and/or publication of this article.
Funding
The author(s) disclosed receipt of the following financial support for the research, authorship, and/or publication of this article: The authors thank the support from the National Science Foundation of China (NSFC) Project No. 51875369 and the Central Universities Funds No. YJ201752; and Dong Zhu for advice given regarding wear model.