
Abstract
The last train problem for metro is especially important because the last trains are the last chances for many passengers to travel by metro; otherwise, they have to choose other traffic modes like taxis or buses. Among the problems, the passenger demand is a vital input condition for the optimization of last train transfers. This study proposes a data-driven estimation method for the potential passenger demand of last trains. Through the geographic information, external traffic data including taxi and bus are first analyzed separately to match the origin–destination passenger flow during the last train period. A solving solution for taxi and bus is then developed to estimate the potential passenger flow for all the transfer directions of the target stations. Combining the estimated potential passenger flow and the actual passenger flow obtained by metro smart card data, the total potential passenger demand of last trains is obtained. The effectiveness of the proposed method is evaluated using a real-world metro network. This research can provide important guidance and act as a technical reference for the metro operations on when to optimize the last train transfers.
Introduction
As an important part of the public transportation system, the metro has become a major key to solve the traffic congestion problem in major cities with its advantages of fast speed, punctuality, large capacity, safety, and so on. The urban rail network in some major cities has gradually expanded over its rapid development, leading the operation mode of metro transforming from single-line mode to network-mode. One issue of particular operation concern in some cities is the last train problem. In many cities (e.g. Shanghai, Beijing, London, Moscow), train operations stop at late-night or early morning for the track and fleet maintenance. Thus, passengers may miss the last trains in late-night trips, leading them to choose other traffic modes like taxis or buses that may be more costly and take more time. As a result, the last trains are especially important because they are the last chances for many passengers to travel by metro.
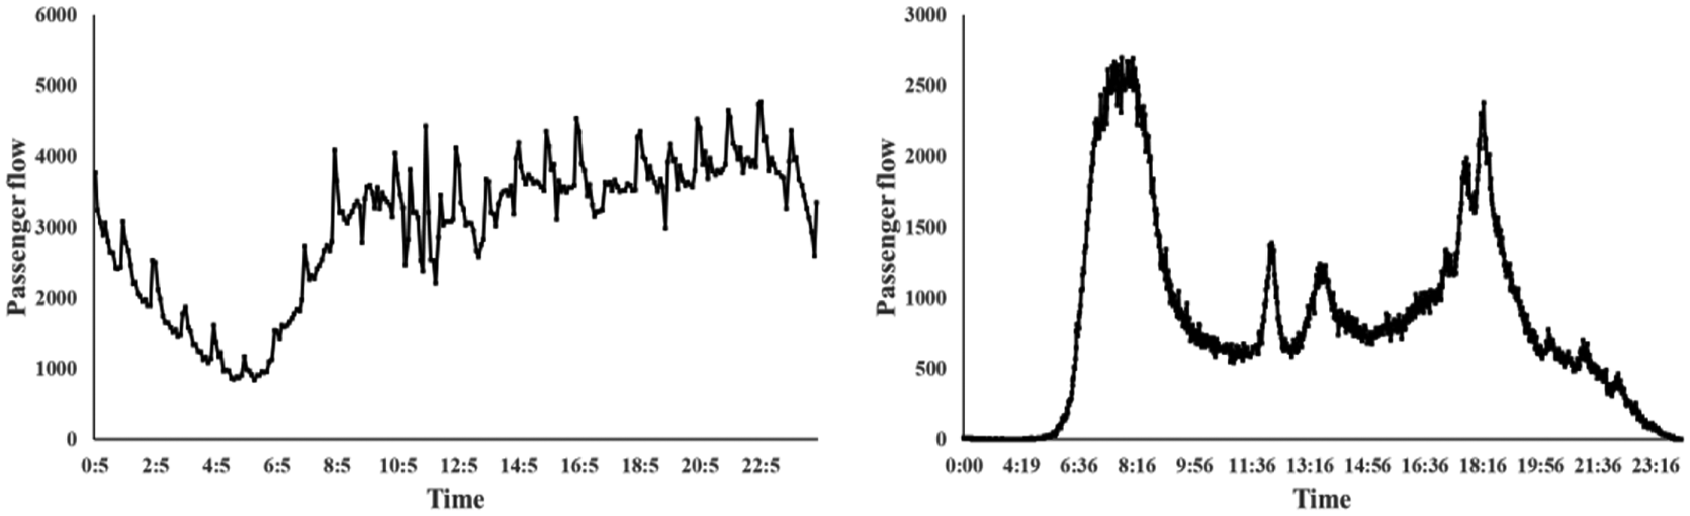
The situation of the last train problem is more common in transfer stations than normal ones. Passengers are able to ride the last trains in normal stations as long as they arrive the platforms before a given last time. However, they may miss the last trains in transfer stations after they have a transfer between two lines due to the incoordination. It is obvious that the last train problem appears more seriously as the metro network growing larger. Take two stations of the Shenzhen metro as an example, the outbound passenger flow of two stations (the normal one and the transfer one) over a whole day is shown in Figure 1. It can be seen that the trend of the normal station passenger flow is relatively stable (left), while the trend of the transfer station holds an abnormal peak near the end of operation period (right). The example indicates that many passengers may fail to ride the last trains in some transfer stations.

Outbound passenger flow of normal station (left) and transfer station (right) over a whole day.
The outbound passenger flow with train timetable at the transfer station is combined to analyze the relationship between outbound passenger flow and last trains, as shown in Figure 2. The transfer station contains two transit lines, which are Line 1 and Line 5. Each transit line has two operation directions—upstream and downstream. The left part of Figure 2 shows the train timetable at the station, in which Y-axis represents the time dimension and X-axis represents the space dimension. The dotted line in Figure 2 means the equal time between outbound passenger flow and train arrivals. It can be seen that the outbound passenger flow increases suddenly after the last trains of these transit lines arrive at the platforms. Figure 2 reveals that the sudden increasing outbound flow is related to the last train arrivals.
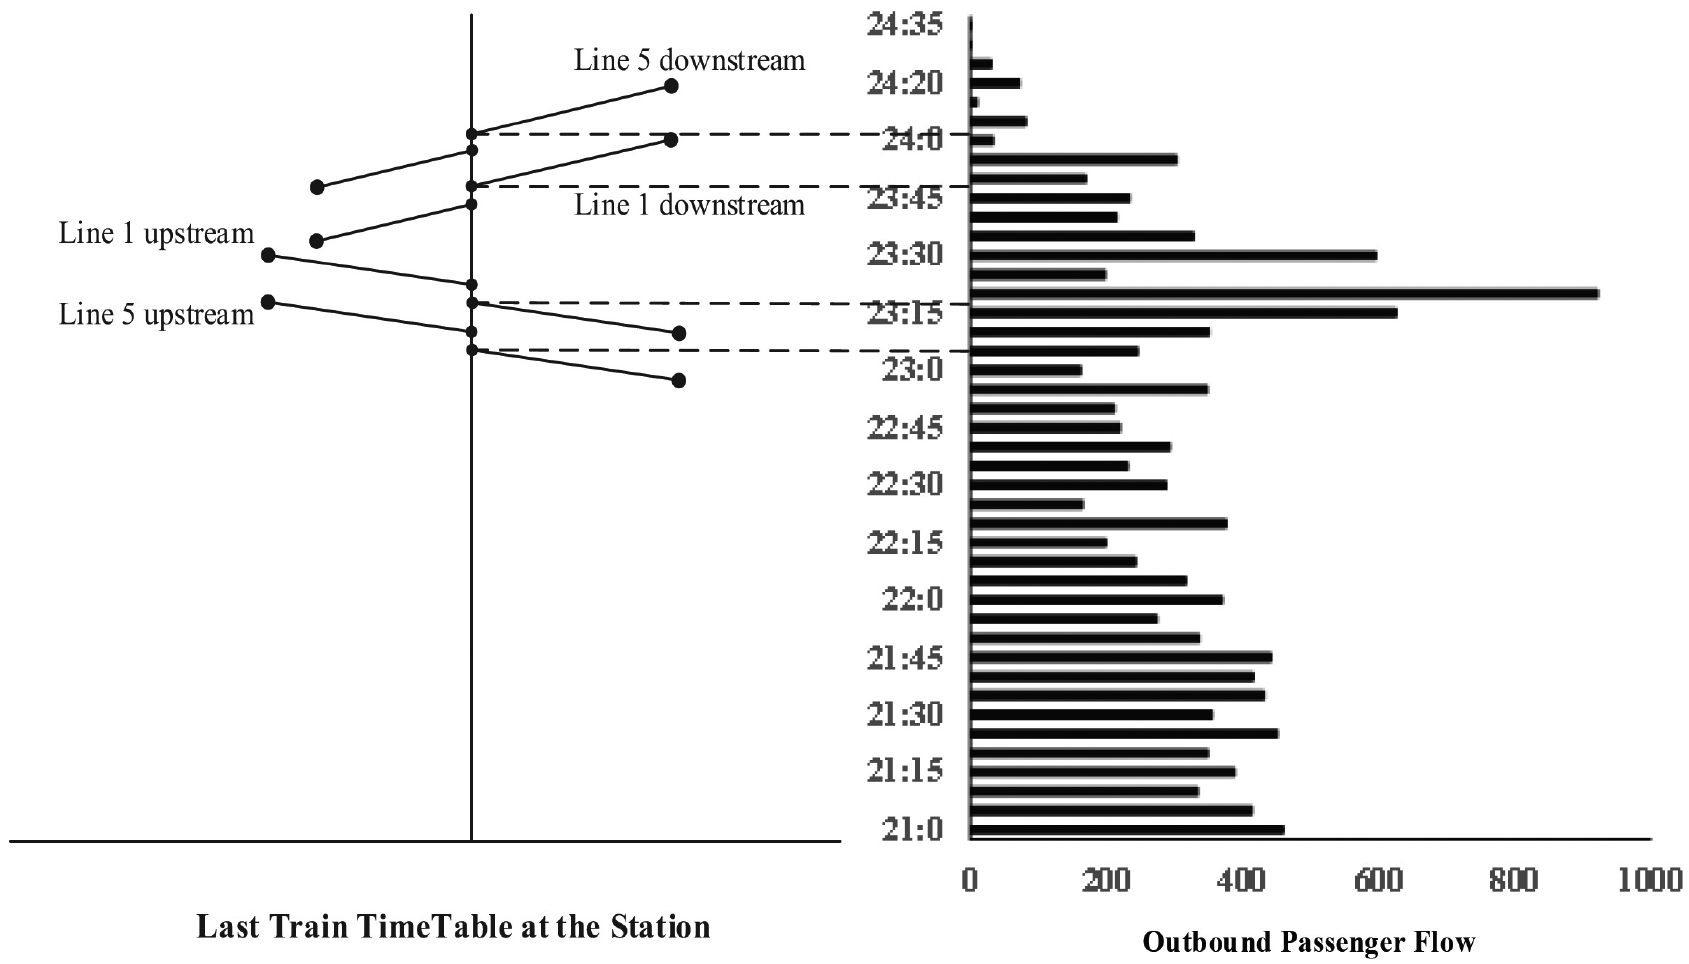
The relationship between outbound passenger flow and last train arrivals at the transfer station.
The incoordination of last train transfers not only wastes passengers’ travel time but also affects their trip experience, thereby reducing the level of metro service and potentially discouraging travelers from using the metro at late-night. Consequently, it is necessary to optimize the last train transfers to meet the demand of passengers at transfer stations during the last train period. Here, the potential passenger demand refers to the passengers travel by metro but they have to transfer to other transport modes due to the incoordination of last train transfers. The last train period is defined as the period when last trains run on networks prior to ceasing service at the end of the day. In the case of the Shenzhen metro, the last train period occurs between 22:30 and 24:00 daily and can affect more than 50,000 traveling passengers.
Previous works mostly focused on the coordination problem of last train schedule, but rather less concern on the passenger flow of last trains, which is a vital input condition for last train coordination. After the analysis of the metro passenger flow, we could figure out that the outbound passenger flow mentioned above can be divided into two parts: one is the passengers who have completed the travel, and the other is the passengers who fail to travel by metro due to the incoordination transfers. The latter passengers, alternatively, have no choices but to exit the station and choose other traffic modes to reach their destinations, such as buses and taxis. These passengers are defined as the potential passenger flow of last trains, which is potential passenger demand.
Accordingly, the external traffic data, which consist of bus traffic data and taxi traffic data, are applied to estimate the potential passenger demand of last trains in the metro. Figure 3 shows the passenger flow of taxi (left) and bus (right) near the transfer station over a whole day in a typical workday. Both passenger flow of taxi and bus hold an obvious peak at the end of the metro operation period. These passenger flows can be regarded as the passengers who fail to ride the last trains due to incoordination transfers.

The passenger flow of taxi (left) and bus (right) near the transfer station over a whole day.
In summary, this study proposes a data-driven estimation method to integrate a large number of automatic fare collection (AFC, one kind of smart card used in metro) card data, bus global position system/intelligent card (GPS/IC) data, and taxi GPS data. The data-driven method could analyze the correlation among these data, and carry out the outbound passenger flow of the transfer station for the last train incoordination. As a result, the obtained potential passenger demand can be used as the basic data for guiding the coordination of last train schedule. It is supposed to improve the service and the attraction of the metro.
The remainder of the study is organized as follows. Section “Literature review” provides a literature review on last trains coordination and last trains passenger demand. In section “Methodology development,” a data-driven method on estimating the potential passenger flow of last trains based on taxi and bus data is proposed. Section “Case study” carries a numerical example with a real-world case of the Shenzhen metro network. The last section draws the conclusions and discusses some further research topics.
Literature review
The last train problem for metro plays a key role in managing and operating the metro system. Recently, various studies have attempted to address the issues of last train coordination and last train passenger demand. The primary focus of the previous work is to optimize the last train coordination with the adjustment of train schedules over the network.
Last trains coordination
Many scholars have conducted rich researches on the optimization strategies for the last train coordination, mainly in two aspects: minimizing the passenger transfer waiting time and ensuring more passengers be able to transfer. The last trains schedule was optimized with the objective function of minimizing the passenger transfer waiting time. For example, some studies established a collaborative optimization model for the last train timetable with the goal of minimizing the total passenger transfer waiting time, and generating the last train coordination connection plan by adjusting the departure interval, stop time, and interval running time.1,2 Kang et al.3–6 studied the transfer redundancy time and transfer waiting time under the connection scheme for last trains, and constructed the network last train schedule optimization model. Besides, from the perspective of ensuring that more passengers were able to transfer, the stop time of the transfer station was extended to realize the successful connection of the last train from two ways, by compressing the last bus interval running time and the stop time of the non-transfer station.7–13
Last trains passenger demand
Though previous studies have been conducted on last train coordination, these previous studies represent a range of methodological approaches and are based on different types (i.e. sources) of passenger demand data. Table 1 compares and contrasts the previous studies with the solution proposed in the current study.
Summary of previous last train coordination studies.
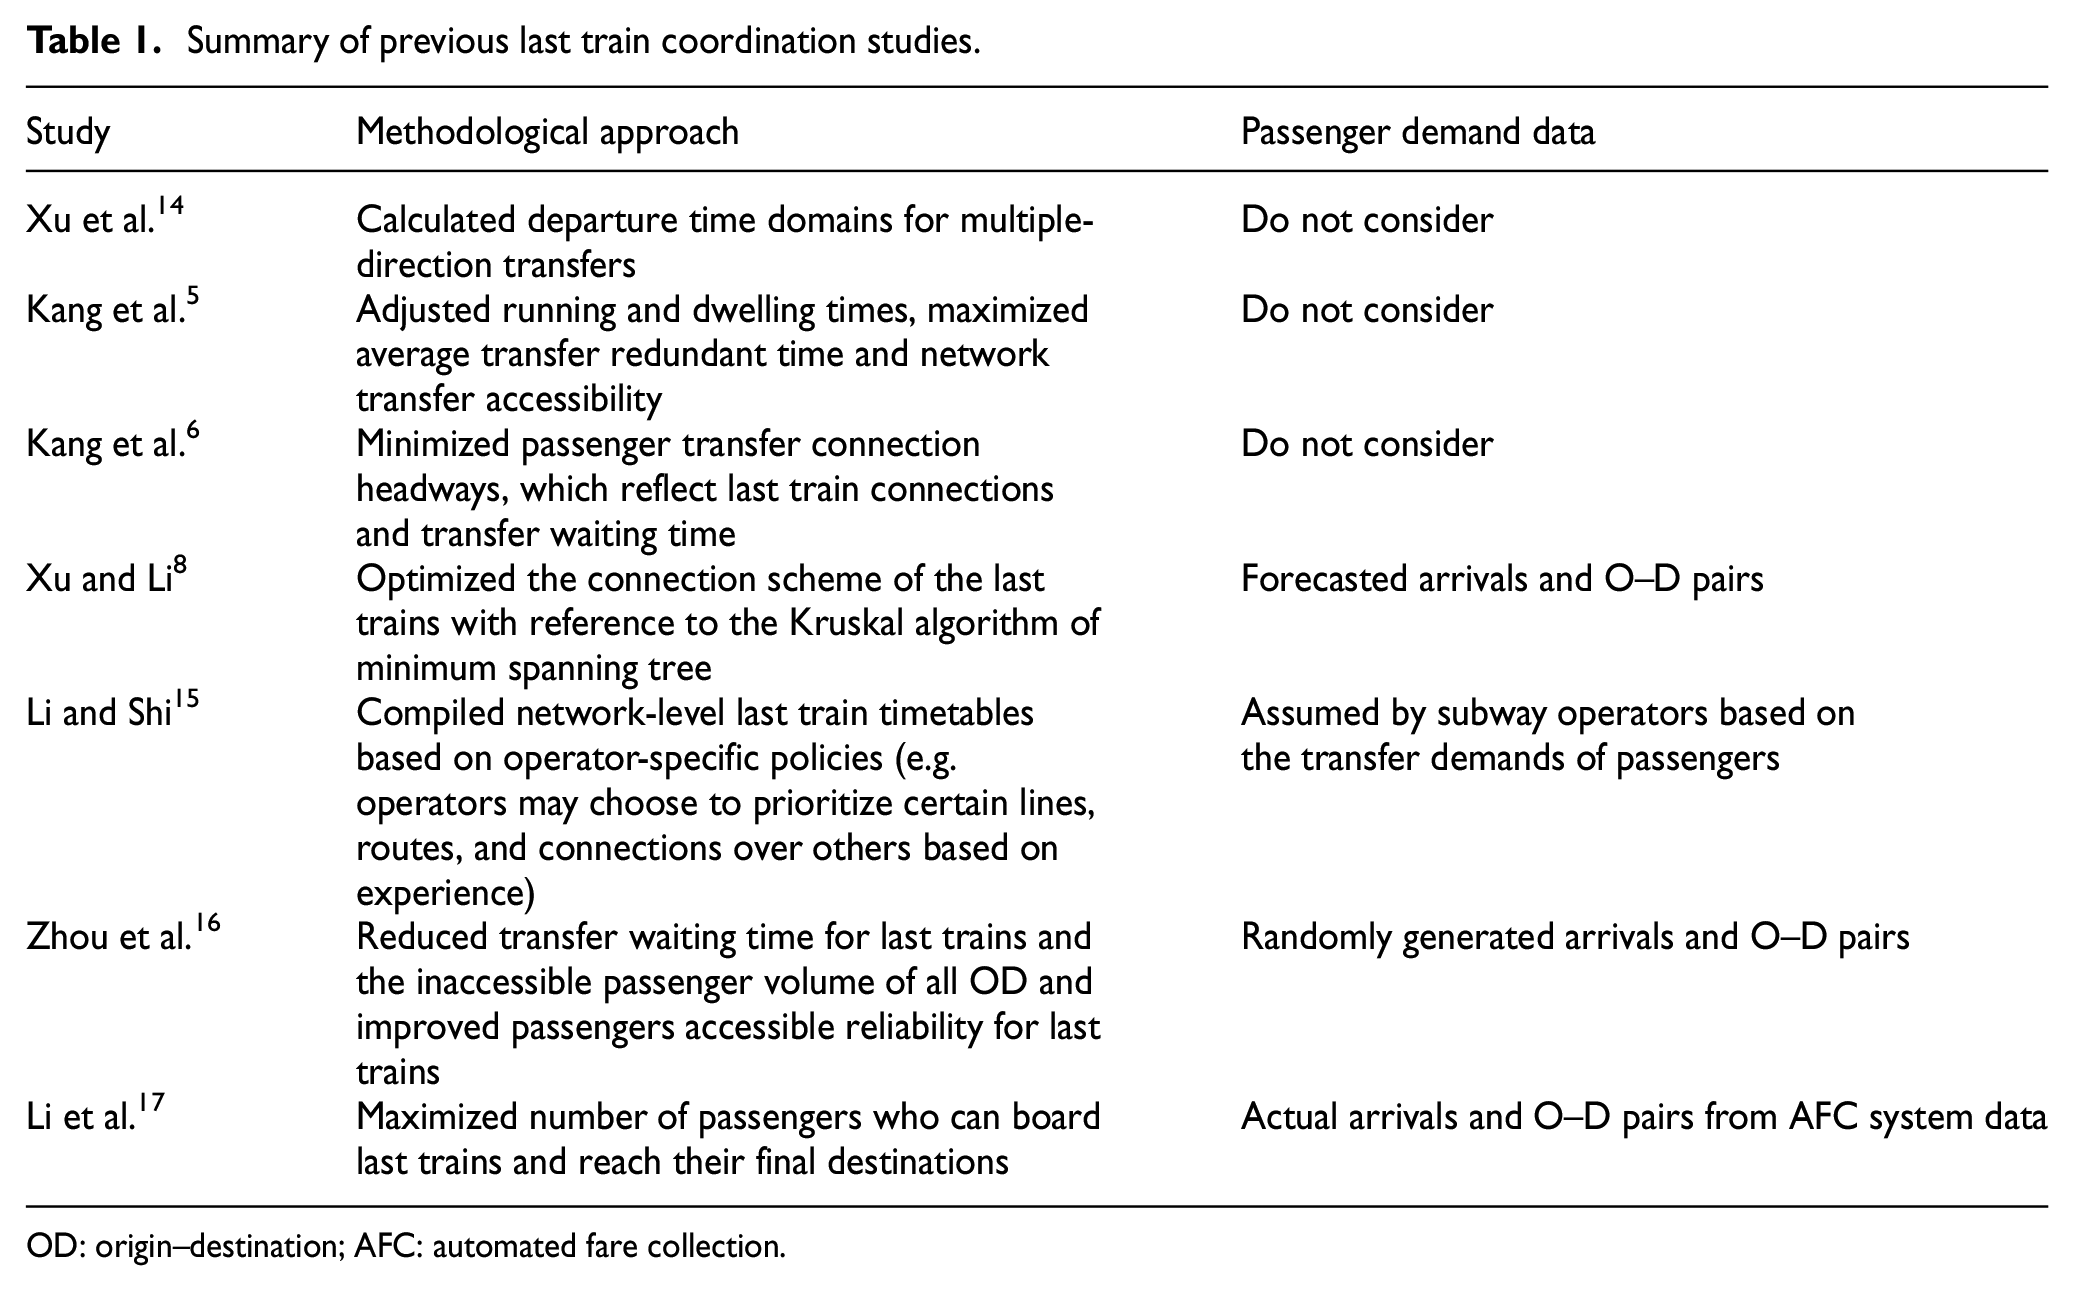
OD: origin–destination; AFC: automated fare collection.
Few of the previous studies described above considered actual passenger flow demand during the last train period. Some studied the last train problem without the consideration of passenger flow demand5,6,8,14–16 assumed that O–D demand is given. On the one hand, O–D demand during the last train period is difficult to forecast in a large metro network. On the other hand, the hypothetical O–D demand used in real-life cases may lead to completely different results compared to realistic situations. Li et al. 17 applied actual arrivals and O–D pairs from AFC system data as the passenger demand data of last trains, but they didn’t consider the potential passenger demand. Thus, it is necessary to study the forecast on potential passenger demand of last trains in the metro.
At present, thanks to the extensive applications of public transportation IC, GPS (geography position system), and AFC in urban public transportation and taxi systems; the collection of passengers’ specific travel time and geography information record has been realized, providing a data support for the forecast of potential last trains passenger demand.
Methodology development
A data-driven method for estimating the potential passenger demand of last trains is proposed. The purpose of the method is to estimate the demand of passengers who transfer to other transit lines during the last train period. Then, the result can be used as an input condition to develop an optimized last train schedule, which can maximize the successful transfers for passengers. As such, the external data used in the proposed method are GPS and IC data of bus, and GPS data of taxi. These external traffic data are discussed in the following part.
Basic assumptions
To facilitate the presentation of the essential ideas without loss of generality, the following basic assumptions are made in this study:
It is assumed that passengers exit the system directly during the last train period proceed without lingering or engage in non-travel activities (purchasing coffee, etc.).
One taxi traffic data record is regarded as single person travel, that is to say, two or more passengers share a taxi is not considered.
In order to obtain the alighting records for bus traffic, IC holders are assumed as commuters or regular public transit passengers so that their enter stations (bus or metro) of next trip are regarded as the exit stations of this trip.
Model specification
Suppose there are
Model parameter definition.

IC: intelligent card.
The estimation model for potential passenger demand is listed as follows


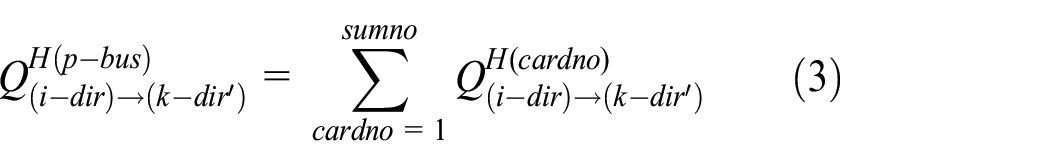
where equation (1) represents the components of potential passenger demand in each direction of metro lines at the transfer station, equation (2) means the passengers who transfer to taxis, and equation (3) means the passengers who transfer to buses.
Model solution
Since the components of taxi and bus data are different, the two kinds of data should be addressed in different methods to estimate the potential passenger demand for last trains. Then, the results are added up according to equation (1).
Matching taxi passenger flow
Taxi mode is an extension and replacement mode for the metro, especially after the regular service period of the bus and metro. It can still provide services for passengers to ensure their travel integrity. However, taxis are different from the metro or buses because it is hard to obtain trip information by matching card ID through smart cards. The taxi traffic data (floating car data (FCD)) recorded by taxi GPS are the taxi operation information, which consists of longitude, latitude, and GPS time. Then, the trip information of taxi passengers during the last train period is calculated by filtering the FCD data whose origin is within the range of the target station and destination is within the range of destination station.
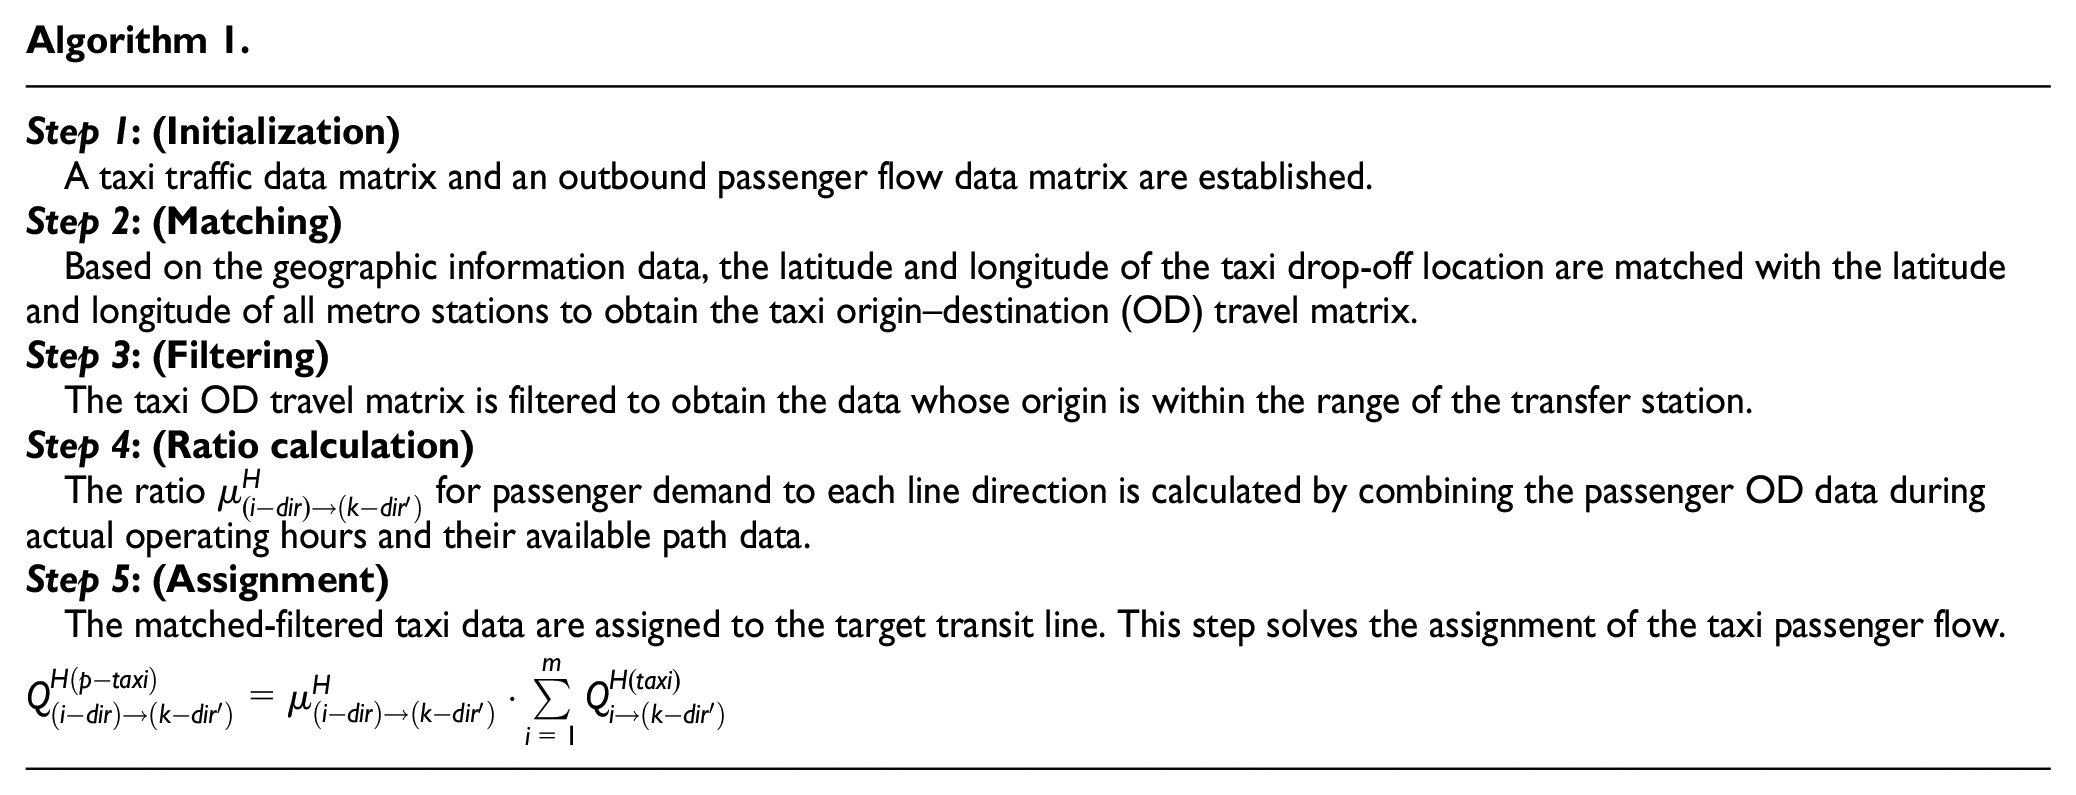
In addition, the passenger flow ratio of each line direction at transfer stations is needed to assign the passenger flow with potential transfer needs, which is matched from taxi data. The detailed flow chart for matching taxi passenger flow is shown in Figure 4, and the specific algorithm is given in Algorithm 1:

The flow chart of matching the taxi and metro passenger flow.
Matching bus passenger flow
Smart cards and GPS systems have been widely used in urban public systems. Thus, the passenger travel information obtained by smart cards and GPS systems can be easily used to analyze the travel pattern and characteristics of public transport passengers.
To obtain the passenger demand from bus traffic data, the IC number is first matched according to the principle that the card number exists both in the bus and metro during the last train period, which represents that the passengers are possible to travel from the metro to buses. Then, the geographic coordinates of bus stops are associated with metro stations according to the geography information. If the bus stop is located within the service area of a metro station, it is believed that the passenger could be a potential customer of the transfer station.
However, it should be noted that the bus traffic data recorded by the smart card system do not contain passenger alighting information. These data should be fixed by historical travel data. As shown in section “Basic assumptions,” IC holders are assumed as commuters or regular public transit passengers, so that their enter stations (bus or metro) of next trip are regarded as the exit stations of this trip. By tracing enter and exit stations information of the historical passenger IC data, the passengers’ travel routes during the last train period can be obtained.
The detailed flow chart for matching bus passenger flow is shown in Figure 5, and the specific algorithm is given in Algorithm 2:

The flow chart of matching bus and metro passenger flow.

Combining all traffic data
The above two algorithms apply the external multi-source traffic data to estimate potential passenger demand of last trains during the last train period. The proposed method obtains potential passenger flow in the direction of each line at the transfer stations by combining the two kinds of potential passengers demand according to equation (1).
Also, the potential passenger demand of last trains contains not only the passengers who fail to board the last trains, but also the passengers who succeed to board the last trains. Hence, all traffic data concluding the passenger flow from metro data, taxi data, and bus data are combined to obtain a total potential passenger demand of last trains.
Case study
The proposed method is tested on the Shenzhen metro network, which operates eight transit lines connecting 199 stations and transports about 3.2 million passengers in a day of April 2018, as shown in Figure 6. In this case, the transfer station of “Bao’an Center” is selected as an example to show the process of the proposed data-driven method, which is circled in the red color.

Shenzhen metro network.
Input data
A typical Friday (13 April 2018) with good weather and no sport or concert events is selected as an example to deal with the case study. It is well known that there is more night passenger demand on Friday compared with other weekdays. The reason is that more people prefer to work late or stay late for entertainment on Friday night since Saturday is not working day. Hence, there is a more desperate need to study Friday late-night metro demand.
All data needed in the case study are listed below, whose source is from the Shenzhen public transportation department:
Metro passenger flow: there are a total of 3,589,934 passengers who travel through the metro system.
Taxi passenger flow: A total of 864,305 records are generated over a whole day, among which 42,207 records generated during the last train period, as shown in the left part of Figure 7.
Bus passenger flow: In total, 1,036,732 IC records are generated over a whole day, among which 8324 IC records generated during last train period, as shown in the right part of Figure 7.
The GPS data: the GPS data of taxi and bus, and also the geography information of metro stations and bus stations are acquired.
The passenger flow of taxi (left) and bus (right) over the whole day.
It is found that the more days’ traffic data in the same typical day used in the proposed method, including metro AFC data, taxi data, and bus data, the more accuracy and correctness of the potential passenger demand the proposed method can produce.
Solutions for taxi and bus
A solution for taxi
We first analyze the taxi traffic data (FCD) with the model solution for the taxi data in section “Model specification.” After filtering the GPS data, the taxi traffic data whose origin is close to the target station (Bao’an Center) are remained. The taxi passenger flow during the last train period is shown in Figure 8. Based on the filtered result, the taxi passenger flow is assigned to the transit lines which is related to the target station, as shown in Figure 9. Consequently, the potential passenger demand using taxi traffic data is estimated.

Taxi passenger flow whose origin is close to the target station during the last train period.

Result for calculating the potential passenger flow using taxi data.
Solution for bus
In the same way, we apply the solution for the bus data to the case study. The bus GPS data and IC (smart card) data are relatively low at late-night compared to the regular period. Figure 10 shows the bus passenger flow whose origin is close to the target station. Then, the result of the potential passenger demand is calculated according to the principle that the destination stations of the data should belong to the target transit lines, as shown in Figure 11. It should be noted that more historical bus data can improve the accuracy to speculate the possible alighting location for passengers.

Bus passenger flow whose origin is close to the target station during the last train period.

Result for calculating the potential passenger flow using bus data.
Combination of two results
After the estimation of the potential passenger demand using both taxi and bus traffic data, we could combine these demand to form an integrated potential passenger demand. The combining result is shown in Figure 12. In addition, useful passenger demand data are the sum of passenger flow in different directions, which are displayed in Table 3. In this table, the directions of upstream (↑) and downstream (↓) mean the train operation directions of metro lines. Each line has two operation directions. The table shows that the biggest flow direction is transit Line 1 downstream.

The potential passenger flow combining taxi and bus data.
The potential passenger flow of last trains generating by taxi and bus.
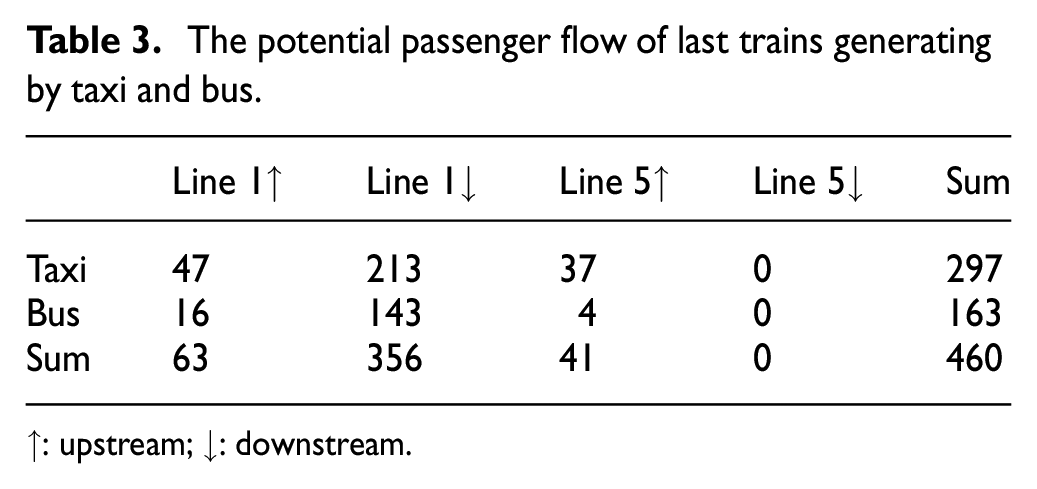
↑: upstream; ↓: downstream.
Combined with the last train timetable, the potential passenger flow for all transfer directions of last trains is concluded in Table 4. The table indicates that the transfer direction of Line 5 downstream to Line 1 downstream holds the biggest passenger demand.
The potential passenger flow for all transfer directions of last trains.

↑: upstream; ↓: downstream.
Result analysis
As stated above, the potential passenger demand of last trains contains not only the passengers who fail to board the last trains and transfer to taxis and buses, but also the passengers who succeed to board the last trains. The passenger demand who succeed to board the last trains is displayed in Table 5, which is obtained from the AFC system. Hence, the total potential passenger flow of last trains is added up combining all traffic data source. The result is shown in Table 6. The passenger demand of different directions reveals the importance of transfer directions at the target station, which is quite useful to optimize the last train transfers.
The passenger flow of last trains obtained by the AFC system.
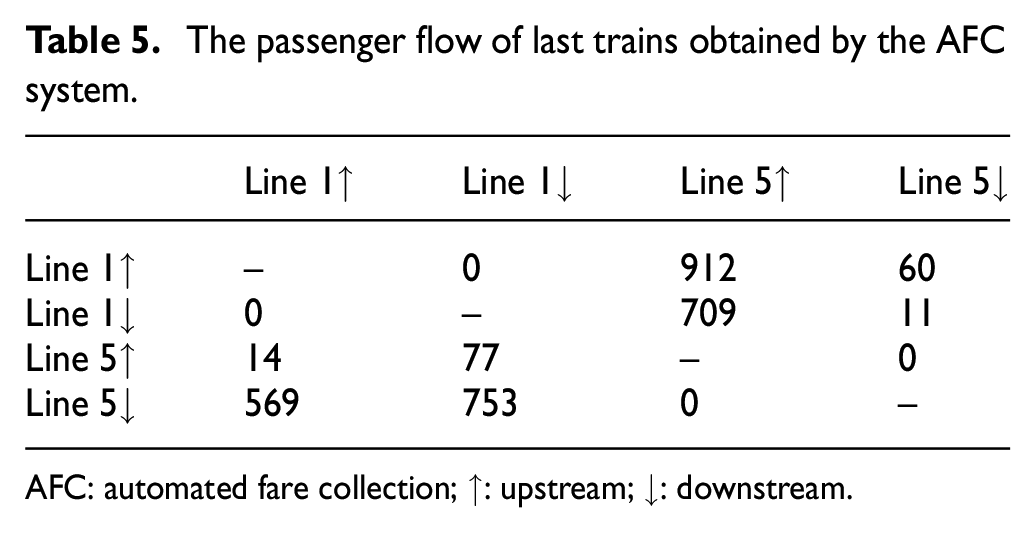
AFC: automated fare collection; ↑: upstream; ↓: downstream.
The total potential passenger flow of last trains combining all traffic data source.

↑: upstream; ↓: downstream.
Compared to the regular passenger flow of last trains obtained by the AFC system in Table 5, the most important transfer direction transforms from the direction of Line 1↑–Line 5↑ to the direction of Line 5↓–Line 1↓. The result means that the transfer direction of Line 5↓–Line 1↓ is much more important and it should be given more consideration when optimizing that last train transfers or compiling the last train schedules. This result can be acted as an important input condition in the last train coordination problem.
This study accounts for the potential passenger demand of last trains using the proposed data-driven estimation method. The case study demonstrates the effectiveness of the proposed method. It is found that the more traffic data used in the proposed method, including metro AFC data, taxi data, and bus data, the more accuracy and correctness of the potential passenger demand the proposed method can produce. The proposed method can be easily applied to the other transfer stations with the same algorithm process.
Conclusion
This study focuses on estimating the potential passenger demand during the last train period based on external traffic data including taxi and bus data. The proposed method makes full use of passenger travel information, passenger flow data collected by the AFC system, and external travel data. Two solving solutions for taxi and bus are carried out to calculate the potential passenger demand in the transfer directions of the target stations. Finally, the proposed method is successfully tested on a real-world case study, and it clearly demonstrates the effectiveness and correctness of the proposed data-driven estimation method. The result of the potential passenger demand can be applied as an input condition to the optimization of last train coordination. Our future study will consider more traffic modes except for taxi and bus, and improve the accuracy and correctness of the proposed data-driven method. Further study will also focus on extending the study of late-night demand under different conditions.
Footnotes
Handling Editor: James Baldwin
Declaration of conflicting interests
The author(s) declared no potential conflicts of interest with respect to the research, authorship, and/or publication of this article.
Funding
The author(s) disclosed receipt of the following financial support for the research, authorship, and/or publication of this article: This study is supported by the Research Projects of Natural Science Foundation of Guangdong Province under grant no. 2018A030313119 and the Ordinary University Innovation Project of Guangdong Province under grant no. 2018KTSCX350.