
Abstract
Maximum ceiling temperatures in a tunnel with different ventilation velocities with three heat release fires are studied experimentally and theoretically. This article investigates the ventilation velocity effects on maximum ceiling temperature combustible materials around ignition source in tunnel fires. Several fire experimental tests are conducted with longitudinal ventilation velocity changes in a small-scale tunnel (23 m in length, 2 m in width, and 0.98 m in height), where three heat release fires (237, 340, and 567 kW) and their corresponding values in the real tunnel are 20, 30, and 50 MW, respectively. This article modifies the current temperature prediction model taking the ignition materials near the fire source into account in tunnels. Results show that the ceiling maximum temperature increases, corresponding to the burn time when other experimental conditions remain unchanged for a given fire heat level source. The ceiling temperature reduces quickly when the ventilation velocity is increased from 0.5 to 2.0 m/s. Moreover, this article proposes an equation that can be used to estimate the ceiling maximum temperature variation value with three heat release fires in tunnels. Finally, experimental results are also compared with the tunnel ceiling temperature attenuation equations established by Alpert, Heskestad, and Ingason. The equation proposed in this article appears to provide better estimates of ceiling temperature variation than the Kurioka model developed in their scaled experiments. The prediction agrees well with the experimental and measured data by the modified equations of this article.
Introduction
The rapid detection of tunnel fire is one of the important issues in tunnel fire prevention. It is a great significance to study the temperature variation of tunnel fires. 1 However, due to the tunnel is long and narrow space, it is difficult to put out fire. Therefore, it is very important to detect fire accidents in early stages of a tunnel fire accident. For tunnel temperature detectors, the identification of temperature below the tunnel ceiling is particularly important. In medium-scale tunnel fires, the heat release rate (HRR) of fire sources is between 20 and 50 MW. Therefore, the high HRR is between 20 and 50 MW in medium-scale tunnel fires. For high release rate fires in tunnels, the flame impinges the ceiling. These reduces the heat feedback from ceiling and walls. However, the heat feedback plays an important role in heat balance under the longitudinal ventilation. Thus, it is important to study the influence of HRR and longitudinal ventilation velocity on tunnel ceiling temperature. It provides a theoretical basis for tunnel design and detection system.
In order to provide adequate fire prevention for the tunnel structure, the maximum smoke temperature should be determined below the tunnel ceiling, where the structure is exposed. However, the maximum smoke temperatures are related to HRR, longitudinal ventilation speed, and tunnel height. 2 In tunnel fires, the development of flame plumes and smoke propagation are also important. 3
A lot of previous studies on tunnel temperature have been carried out through experiments, theoretical analysis, and numerical simulation methods. Alpert 4 proposed two simple correlation equations to predict the highest over-temperature without any smoke accumulation under the tunnel ceiling. A formula for correcting the temperature of tunnel ceiling with great influence on the flame plume was proposed by Heskestad and Delichatsios. 5 Ingason and Li 6 carried out scale tests of rectangular tunnel model. Kurioka et al. 7 studied the prediction model of the maximum smoke temperature of tunnels based on the small-scale longitudinal ventilation tunnel experiment. More recently, in order to study the maximum temperature below the tunnel ceiling, a majority of tests were carried out in the small-scale tunnel, and the formula for the temperature distribution was corrected.8,9 Wan et al. 10 studied the temperature characteristics of ceiling smoke caused by two interacting energy sources in tunnel to guide the heat detector and sprinkler arrangement in the tunnel. Sensitivity analysis was performed by SK Khattri 11 determines the effect of ventilation velocity on the maximum ceiling temperature and floor temperature. Y Oka and O Imazeki 12 studied the velocity and temperature distribution of inclined tunnels. This article is used to predict fire phenomena in real tunnels through scale tunnel simulation.
The maximum temperature distributions below tunnel ceiling were studied by small-scale experiments and full-scale experiments. G Heskestad 13 described a full-scale tunnel to study the space fire source pollution field. Based on the flame theory, Li and Ingason 14 theoretically analyzed the maximum temperature below the tunnel ceiling. In order to study the temperature distribution of the heat flow under the tunnel ceiling, two sets of model-scale tests were conducted, Zhou et al. 15 performed a series of full-scale simulations of tunnel fires. Tang et al. 16 proposed a normalized equation of the ceiling maximum plume temperature, through the addition of an impact factor for the ceiling smoke extraction rate, of a ceiling jet induced by rectangular-source fires. Huang et al. 17 studied the effect of tunnel entrance ceiling ratio on fire behavior, with different HRRs and ceiling ratios varied from 0% to 100%. They calculated the temperature distributions along the tunnel ceiling. Huang et al. 18 conducted small-scale experiments in a branched tunnel, for studying the maximum ceiling temperature in tunnel. They changed HRRs from 1.72 to 6.04 kW with natural ventilation and forced ventilation, considering three bifurcation angles of 5°, 10°, and 15°. Chen and Tang 19 experimentally conducted the effect of the longitudinal ventilation on the ceiling temperature decay, considering the effective tunnel height, fire HRRs, and longitudinal ventilation speeds in a small-scale ventilated tunnel.
The experimental results showed that the full-scale tunnel fire test can better predict the maximum ceiling temperature of the tunnel.
It is not the most cost-effective method to conduct comprehensive experiments. It is expensive, it takes a long time, and it is very complicated. 20 In tunnel fires, maximum temperatures near the fire source often cause significant damage to the tunnel structure. Therefore, it is very important to protect the tunnel structure from fire. Thus, it is necessary to understand the temperature of the smoke and the temperature distribution under the ceiling in tunnels. However, the Froude number and dimensionless HRR are inaccurate for predicting the maximum temperature of high heat release fire tests. It is shown that experimental fire tests are less in medium-scale tunnel. The maximum temperature model of existing high heat release fires has certain limitations in tunnels. This is reflected in the fact that ventilation velocity is not fully considered. J Drenda et al. 21 carried out a ventilation velocity about 1 to 3 m/s, which is 20 m from the fan outlet, in the mining of Polish copper ores. Król et al. 22 investigated the normal and reversed velocity of air flows in tunnel with longitudinal ventilation. The results showed that the ventilation has a great influence on the temperature distributions. However, the current model for predicting temperature distribution is not taking the ignition materials near the fire source into account in tunnel. Therefore, the combination of the reduced-scale test and the small-scale numerical simulation is used to modify the relationship in equations (1)–(4), which takes the ignition materials near the fire source into account in tunnel.
In this article, the Froude model is used to establish links between the actual tunnel and the small-scale tunnel. On the basis of the small-scale tunnel experimental tests, the theoretical analysis of the maximum temperature under the medium-scale tunnel fire was carried out. Through the estimation of the experimental results, the analytical expression of the maximum ceiling temperature considering the influence of high heat release fires and longitudinal ventilation is obtained. The reduced-scale-tunnel experimental results are corresponding to the numerical simulation of full-scale tunnels. A new correlation for predicting temperature distribution takes the ignition materials near the fire source into account in tunnel. By comparing with previous studies, it is found that the new correlation is in good agreement with the experimental results and the numerical simulation results in this article.
Methods
Theoretical analysis
The maximum smoke temperature below the tunnel ceiling was described from previous studies. Heskestad and Delichatsios 5 proposed an improved a high-impact flame plume ceiling temperature
Ingason and Li 6 studied the maximum temperature shown in equation (2)

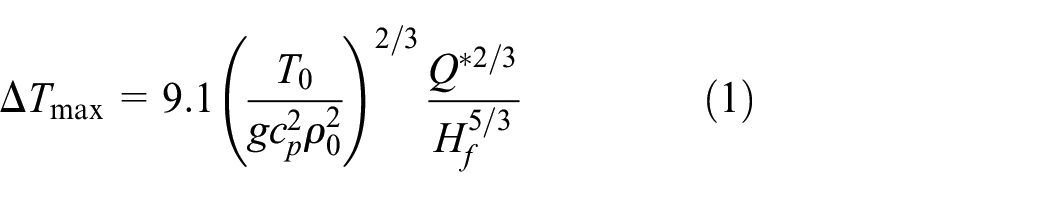
Alpert 23 provided a simple correlation equation to predict the maximum temperature without a ceiling in a tunnel

where
Kurioka et al. 7 proposed a model for predicting the maximum smoke temperature under the ceiling of a tunnel based on experimental tests with longitudinal ventilation in tunnels


where
In order to verify the reliability of the Kurioka model, Hu et al. 3 conducted a full-scale experiment and Fire Dynamics Simulator (FDS) numerical simulation. According to the relevant parameters of the practical project, Hu et al. 3 proposed the maximum temperature below the tunnel ceiling when different types of vehicles under fire. However, due to the uncertainty of flame flow, the conclusions of different researchers are not consistent. Therefore, further research on the tunnel is needed.
Li and Ingason 14 proposed a model to predict the maximum temperature below an inclined tunnel ceiling by modifying the Kurioka model. Equation (7) is corrected by them
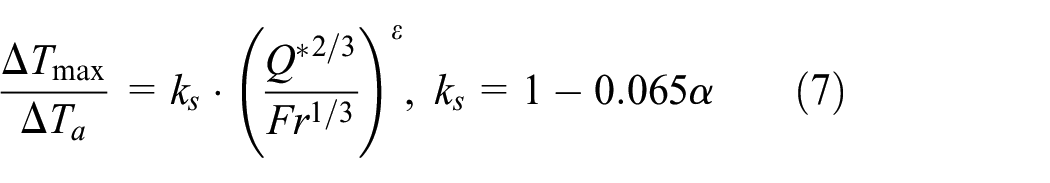
where
Li and Ingason
14
conducted a test to study the maximum smoke temperature under the tunnel ceiling. They proposed equation (8). The dimensionless ventilation velocity
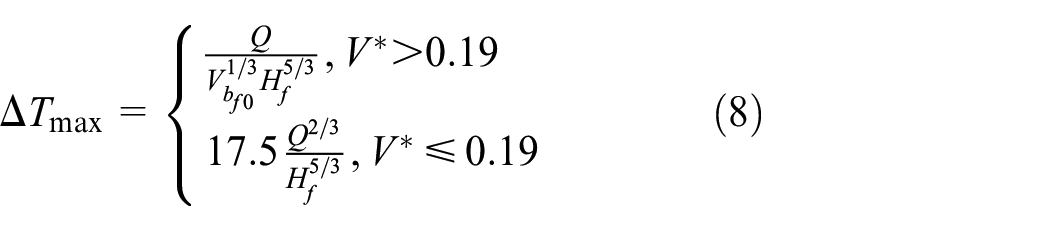
where bf0 is radius of fire source, m;
Then, Li and Ingason 14 analyzed the maximum temperature at 1350°C. Equation (8) is used for large tunnel fires, and the predicted value should not exceed the limit. Considering the effect of ventilation velocity and large fire HRR on the temperature, it is necessary to correct the maximum tunnel ceiling temperature.
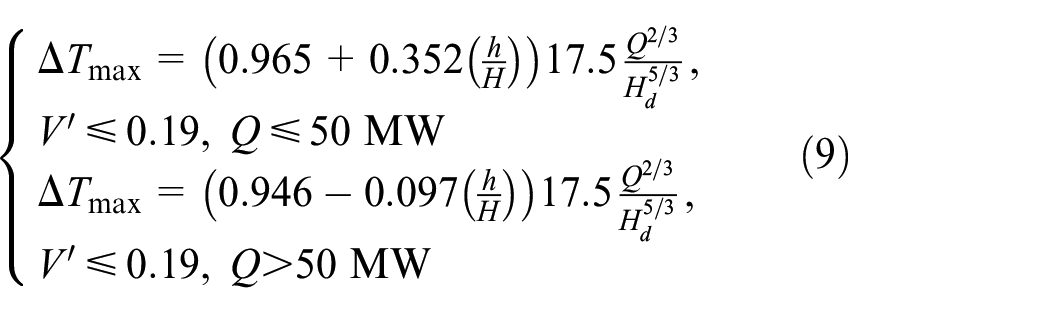
Chen et al. 24 proposed a correlation in equation (9) to divide HRR into two groups to analysis the relationship between maximum temperature and ceiling ratio. The tunnel entrance ceiling height (h) is normalized by tunnel height (H) that is h/H
Tang et al. 16 proposed a correlation in equation (10) to predict the value of maximum ceiling temperature rise without a smoke extraction system

In fact, ventilation velocity prevents smoke propagation. It is important to understand the effect of ventilation on the maximum temperature below the tunnel ceiling. In this article, the ventilation velocity is related to the maximum temperature. The main innovation is that the HRR of fire source in tunnel is greater than previous studies. The fire source heat release exceeds 30 MW in the full-scale tunnel. The model tunnel ceiling temperatures are measured by the thermocouples in the experiments. When the ventilation velocity and the HRR change, the temperature below the tunnel ceiling changes immediately. Combined with the advantages of equation (4) proposed by Kurioka, the maximum ceiling temperature is related to the dimensionless HRR and the Froude number. In order to correct the Kurioka model, it is recommended to use equation (11) to estimate the maximum temperature

where a is the equation coefficient and b is a parameter. The coefficients a and b are calculated by a series of reduced-scale tunnel experiments by varying the HRR and ventilation velocity in a later section.
Reduced-scale experimental tests
Based on the first theorem of similarity theory, the similarity criteria of the same name are equal. However, it is difficult to satisfy all similarity criteria in the process of model design. Therefore, in the process of model design, to grasp the force that plays a decisive role in the flow process, the prototype and the corresponding criterion number of the force in the model should be kept equal. The Froude model is the most important one in the similarity criteria in utility tunnel fire study. In this study, Reynolds number is located in the resistance square region, which has little influence on the flow. Based on this, the similarity can be realized if the Froude numbers of prototype and model are equal. The physical model is built with the Froude model. The dimensional relationship between fluid dynamic variables is derived from the first principle by Morgan et al.
25
proposed. In order to keep the Froude number constant, the relationship is simplified to obtain the desired proportionality law. The HRR,


where
The experiments are done in a reduced-scale tunnel, as shown in Figure 1. The full-scale tunnel is 12.0 m wide, 5.9 m high, and 138 m long. In the experimental tests, the ratio is 1:6. The reduced-scale tunnel is 2 m wide, 0.98 m tall, and 23 m long. The reduced-scale tunnel is made of 1-mm-thick stainless steel plate. The fuel is liquefied petroleum gas (LPG). The fire source used in the experiment is made up of four iron sheets, with a single size of 0.4 m×0.4 m×0.4 m (length×width× height). The fire source is placed at 7.5 m distance from inlet side. The HRRs are 227, 340, and 567 kW, and their corresponding values in the real tunnel are 20, 30, and 50 MW, respectively. Due to the heat exchange between smoke and ceiling, the maximum smoke temperature in the vertical direction should not exceed 50 °C below the tunnel ceiling. In Alpert, 23 maximum smoke temperature below the tunnel ceiling appeared in the experiment tests at the position of 0.2 m. In order to obtain an accurate maximum smoke temperature, the position of the maximum smoke temperature is measured vertically in a test tunnel under a ceiling of 0.03 m.

Schematic of the experimental tunnel model and fire experiment.
In the experiments, 14 thermocouples (K-type) are placed under the tunnel ceiling near the longitudinal centerline, as shown in Figure 2. The distances between the thermocouples and the ceiling are 0.5, 1.0, 1.5, 2.0, 2.0, 2.5, 3.0, and 3.0 m respectively. The distance between the thermocouples near the fire source is 0.5 m. And, the distance between the thermocouples away from the fire source is 3.0 m. The fire source is located 7.5 m from the inlet side of airflow. There are five sets of thermocouples upstream of the fire source. There are eight sets of thermocouples downstream of the fire source. There is one set directly above the fire source. The number of thermocouples in each set is five and the spacing is 0.2 m. The uncertainty of temperature measurement was mainly attributed to the radiation error of thermocouple and the error related to the measurement repeatability. Therefore, the repeatability error of measured temperatures was found to be less than 5%.

Thermocouple arrangement: (a) longitudinal direction and (b) vertical direction.
In the reduced-scale tunnel experiment, the critical ventilation velocity should be selected as 0.4–2.0 m/s. The critical ventilation velocity is chosen from Kurioka et al.’s 7 experiments. The longitudinal ventilation velocity is set as the ventilation velocity below the critical ventilation velocity, equal to the critical ventilation velocity, and higher than the ventilation velocity. Combined with the velocity value in the ventilation experiment, a variable frequency fan with a maximum air volume of 30,000 m3/h is selected in the experiment. The ambient temperature is 20°C. The experimental cases are summarized in Table 1. Ventilation velocities are set as three cases, which were below the critical ventilation velocity, equal to critical ventilation velocity, and higher than critical ventilation velocity under each HRR. The fuel flow rate is measured by the rotor flowmeter with 1% accuracy. The ventilation velocity is measured with a 1% precision vortex anemometer. Considering the most unfavorable factors, the combustible cartons are set as pilot. At the downstream of fire source, combustible cartons are placed.
Experimental test conditions.
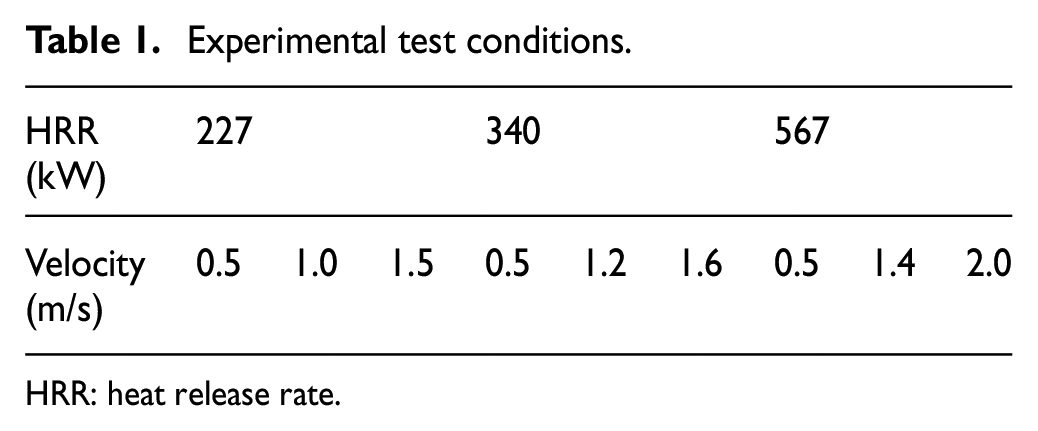
HRR: heat release rate.
The object in the vicinity of the fire source in the tunnel comprises two parts: flame radiation and smoke radiation. In this study, the flame radiation is the large part, and the proportion of the flue gas radiation is small, so the part of the flue gas quasi-radiant heat is not taken into account in the experiment. The reason is that when the distance from the fire source is 1 m, the radiation heat is close to 1.4 MW for the HRR is 50 MW in the full-scale tunnel. When the distance from the fire source is 1 m, the radiation heat is nearly 0.55 MW for the HRR is 20 MW in the full-scale tunnel. With the increase in the distance from the fire source, the radiation heat decreases gradually. When the distance from the fire source is 4 m, the radiation heat is less than 0.1 MW in the full-scale tunnel for the HRR is 20, 30, and 50 MW, respectively. When the distance from the fire source is 8 m, the radiation heat is close to 0 MW in the full-scale tunnel for the HRR is 20, 30, and 50 MW, respectively. Therefore, the radiation heat is neglected in this study.
Numerical experiments
The numerical simulations are carried out by Fire Dynamics Simulator (FDS 6.0) software. FDS has been used in many previous tunnel fire studies.9,11,15 The size of numerical model, the location of fire source, the characteristics of fire source, and the setup of the environment parameters are consistent with the experimental tests, and the location of test points is the same as that of the experiments. The fire source is placed in the centerline of the tunnel. The fuel is heptane. The fire is set up as vent in FDS. The HRRs are 227, 340, and 567 kW, respectively. The fire source location is 7.5 m far away from the airflow inlet side. The combustible materials are placed at 7 m distance from fire source. The ventilation velocity is set different value corresponding to the numerical cases, as shown in Table 1. The outlet of tunnel is “OPEN.” The air temperature is 20°C. The large eddy simulation (LES) model, which is widely used in study of fire-induced smoke flow behavior, is used in this study. The tunnel wall was selected as “STEEL” blockages. The numerical simulation domain is divided into 0.5 m × 0.25 m × 0.25 m grids along the length, width, and height directions, respectively. In order to verify the feasibility of the existing grid size, grid-independent calculations are performed using three continuous grids. The coarse mesh grid is 1 m × 0.25 m × 0.25 m along the length, width, and height directions, respectively. The medium mesh grid is 0.5 m × 0.25 m × 0.25 m along the length, width, and height directions, respectively. The fine mesh grid is 0.25 m × 0.25 m × 0.25 m along the length, width, and height directions, respectively. Taking 227 kW, V = 0.5 m/s, and t = 200 s as examples, the difference of ceiling temperature under different mesh sizes is analyzed. Figure 3 presents the longitudinal temperature distribution below the tunnel ceiling along the longitudinal direction. It is obvious that the size of the medium grid mesh is reasonable.

Temperature along the longitudinal ceiling for three mesh sizes.
Results and discussion
This part of article is organized as follows. The next section describes the results of reduced-scale experimental data for the longitudinal temperature distribution. Then, in section “Maximum ceiling temperature,” it presents the maximum ceiling temperature in the experimental data results. And, reduced-scale experimental results are compared with previous studies. Finally, the experimental results are compared with the small-scale numerical simulation results of the same tunnel.
Longitudinal temperature distribution
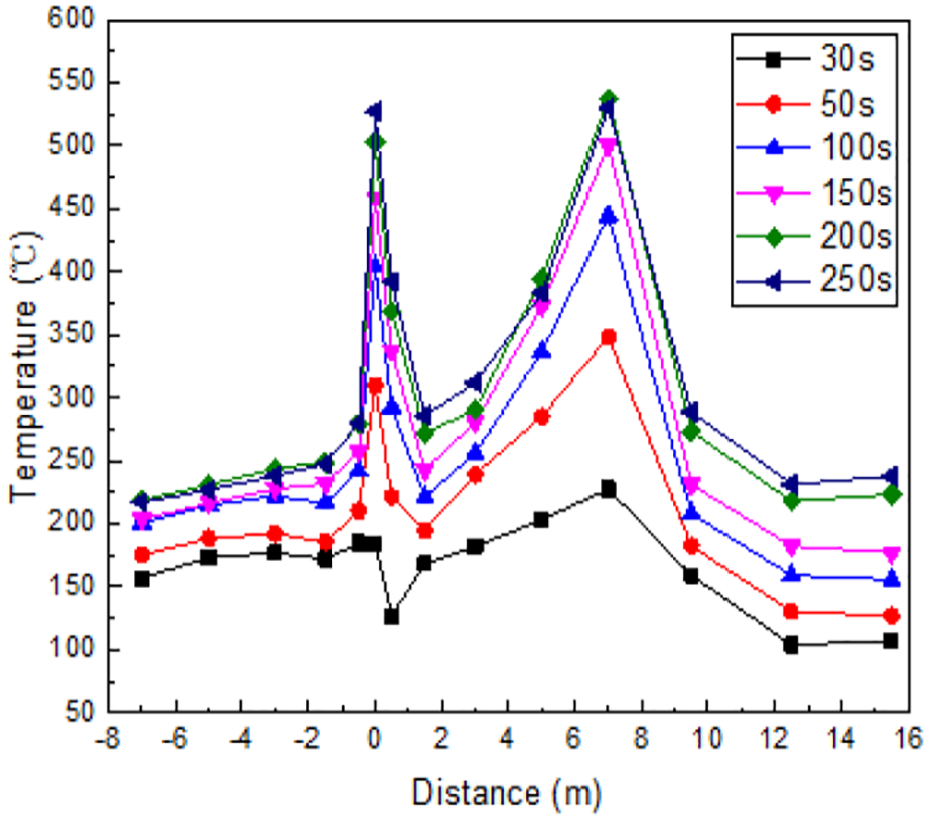
As the ventilation velocity increases, the tunnel ceiling temperature decreases. The ceiling temperature increases with the increase in the HRR. In the upstream of fire source, the maximum temperature below the tunnel ceiling rises gradually as the distance from the fire source decreases. In the downstream of fire source, as the distance from location of the fire increases, the maximum temperature below tunnel ceiling increases first, then decreases, and finally remains unchanged. When the HRR is 227 kW, the longitudinal temperature distribution is shown in Figures 4–6 for conditions with the airflow velocity of 0.5, 1.0, and 1.5 m/s, respectively. As time goes from 30 to 250 s, the ceiling temperature gradually rises.

Ceiling maximum temperature in 227 kW and wind velocity 0.5 m/s.
Ceiling maximum temperature in 227 kW and wind velocity 1.0 m/s.

Ceiling maximum temperature in 227 kW and wind velocity 1.5 m/s.
As shown in Figure 4, the ceiling temperature is 561°C at a position of 0.5 m from the fire source. The ceiling temperature gradually decreases, from 0.5 to 3.0 m from the fire source. At 200 s, the temperature at 3.0 m downstream of the fire is 264°C. The temperature below tunnel ceiling increases gradually from 3.0 to 7.0 m downstream of the fire. When the distance is 7.0 m from the fire source, the maximum temperature of the ceiling is 482°C. Then, as the distance from the fire source increases, the ceiling temperature gradually decreases. It is concluded that, in Figure 5, the maximum ceiling temperature is 561°C at 0.5 m downstream of the fire source. As shown in Figure 6, the maximum temperature is 384°C at 7.0 m downstream of fire source. The reason is that the combustibles are ignited, causing the temperature to rise. The maximum ceiling temperature is below 50°C at the end of tunnel (10–16 m), even in the 250 s experimental period. The reason is that the combustibles have been burned out.
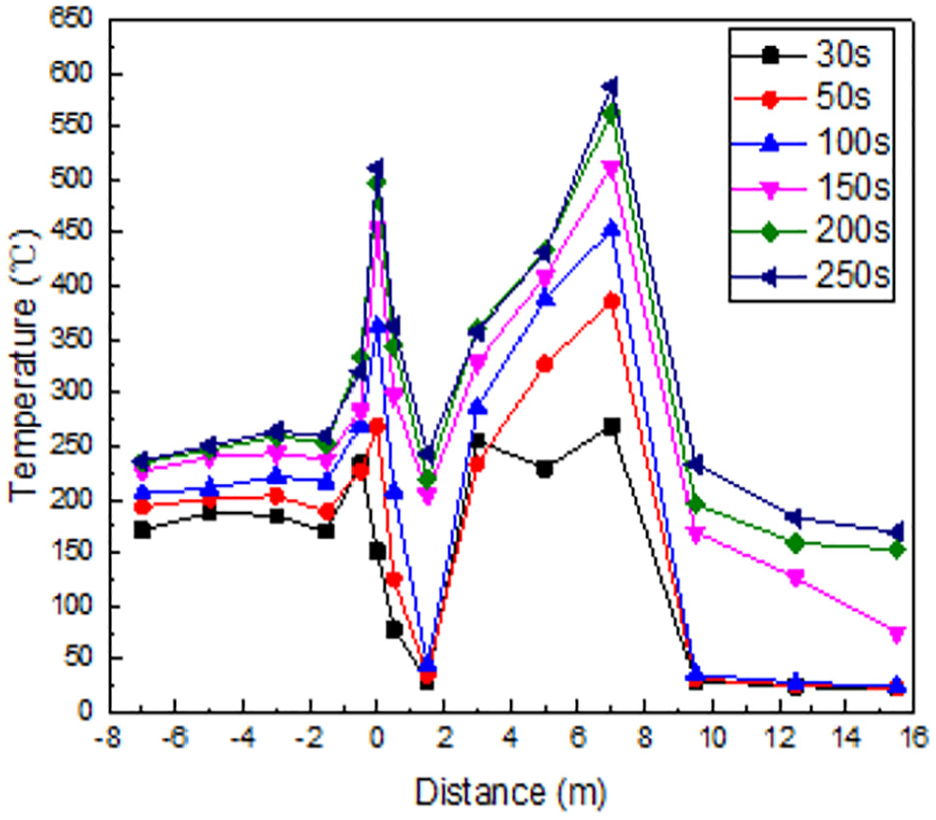
When the HRR is 340 kW, the longitudinal temperature distributions corresponding to the ventilation velocity of 0.5, 1.2, and 1.6 m/s are as shown in Figures 7–9, respectively. It is noticed that in Figure 7, the maximum temperature field under tunnel ceiling almost symmetrically distributed on both sides of fire source. When the ventilation velocity is 0.5 m/s, there is little effect on the ceiling temperature. When the burning time is 30 s, the maximum ceiling temperature at 15.5 m from the fire source location is 178°C. Then, it remains basically the same. There is no temperature peak at 7 m from the fire source in Figure 7. Figures 4 and 10 have peaks of the same distance and the same ventilation velocity. The reason is that when the ventilation velocity is low, the combustibles have not been ignited.

Ceiling maximum temperature in 340 kW and wind velocity 0.5 m/s.
Ceiling maximum temperature in 340 kW and wind velocity 1.2 m/s.

Ceiling maximum temperature in 340 kW and wind velocity 1.6 m/s.

Ceiling maximum temperature in 567 kW and wind velocity 0.5 m/s.
As shown in Figure 8, the maximum tunnel ceiling temperature is 498°C above the fire source. At 1.5 m position downstream of the fire source, the tunnel ceiling temperature is the lowest, which is only 204°C, when the burning time is 150 s. The tunnel ceiling temperature at 7.0 m from the fire source location is 587°C. The temperature maintains at 169°C, 15.5 m from fire source.
As shown in Figure 9, it burns from 30 to 250 s, and the upstream temperature of the fire source rises from 139°C to 239°C. The maximum temperature is 471°C above the fire source. However, the temperature below the tunnel ceiling is 516°C, when the distance from the fire source is 7 m.
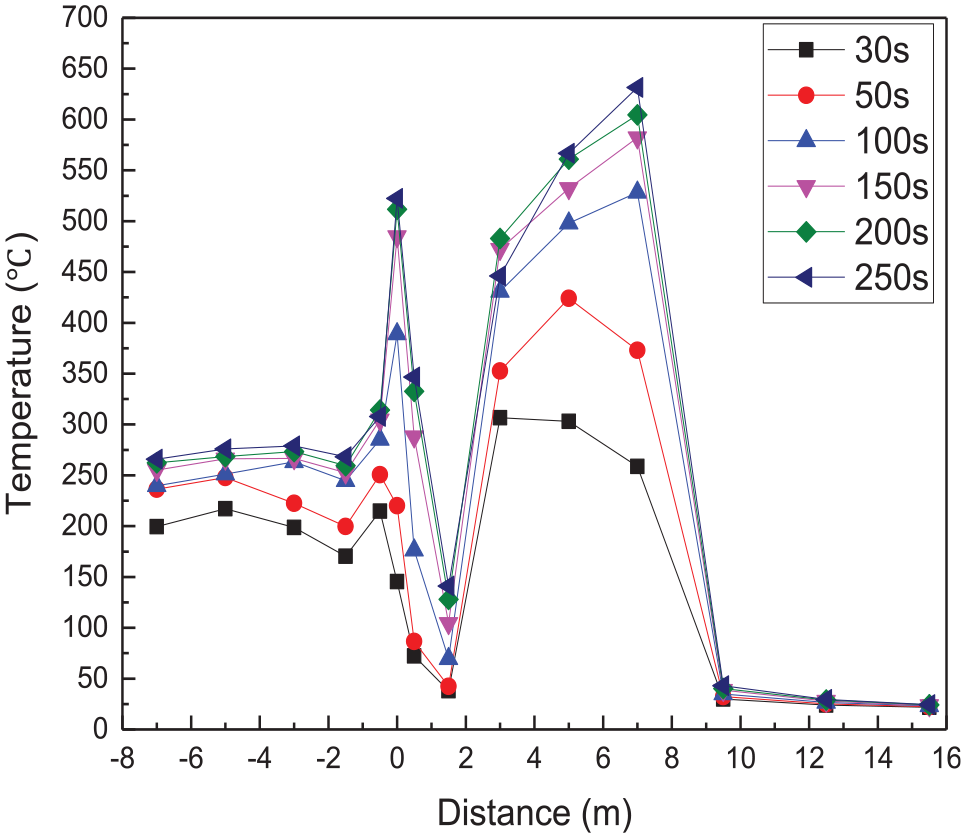
When the HRR is 567 kW, the longitudinal temperature distributions corresponding to the ventilation velocity of 0.5, 1.4, and 2.0 m/s are shown in Figures 10–12, respectively. As shown in Figure 10, when the ventilation velocity is 0.5 m/s, it had a certain influence on the tunnel ceiling temperature. The maximum temperature is 601°C above the fire source. At a distance of 7.0 m from the fire source, the maximum temperature is 773°C. When the burning time is 250 s, the maximum temperature is 247°C at 15.5 m from the fire source. Then, it basically keeps the same trend.

Ceiling maximum temperature in 567 kW and wind velocity 1.4 m/s.
Ceiling maximum temperature in 567 kW and wind velocity 2.0 m/s.
As shown in Figure 11, the maximum temperature below tunnel ceiling above the fire source is 541°C. At 1.5 m downstream of the fire source, the tunnel ceiling temperature is only 262°C, when the burning time is 250 s. The tunnel ceiling temperature is 683°C at 7.0 m from the fire source. The final temperature is maintained at 164°C at the end of the time, 15.5 m from the fire source. It is noticed that in Figure 12, when the burning time from 30 to 250 s, the upstream temperature of the fire source rises from 170°C to 268°C. The maximum temperature is 522°C above the fire source. However, when the distance from the fire source is 7 m, the temperature under the tunnel ceiling is 631°C. The main reason is that the combustibles are ignited, and the heat released causes the temperature to rise 7 m away from the fire source.
Maximum ceiling temperature
The temperature distribution is shown in Figure 13, and different HRRs have a significant effect on the maximum ceiling temperature at different ventilation velocities. When the HRR is 277, 340, and 567 kW, respectively, the critical velocity varies with experimental conditions. The maximum ceiling temperature distribution is shown in Figure 13, along the longitudinal tunnel model. When the HRR is 567 kW and the velocity is 0.5 m/s, the maximum ceiling temperature at 7.0 m from the fire source is 385°C. The maximum ceiling temperature decreases as the ventilation velocity increases. The reason is that the longitudinal ventilation takes away some of the heat in the tunnel. The maximum ceiling temperature increases as the HRR increases. In practice, the ventilation velocity affects the maximum temperature. Longitudinal ventilation has a significant effect on the tunnel ceiling temperature and cannot be ignored. In addition, experimental data show that it remains unchanged in the highest temperature position under the ceiling. Therefore, the maximum temperature varies with distance from the fire source.

Ceiling maximum temperature in downstream of fire source in wind velocity.
Model validation
Experimental data were compared with previous studies by Ingason and Li, 6 Alpert, 23 Heskestad and Hamada, 26 Li and Ingason, 14 Chen et al., 24 and Tang et al. 16 In this case, the situation of other researchers is not accurate. Figures 14 and 15 give a comparison of the maximum temperatures under the ceiling. As shown in Figure 14, each of the highest ceiling temperatures corresponds to the maximum measured in the test. When HRR is 227, 340, and 567 kW, the experimental test data are compared with the formula studied by prediction models in previous studies. The maximum temperature cannot be well predicted by these models. The reason is that these previous proposed maximum temperature did not take the ignition materials near the fire source into account. However, the ignition materials are an important factor for predicting temperature distribution in tunnel fire.

Experimental value compare with other studies.

Kurioka model and experimental value of ceiling maximum temperature in ventilation velocity.
Ventilation velocity has an effect on the maximum temperature below the tunnel ceiling. The main innovation is that the ignition materials are placed near the fire source. The reduced-scale tunnel ceiling temperatures are measured by the thermocouples in the experiments. Combined with the advantages of equation (4) proposed by Kurioka, the maximum ceiling temperature is related to the dimensionless ventilation velocity. In order to modify the Kurioka model, it is necessary to use equation (4) to compare the maximum temperature distribution between the Kurioka model and experimental value under longitudinal ventilation velocity in tunnel. It is noticed that in Figure 15, the experimental data correlated well with the Kurioka model, regardless of the HRR of 227, 340, and 567 kW. As shown in Figure 15, when the HRR is 227 kW and the ventilation velocity is 0.5 m/s, temperature difference between the experimental data and the Kurioka model is 29°C. When the HRR is 340 kW and the ventilation velocity is 0.5 m/s, the temperature difference between the current experimental data and the Kurioka model is 42°C. When the HRR is 567 kW and the ventilation velocity is 1.4 m/s, temperature difference is 37°C. The reason is that with the increase in the longitudinal ventilation velocity, more heat is taken away from the tunnel, thus reducing the tunnel ceiling temperature. In addition, with the increase in the HRR, the heat accumulation in the tunnel increases, and the tunnel ceiling temperature increases. Figure 15 clearly shows that the test values for the maximum temperature below the tunnel ceiling with the Kurioka model test and other previous models are well correlated with the test data for the proportional tunnel.
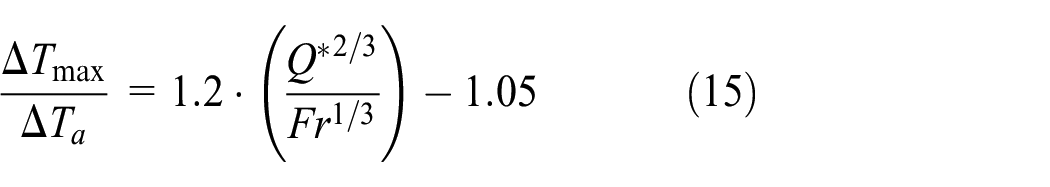
Figure 16 compares equation (11) with the reduced ratio of experimental data from the present study. The experimental data of the maximum temperature under the ceiling have a good correlation with equation (15). The coefficients a and b from equation (9) are determined by fitting to experimental values. The temperature simulation results of small-scale tunnel are consistent with those of full-scale tunnel. Equation (15) applies only to the HRR of fire sources between 20 and 50 MW, with longitudinal ventilation velocity less than 2 m/s. It is used for predicting temperature distribution taking that the combustible materials are ignited near the fire source into account in tunnel

Temperature distribution prediction model.
Comparison with numerical simulation
When the ventilation velocity is 0.5 m/s, experimental test is compared with the numerical simulation experimental value, as shown in Figure 17. In the test and simulation, when the HRRs are 227, 340, and 567 kW, the overall trend of the maximum temperature below the tunnel ceiling was consistent. When the HRR is 567 kW, the maximum ceiling temperature exceeds 850°C. The experimental data are lower than the simulation results. The reason is that there are many factors that affect the experimental data during the experiment. During the test, there is no guarantee that the tunnel wall conditions are completely adiabatic. The heat loss to the surrounding environment by a 1-mm-thick tunnel steel plate is not considered. The error between the experimental value and the analog value is within an acceptable range. Experimental results verify the correctness of the numerical simulation. Therefore, the maximum temperature distribution below the tunnel ceiling can be calculated by numerical simulation.

Comparison between experimental and numerical simulation value.
Conclusion
This article investigated the ventilation velocity effects on maximum ceiling temperature combustible materials around ignition source in tunnel fires. Several fire experimental tests are conducted with longitudinal ventilation velocity changes in a small-scale tunnel (23 m in length, 2 m in width, and 0.98 m in height), where three heat release fires are 237, 340, and 567 kW. A new correlation for predicting temperature distribution takes the ignition materials near the fire source into account in tunnel. The main conclusions are as follows:
The results of the tests presented in this article show that when the ventilation velocity increases, the tunnel ceiling temperature decreases. And, when the HRR increases, the tunnel ceiling temperature increases. On one hand, when the ventilation velocity is 0.5 m/s and the HRRs are 227, 340, and 567 kW, the maximum ceiling temperatures are, respectively, 561°C, 700°C, and 773°C. On the other hand, when the ventilation velocity is 2.0 m/s and the HRRs are 227, 340, and 567 kW, the maximum ceiling temperatures are, respectively, 482°C, 516°C, and 541°C.
The correlations determining the maximum temperature and temperature decay beneath the tunnel ceiling are proposed to modify the current model taking the ignition materials near the fire source into account. The predictions agree well with the experimental and measured data by the modified equations of this article. Moreover, the small-scale numerical simulation appears to agree well with the experimental test, where the difference between the experimental values and the simulated values is not more than 10%.
The major findings of this study are that the experimental values from this study are different from the temperature differences presented by Kurioka et al. 7 The experiments and simulations are conducted in reduced-scale tunnel, and full-scale tunnel fire experiments may be unsuitable for different geometries and HRRs. Hence, more full-scale tunnel experiments will be conducted in the future.
Footnotes
Handling Editor: James Baldwin
Declaration of conflicting interests
The author(s) declared no potential conflicts of interest with respect to the research, authorship, and/or publication of this article.
Funding
The author(s) disclosed receipt of the following financial support for the research, authorship, and/or publication of this article: The authors wish to acknowledge the financial support from the Beijing Natural Science Foundation under Grant No. 8172006 and Beijing municipal education commission under Grant No. 04000546618016.