
Abstract
The aim of the article is to analyze the properties of artificial muscle system and effectiveness evaluation of the application of pulse width modulation in terms of improving the dynamic properties. In terms of dynamic properties, pneumatic artificial muscles represent a very complicated nonlinear structure. For this reason, the design of a robust positioning control system for pneumatic artificial muscle devices is demanding because, apart from the above-mentioned nonlinearity (because of air compressibility, air flow variability through valves, etc.), this is a time-and-parameter invariant system. The aim of the article is to evaluate the influence of pulse width modulation in pneumatic artificial muscle systems with regard to the accuracy and stability of the position achieved in the repeat mode, as well as the elimination of the adverse effect of the oscillation. The efficiency of the proposed control algorithm is demonstrated by experiments with external workload and no load.
Keywords
Introduction
Pneumatic artificial muscle (PAM) is a special type of actuator that converts the energy of compressed air inside the muscle into mechanical energy in the form of contractions. PAMs belong to modern and dynamically developing segments in the field of drive systems of production machinery and equipment. 1 Recently, thanks to modern control systems, the research focus of PAMs shifts to the application area. Their main advantage is the ability to mimic muscular functions, and hence there is the perspective of their use. 2 They are especially applicable where electric and hydraulic drives fail because of their excessive weight, stiffness, or volume at low power capacity. For these reasons, PAMs are finding increasing use in many industrial applications such as robotics, robotic hands, and other types of applications such as medicine in biomimetic devices mimicking skeletal muscles.1,3–6 PAMs are characterized by a high power-to-weight ratio and sufficient stability of elasticity. 1 For wide use of these actuators in the manipulator-like applications, precise positioning control is required. 7 However, the modeling and design of a precise, stable, and robust positioning control system for PAM applications is challenging because it is a highly nonlinear, time-varying control system due to air compressibility, air flow through valves, time scatter problem, flexibility, high hysteresis, and so on.1,8,9 The properties of hysteresis can cause significant inaccuracies in positioning, as well as oscillations of the reactions of the system as a whole. 6 To overcome these drawbacks, a number of newer pneumatic actuators have been developed, for example, McKibben’s muscle,5,10 braided, 11 and rubber actuator. 12 According to Anh and Ahn, 7 Schreiber et al., 13 Kopecny and Solc, 14 and Reynolds et al., 15 problems with muscular position control persist due to impaired performance caused by transient phenomenon of the external load changes, which means that load changes have a significant effect on position control. For this reason, it is not easy to perform high-precision motion during variable external load. As shown in Xei et al., 3 to achieve accurate control of the PAM trajectory, currently two basic approaches are used, that is, advanced nonlinear control algorithms based on hysteresis compensation models and simplified models using reverse linearization methods.3,5,13 Majority of traditional control methods are based on mathematical and statistical procedures for system modeling and estimation of optimal controller parameters. In practice, the manipulator to be controlled is often significantly nonlinear, and therefore it may be difficult to derive a mathematical model. As a result, conventional techniques will not be able to handle modeling errors and they would suffer from a lack of precision and robustness.2,7,9 According to Pipan and Harakovic, 16 an alternative to pneumatic systems control, mainly to eliminate response time, is implementing fast position control valves in conjunction with pulse width modulation (PWM).
The purpose of the article is to verify PAM application in antagonistic arrangement in control of the arm with a load by implementing PWM. The force applied to the PAM axis at workload is above 1300 N. However, the results of studies and experiments evaluating PAM applied forces of 60 N, 5 100 N, 10 and 500 N1,3,5,17 are mainly interested in single muscle hysteresis. The aim of this article is to achieve desired positions and pressures under significant axial load of PAMs. The listed results of the pressure and position control show the effectiveness of the proposed solution verified by the series of experiments.
Materials and methods
In order to verify the proposed PWM control system, the system was verified on a test actuator in an antagonistic arrangement. The control program algorithm consists of function blocks which create a control environment. The two-state (on/off) valve control requirement is replaced by a software calculation for a linear range of 0–1 that is modified by a PWM hardware modular control card to a linear range of 0%–100%. The proposed PWM function helps to eliminate inaccuracies that present a problem in the control of two-state action members. In this article, the application of PWM control is focused on pressure and position control.
Static characteristics of artificial muscles
Pneumatic muscle (Figure 1) converts pneumatic energy into mechanical energy. 5 Medium pressure on the inner layer of the membrane causes muscle contraction. 4 Input work of gas Win acting on the wall of a muscle can be calculated by the following formula 18

where P is the absolute gas pressure inside the muscle, P0 is the ambient gas pressure (1 atm), P′ is the relative pressure (P – P0), Si is the total internal muscle surface, dsi is the area vector, dli is the change of the inner surface, and dV is the volume change.

Determination of coefficients n and b. 18
Output muscle work Wout performed when muscle is shortened

where F is the axial tensile force of the muscle and dL is the axial displacement.
From the perspective of the law of conservation of energy, by neglecting system losses, the output is equal to the input, that is

After inserting into equations (1) and (2) and adjusting, we get

For an estimate of dV/dL, consider the active part of the muscle in the shape of an ideal cylinder, where L is the cylinder height, θ is the angle between the braid threads and the cylinder axis, D is the cylinder diameter, n is the number of threads wrapped around the cylinder, b is the fiber length, and V is the cylinder volume. L and D can be expressed as a function of θ with the constant parameters n and b
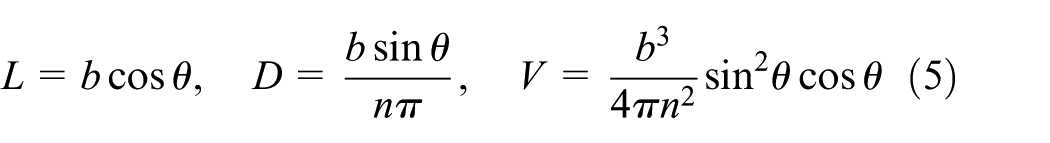
The final formula for the force developed by the muscle as a function P′ and θ will be11,18

The pulling force is therefore directly proportional to the pressure of the medium within the muscle and is a monotonic function of the fiber angle. The theoretical maximum muscle contraction is at zero force and maximum volume is for θ = 54°4′, corresponding to a relative shortening of approximately 38%. 11
Taking into account the thickness of the wall (tk)

Experiment setup
The experimental plan deals with the control of artificial muscles when applying PWM with application of the NI cRIO-9024 controller. Experimental measurements were carried out on a test actuator by performing a series of measurements for the control of selected parameters according to Table 1.
Methodology of experimental measurements.
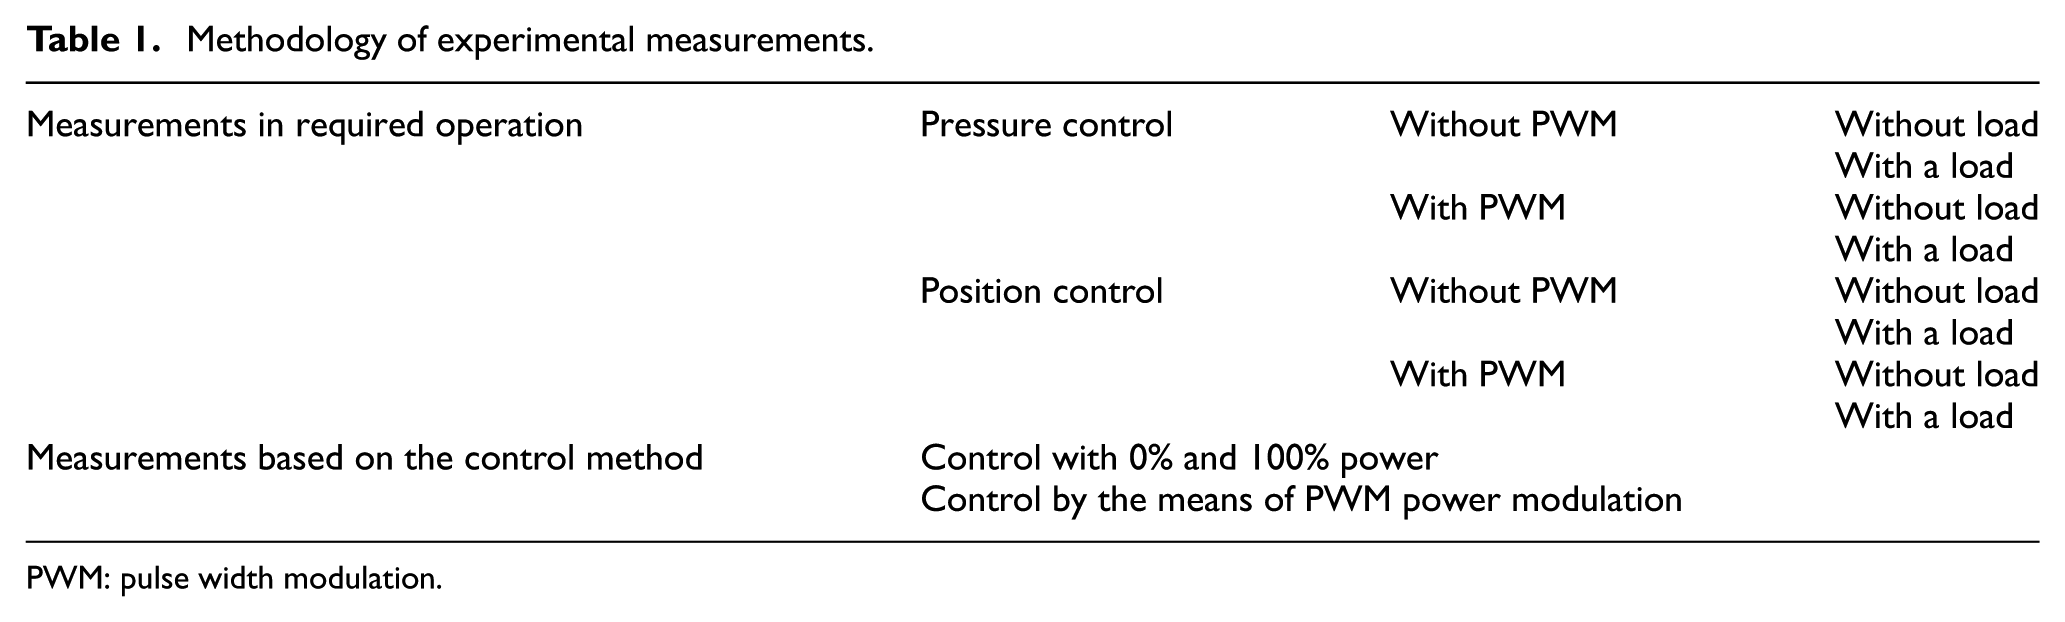
PWM: pulse width modulation.
The settings of the individual tolerances are defined in the control program for pressure of 0.05 bar, based on the control options of the applied pneumatic valves. For the position, tolerance of ±1° (angle) was set. The initiation pressure for both muscles was set to 2 bar with a tolerance of ±0.05 bar. Consequently, on one muscle, a constant pressure on the initialization value was maintained (muscle used as a constant pressure pneumatic spring), and the pressure on the other muscle was changed with an increment of +1 bar. Then, the experiment was performed again in altered order of muscles while maintaining the conditions. For pressure control measurements, the position represents the dependent variable. Table 2 lists the initial conditions for each measurement to be made and provides options for selecting the control method (see Figure 2).
Initial conditions and altered parameters for experiments.

PWM: pulse width modulation.
The force calculated to the axis of the tangent to the chain (see Figure 2).

Course of recalculated force to the chain tangent in dependence on the angle of arm rotation (with and without additional load).
Experimental details
To perform the experiments, a device with PAMs was selected in the antagonistic arrangement (Figures 3 and 4). PAMs are firmly connected to the steel base at the bottom. At the top, they are interconnected by a chain through a toothed wheel that is firmly connected to the shaft. A working arm of the assembly is attached to the shaft, on which the weights are placed, allowing for an optional change of the working torque. The assembly is complemented by a controlling hardware and computer system. The control is programmed in LabVIEW, and its computing hardware base has been compiled from the CompactRIO. In the experimental set, single-acting, tensile PAMs FESTO MAS-40-1000 N-AA-MC-K with screwed joints are used. The internal diameter of the PAM is 40 mm, the nominal length is 1000 mm, the operating pressure ranges from 0 to 6 bar, the maximum spindle is ≤3% of the nominal length, and the maximum hysteresis is ≤2.5% of the nominal length.
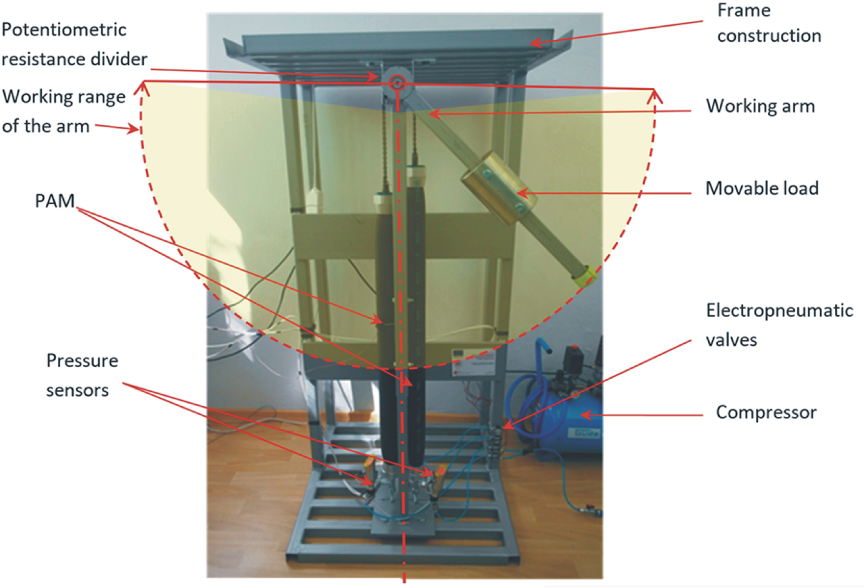
Device with PAMs in an antagonistic arrangement.

Schematic presentation with the NI cRIO-9024 arrangement.
Compressed air is used as the working medium. The compressed air supply for PAMs is from a non-oil compressor (AL210/8/24E) with an air reservoir. Pressure sensors with ceramic measuring elements are used for pressure measurement in a current loop with a range of 4–20 mA (PS 016V-504-LI2VPN8X H1141). For pressure control, electropneumatic valves with PWM capability (MATRIX P/N MX821.104224) are used.
For angular rotation measurement, a potentiometric resistance divider with a linear characteristic, with a working range of 0–10 kΩ, and a maximum rotation angle of 270° ± 5°, mounted on the shaft, was selected. A measurement limitation of less than 270° is acceptable for the selected design system. Laboratory-controlled supply sources (DC Power Supply HY3005) were used for pressure, and position sensors, and for control of electropneumatic valves. The high-speed two-way digital I/O module (NI 9041) was used for the control of the electropneumatic valves. The interface of the NI 9401 control card with electropneumatic valves was designed to interface with the H/L 5 V TTL logic level. To connect the NI 9401 control card with electropneumatic valves, an interface was designed to detect the H/L 5 V TTL logic level. If the 5-V input of the interface is switched on, the 24-V circuit with the electropneumatic valve is switched on.
Sensors (pressure sensors, potentiometer) are connected to the NI 9291 sensing module and control elements, that is, electropneumatic valves to the NI 9401 control module. The sensing and control modules are parts of the hardware connection with the cRIO-9024 controller. During each measurement, the position of the arm, the artificial muscle pressure, and the operation of the electropneumatic valves are recorded. These parameters are recorded using the proposed program structures.
The characteristic for position measurement can be defined as follows

where Angleα is the resulting rotational position (angular °) and Rpot is the ohm value of the potentiometer resistance measured by the measurement card.
The resulting value is greater than ±100° after this calibration, which corresponds to the measured ohmic potentiometer value of 1.4–8.7 kΩ. For pressure measurements in the PAMs, calibrated pressure sensors with current output are used, where a current range of 4–20 mA is to be transferred to a pressure range of 0–16 bar.
To calibrate the left pressure sensor

To calibrate the right pressure sensor

Design of program structures
In the framework of the experiments, a control program was created, which was subsequently recorded directly into the memory of the cRIO bus, which has its own operating system and thus ensures the data processing in the specified time interval. Steps and variables can still be monitored on the PC using the proposed user-friendly program (Figure 5). Parameters of the applied PC set are as follows: HP Company, Intel Core i5-2500 processor, 3.3 GHz, 8GB RAM, graphics processor GeForce GT 545 3GB, 2TB SATA, and Windows 7 operating system. As a development tool for creating applications in all phases of the process, the LabVIEW (Laboratory Virtual Instruments Engineering Workbench) version 2013 software was applied. The software was supplemented by LabVIEW Real-Time Module. The module was used for the creation of the control program. This control program was subsequently recorded directly into internal memory of real-time unit NI cRIO-9024 with cRIO-9114 bus. As mentioned above, the control program no longer directly uses PC hardware resources, but real-time NI cRIO unit with its own real-time operating system. Processor frequency of the real-time unit is 800 MHz, 512MB DDR2 RAM, 4GB permanent memory, internal real-time clock with accuracy of 35 ppm at 25°C, and connection to PC through Dual Ethernet. The assembly of the hardware is shown in block diagram in Figure 6.
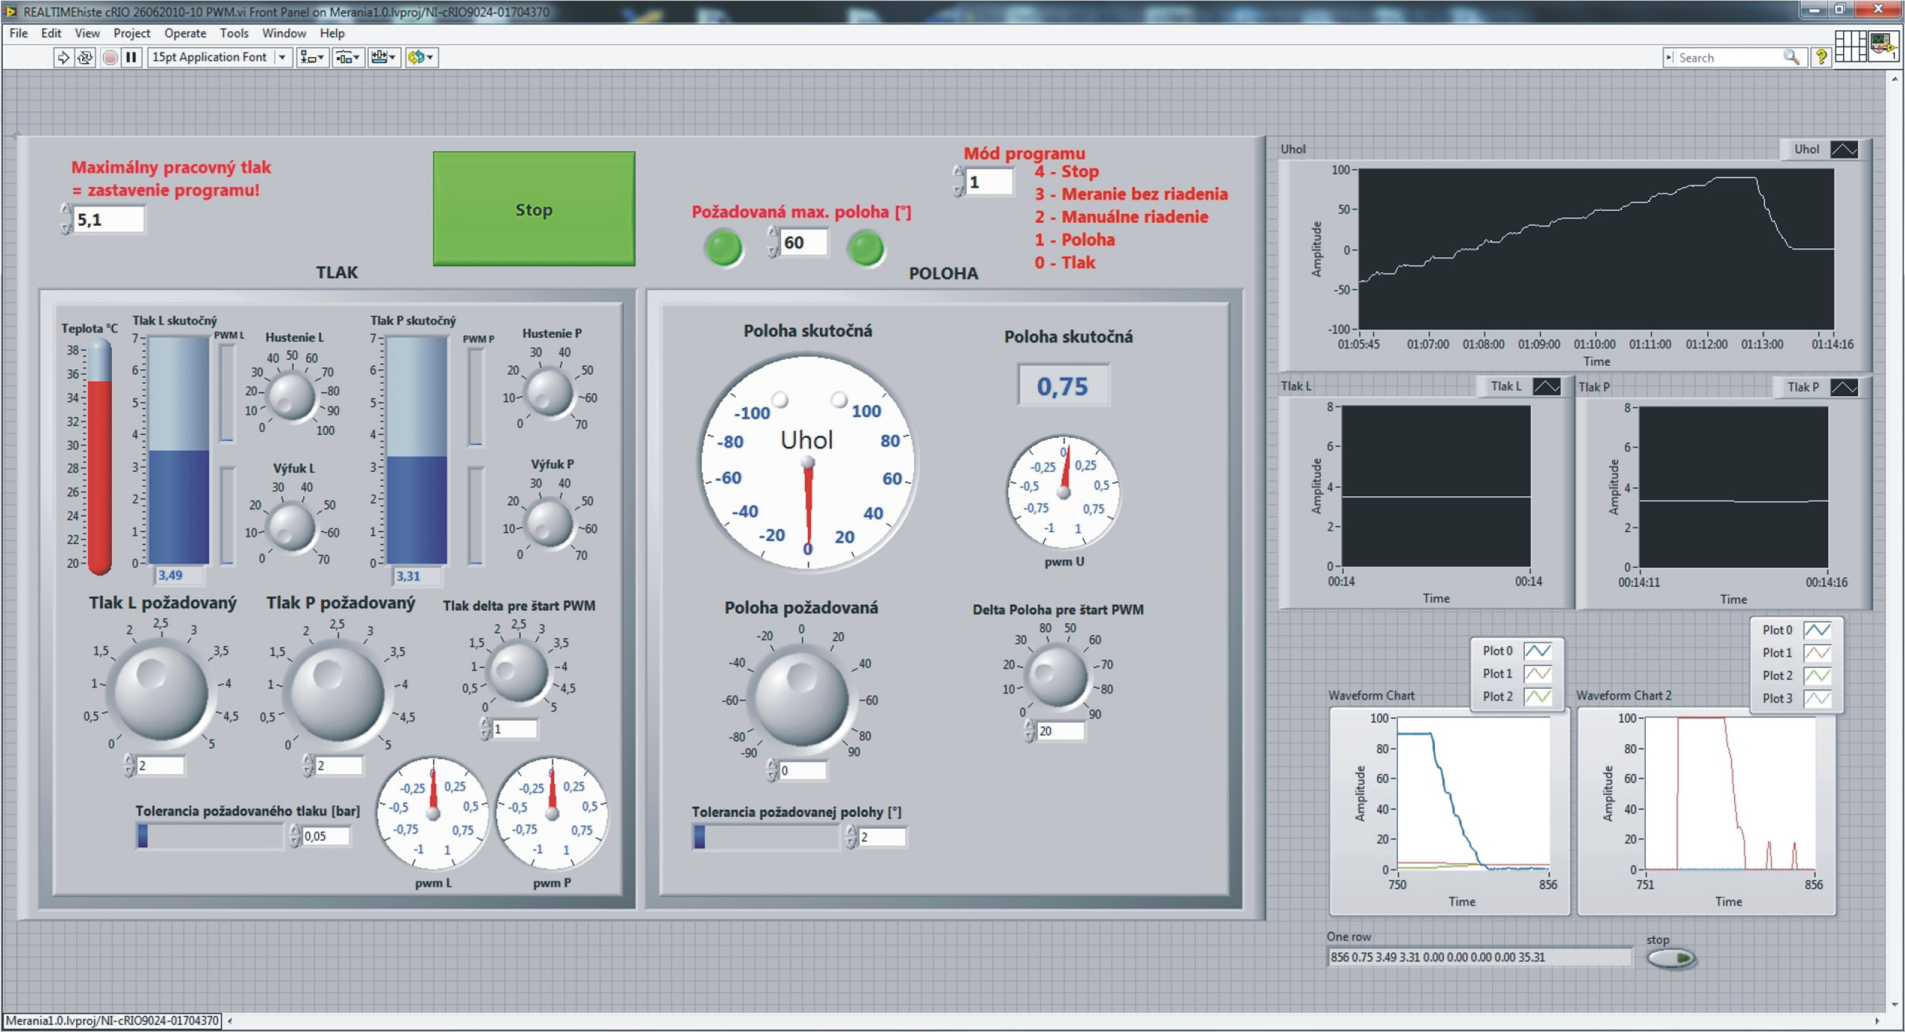
User interface panel.

Block diagram of the hardware assembly with NI cRIO-9024.
LabVIEW control uses 1 MHz clock as an internal time source which allows the time-program structure to make the iteration per microsecond.9,10 This makes it possible to maximize the data throughput of inputs and outputs for their rapid analysis and recording, which is not possible for classical applications. For data processing in the program, mathematical operators are used by the general calibration formula. The use of operators instead of the calibration function as seen in the classical program is due to another kind of data flow, which in this case is not time bound but is understood in each iterative cycle of the program as a constant. The processing and analysis of data are done in a classical manner, with data already separated. The analysis and data processing options in the program structure are essentially the same, but due to the possibility of faster access to the measured parameters, other definitions can be used for the calculation.
Output control is possible with PWM. PWM is a technique in which a series of digital pulses is used to control an analogue circuit.19,20 The length and frequency of these pulses determines the total power delivered to the circuit. The digital pulse sequence that makes up the PWM signal has a fixed frequency and changes the pulse width to change the average signal power. 19 The ratio of pulse width to the period is referred to as the working cycle of the signal. 21 PWM is a way to digitally encode the analogue signal level. Using high-resolution counters, the working cycle of the rectangular wave is modulated to encode the specific level of the analogue signal. The PWM signal is still a digital one because at a given time, the DC power supply is either fully on or fully off. The current is supplied to the analogue load through repeating series of pulses on and off. On-time is the time during which DC power is applied to the load and the off-time is the time during which the power is off. 20
Width impulse modulation regulates the power of the two-state power actuators. In a conventional PWM control program, a more complex algorithm for calculating the PWM value would have to be made, and it is also difficult to simulate its real course without using a suitable PWM pulse modulation generator. The program control card includes a built-in PWM feature.
The control card used for PWM supports the closest control values to 50–250 Hz, which corresponds to a switching time of 0.02–0.004 s. The used valves work up to 200 Hz, which means that the shortest opening and the valve closing time is 0.005 s. It follows that 250 Hz modulation (0.004 s) cannot be used, and 50 Hz modulation has been used eventually. Figure 7 shows the comparison of conventional control with PWM control. The course of power control is shown from 0% to 100 % using an electropneumatic valve.

Comparison of conventional control and PWM control.
The control area is limited to the start of the control (15%) and the end of the control (85%) for the actual operation of the valve, that is, the valve is closed up to 15% of the PWM, due to the insufficient pulse width to open the valve, and in the PWM control area, the valve is open above 85%. Thus, the 50-Hz PWM work zones below 12.5% and above 87.5% are unsuitable for control and will not be considered except for the values of 0% and 100%. At these values, pulses do not switch but are defined as a permanent state.
A TTL signal converter for switching 24 V electropneumatic valves is created to control actuators. Pressure control is performed by an algorithm that ensures the opening and closing of electropneumatic valves by comparing the actual and required pressures in individual PAMs, in the iteration of the main program. The determination of the position control algorithm serves to perform the regulating operations of opening and closing the electropneumatic valves. With the iteration, the control program will assess the state of the controlled system and decide on its further action.
Results
Pressure control without PWM: without load and with load
The analysis allows for the precise identification of the pressure course characteristics (Figure 8). When increasing the pressure in the left muscle (Figure 8(a-I)) to 3 bar, a relatively linear course can be observed at the leading edge of the left muscle pressure. This linear character is due to the throughput capacity of the left muscle intake pneumatic valve and the low resistant force of the right muscle. The relative linearity phenomenon can be observed in the left muscle only at low working pressure, when there is still a multiple difference in pressure on the left intake valve during pressure increase (between the muscle and the compressed air source) and there is also a low right muscle reaction force. During the consequent pressure increase in left muscle, there is a lower pressure difference in the left intake valve, at the same time the right muscle’s reaction force increases, which increases the stiffness of the entire mechanism, and the linearity of the process is lost. With decreasing angle of the leading edge of the left muscle pressure course, there is an increase in muscle filling, as seen at the upstream edge of the pressure increase to 5 bar. As follows from the courses, the muscle pressure remains at the desired value within the tolerance of 0.05 bar defined in the pressure control mode. Any out-of-tolerance pressure variation is offset by a short pressure pulse, that is, by increasing or decreasing the pressure in the muscles. The damping of vibrations is ensured by the rigidity of antagonistic arrangement. The impact of friction of the chain transmission stored in the bearings as the possible compensator has not been confirmed by the measurements. Decreasing edges of pressure course in the left muscle during discharge of compressed air have greater nonlinearity and longer time-span compared to pressure increase process, due to a smaller pressure differential on the left venting valve.

Measurement of pressure control without PWM: without load for (a) left muscle and (b) right muscle.
The diagram in Figure 8(a-II) shows the switching courses of the left muscle valves and Figure 8(a-III) of the right muscle valve. The left valve performance course exactly corresponds to the time of the leading edges of the left muscle filling and the short pulses for the pressure compensation in muscle. The left muscle drain valve, with its performance, copies the course of the decreasing edge of the left muscle pressure, and also, by narrow pulses, compensates for the left muscle pressure tolerance. The diagram of the performance of the right muscle filling and draining valves (Figure 8(a-III)) shows the course of compensation of constant pressure in right muscle. The constant pressure in right muscle is disturbed by the action of the left muscle and is therefore constantly compensated by the right muscle valves. More frequent compensation of the pressure of right muscle occurs at times when the left muscle is filling, less often the right muscle pressure is compensated when the left muscle is discharging; and at a time when the pressure is kept at a constant value, there is only a minimum amount of pulses that compensate for muscle flexibility and small air leaks.
Under the same conditions (increment of pressure change id 1 bar), Figure 8(b-I) shows that pressure curves in the right artificial muscle are similar to those measured in left muscle. Valve-opening processes, switching characteristic of the left muscle valve in Figure 8(b-II) and right muscle valve in Figure 8(b-III), are almost identical under the same control conditions. The arm position in this case is in III quadrant with a similar course as in the left muscle.
The leading edges of the course of left pressure (Figure 9(a-I)) have characteristic linear rise which is lost with an increase in working pressure to 4 and 5 bar. The courses in stabilized state (i.e. persistent pressure on the required value) show greater oscillation than the unloaded operation in Figure 8(a-I). These oscillations are present on both muscles. Pneumatic valve-switching operations shown in Figure 9(a-II) and (a-III) contain a greater number of control interventions than the non-load operation. This increase in activity is due to a higher load acting on the arm of the mechanism. During the position shown in Figure 9(a-IV), the interoperation of the pressure controls for the load applied to the arm of the mechanism is presented. In the parts of the position course, when the pressures are kept on the required value, there is a slight but frequent oscillation around the achieved position. The oscillation is caused by the flexibility of the artificial muscles device. With increasing left pressure, there is a tendency to less oscillation due to the increasing stiffness of the mechanism, but the effect of load force increasing with the angle of rotation acts opposite to the achieved stability and the oscillation of the mechanism persists, which confirms the theoretical knowledge of Sarosi et al., 1 Xie et al., 3 Lin et al., 6 Wickramatunge and Leephakpreeda, 8 and Thanh and Ahn 9 mentioned in the introductory part of the contribution.

Measurement of pressure control without PWM: with load for (a) left muscle and (b) right muscle.
Analogous measurement performed in the opposite order, that is, left muscle is set with constant pressure while maintaining conditions (Table 2), confirmed the measurements (Figure 9(a)). The courses of the individual measurements carried out on the right muscle in Figure 9(b) have the same characteristics as those shown in Figure 9(a). The position course in negative values represents movement in the third quadrant in terms of the arrangement of the mechanism. The shape of Figure 9(a-IV) and (b-IV) courses at 3 and 5 bar pressures is not only oscillating around the required value but also shows an increase in the change with time. This increase is also observed despite the regulatory interventions described above (the system is controlled to the pressure stabilization requirement). Interventions represent pulses in values open (100) or closed (0). As shown in the evaluation of air flow per pulse, the amount is characterized by an over-limit value which must be corrected (Figure 9(a-II) and (b-III)). These corrections significantly affect the increase in position change. Thus, it can be stated that in an effort to control the system to required pressure value, there is a significant change in the position of the actuator arm.
Pressure control with PWM: without load and with load
The analysis of the pressure course (Figure 10(a-I)) shows the concave shape of the leading edge. This is due to the PWM control that affects the pneumatic valve control process. At steady pressure, the course is clearly more stable for values 3, 4 and 5 bar due to fine adjustment by PWM. The pressure drops from the required values to 2 bar have a more convex shape than in the previous measurements, which again corresponds to the smoother control of the power range using PWM.

Measurement of pressure control with PWM: without load for (a) left muscle and (b) right muscle.
For better evaluation, the valve-switching processes are transformed into the linearized performance range of PWM according to Figure 7. For the leading edge of the PWM valve-switching control (Figure 10(a-II) and (a-III)), the vertical part of the flow is characteristic, it corresponds to the pressure change demand, and is generated at the time of the change setting of the pressure value in the program. The varying height of the leading edge of switching corresponds to the different pulse duration of the PWM and is given by the magnitude of the difference between the actual and the required pressure values and the proportional increase in that difference. The leading edge can be clearly seen at the request of a pressure increase (switching of the inlet valve) or when the pressure drop is required (switching of the drain valve). The decreasing edge of the course on the left side valve-switching diagram is directly proportional to the required filling or draining power depending on the size of the difference between the required and the actual values and on the proportional increase in that difference. Short pulses are located in a range where the software limits minimum duration of the pulses to avoid faulty opening of the valves, which could lead to their malfunction and destruction.
The positioning process (Figure 10(a-IV)) responds sensitively to pressure regulation and has a tendency to oscillate. This is most pronounced at the required pressure of 3 bar, where the position after stabilization oscillates at 20° from the zero position. In the range near zero position, significant abrupt distortions occur, which are caused by small damping reaction force from the right artificial muscle and by small force formed by the arm in an unloaded state.
The course of right muscle pressure regulation process shown in Figure 10(b-I) has the same characteristic of the course as in the previous experiment, with the valves on the right side switching to the desired right muscle pressure increase and constant pressure is maintained in the left muscle by the valves on the left side (Figure 10(b-II) and (b-III)). The valve performance patterns exactly match the PWM depending on the required pressures. The course of the position around the 0° sensitively follows changes in pressure. The more negative the arm’s position is achieved, the higher the stiffness of the mechanism, and thus the position is better stabilized. The stiffness of the system increases proportionally to the values of the pressures in the muscles.
No abrupt distortions are observed on the measured pressure courses (3, 4, and 5 bar) when the working arm is loaded (Figure 11(a-I)). Oscillation is observed on the right PAM, which in this case serves as a spring. It is possible to observe the more frequent activity of the control valves (Figure 11(a-II) and (a-III)), as seen from the power control course on the left side valves and the constant pressure compensation on the right side valves.

Measurement of pressure control with PWM: with load for (a) left muscle and (b) right muscle.
The change was recorded on the position course (Figure 11-IV), where a more uniform characteristic is seen without significant abrupt distortions. The courses in Figure 11(b) are similar to Figure 11(a), only the right side of the mechanism is regulated. The required pressure is regulated by the valves on the right side and the constant pressure is maintained by the valves on the left side. The course of the position is stabilized.
It follows that PWM application to the control process allows to effectively compensate oscillations while maintaining the required pressure value in all observed states. When simulating workloads of PAMs with PWM control, precise positioning at the required working pressures can be tracked. PWM interventions to valve control when re-calculated make roughly 26% of the conventional control mode.
Position control without PWM: without load and with load
It is clear from the pressure courses that under the initial conditions (when left and right pressures are equal to 2 bar), the device oscillates slightly (Figure 12(a-I)). The oscillation is caused by controlling the position of the arm to the desired position with a set tolerance of ±1°. The graphical dependence of the position is shown in Figure 12(a-IV). During position control process, the overshoots occur for two reasons: the valve output is too large and the flexibility of the load-free mechanism is also high. The oscillation will stabilize only when the working pressure is high enough, and thus the device stiffness to damp the vibration is sufficient. When setting the arm angle to the desired position, the filling and draining valves are controlled according to the courses in Figure 12(a-II) and (a-III). For the desired 90° angle, the pressure in left muscle rises and the pressure in right muscle drops rapidly until the arm’s position changes to the desired value. Once the desired angle is reached, the position is within tolerance and the mechanism oscillates slightly. When setting a new angle value of −90°, the mechanism is activated again by the means of control valves, with the left muscle pressure decreasing and the right muscle pressure rising. Once the new position is reached, the mechanism stabilizes, but the valve control can be observed again. The last required position is to return the arm to a zero position, where the mechanism will oscillate again. The damping in this state is only by the muscles attached to the gearing. Muscle flexibility again causes oscillation around the desired position until the stiffness of the entire mechanism increases. This control does not correspond to the proper operation.

Measurement of position control without PWM: (a) without load and (b) with load.
When applying the load (Figure 12(b-I) to (b-IV)), the courses have similar characteristics to that of position control without a load. The mechanism is able to stabilize itself, but it is difficult to adjust and control due to oscillation at zero position.
Position control with PWM: without load and with load
In the pressure courses (Figure 13(a-I)), increased stability can be observed even at low pressures. When the PWM control is applied, the system is stabilized even if the PAMs at low pressures have lower stiffness (oscillations in Experiment III). The courses of the control valves are characterized by typical PWM, when the control power does not exceed 25% of the maximum power. When there is a position change request, it is possible to observe the leading edge of PWM course for the quickest possible adjustment of the desired position. Full power of PWM will gradually begin to decrease depending on the difference between the actual and the required values. The course of the required position is out of the tolerance only until the stiffness of the mechanism is slightly increased. The position control procedure (Figure 13(a-IV)) is characterized by an upward concave curve, followed by a constant course and a subsequent convex course of the downward edge when required to change position. The cycle is periodically repeated in the negative position range while maintaining stability within a given tolerance.
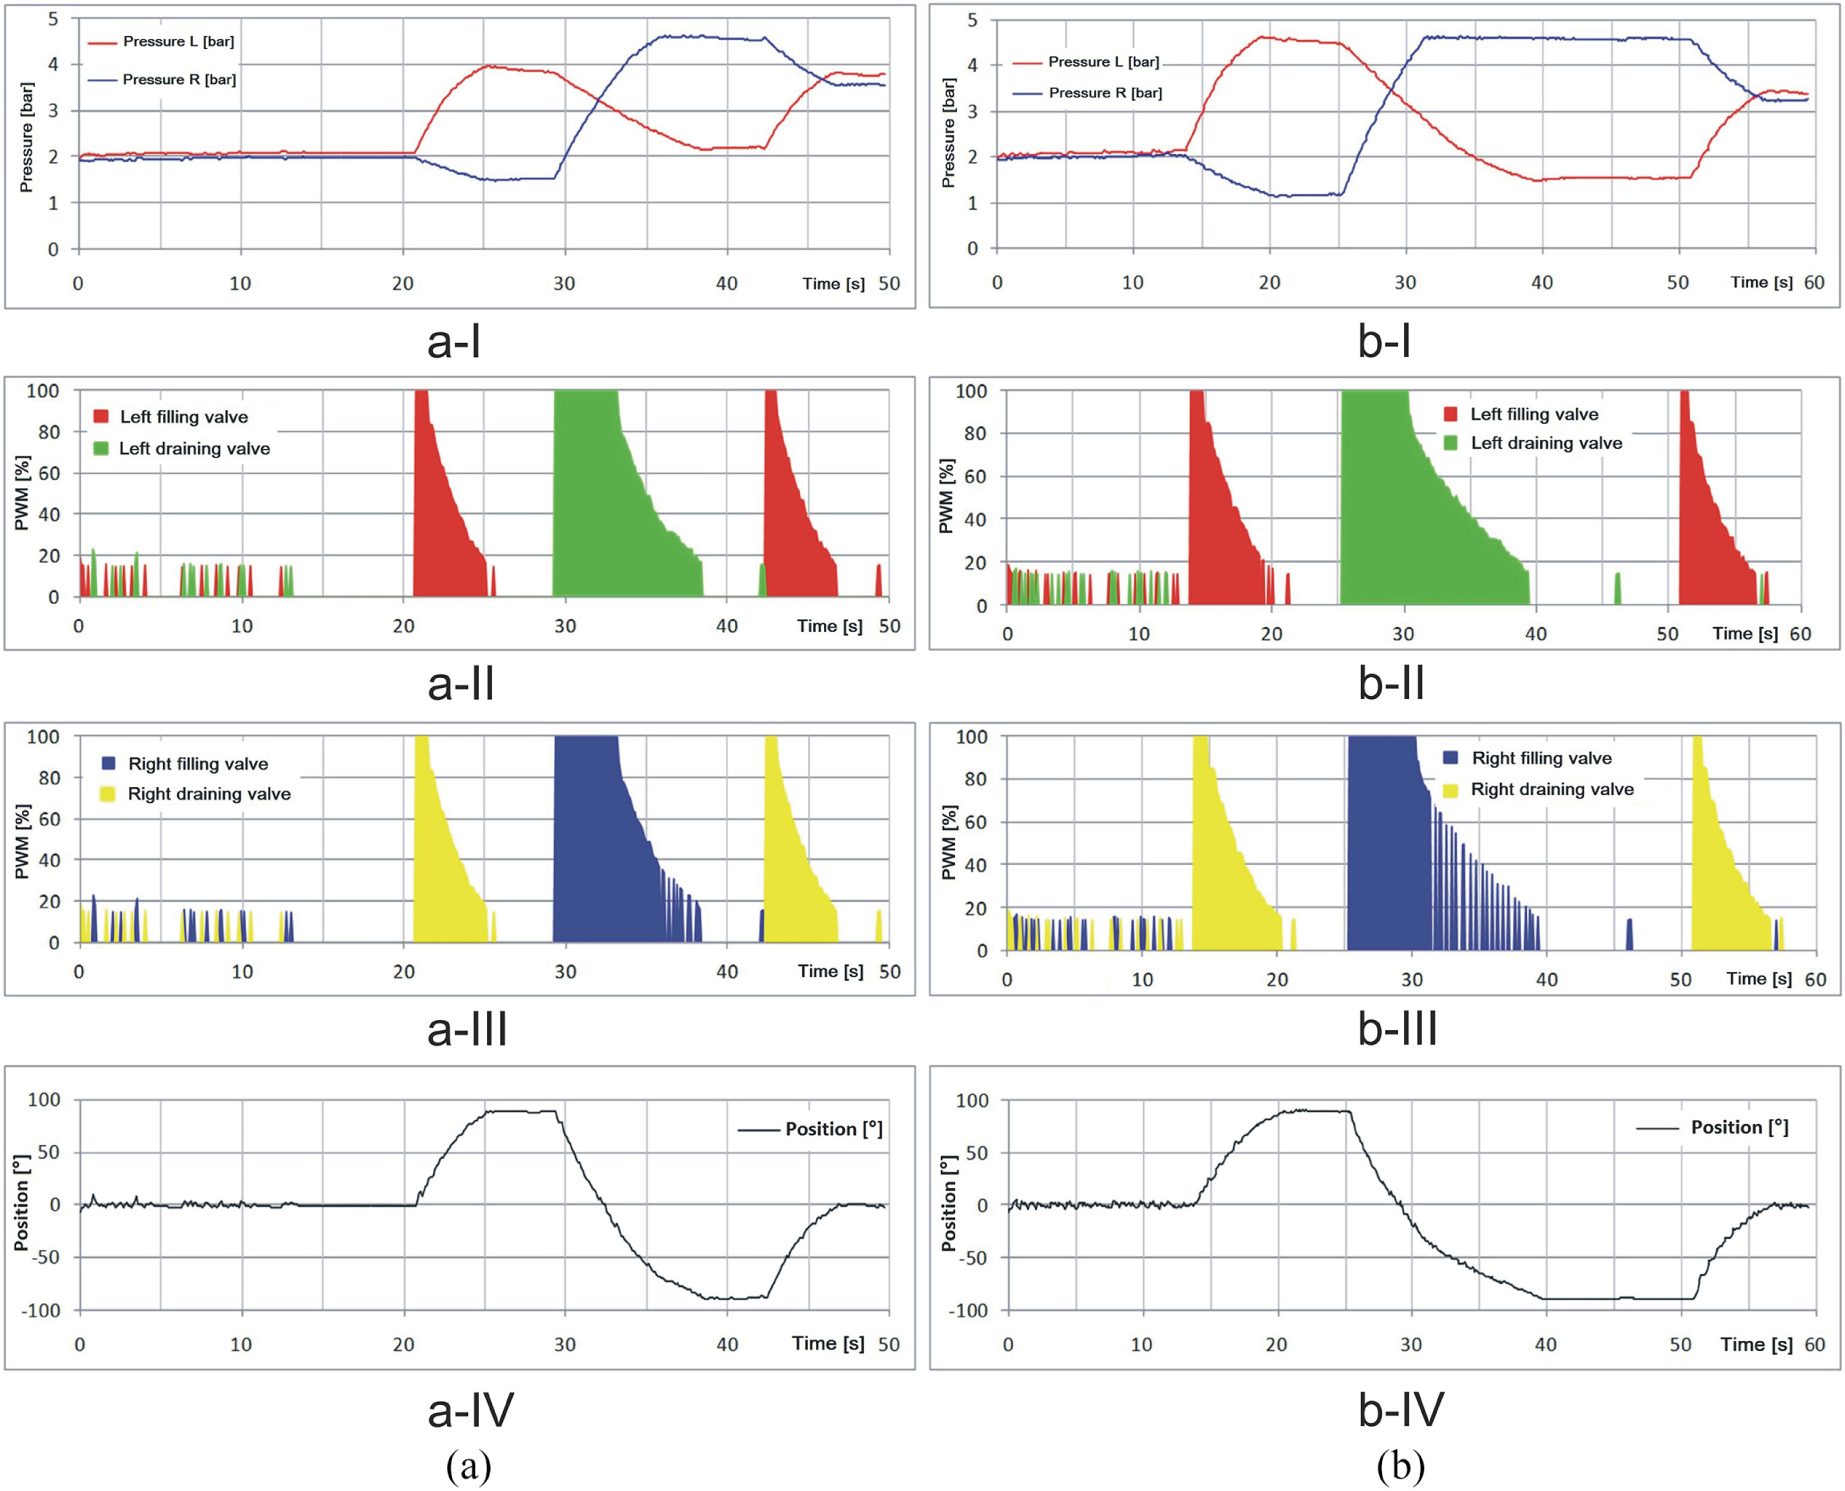
Measurement of position control with PWM: (a) without load and (b) with load.
The courses of position control (Figure 13(b-I) to (b-IV)) with load and applied PWM have the same characteristics as those measured with PWM without load. Position control is smooth and stable throughout the controlled range.
Discussion
As reported by Minh et al., 5 the most commonly used control systems are based on the proportional–integral–derivative (PID) control strategy. These systems are characterized by good robustness in a wide range of applications. However, their application in PAMs is characterized by impaired control capability. Using conventional PI control with proportional valves, Wakimoto 22 achieves the relevant settling times, but the pressure increase exceeds 20%. Therefore, various modifications or applications of other strategies using complex algorithms are applied. Balasubramanian and Rattan 23 use fuzzy logic–based control, and Anh and Ahn 7 apply inverse nonlinear autoregressive with exogenous input (NARS) fuzzy model. Ying et al. 24 achieve similar results using fast PWM switching valves and fuzzy control. Leephakpreeda 25 applies fuzzy logic–based PWM control and neural controlled-variable estimation. In this solution, a proportional-type fuzzy control based on minimum time control is implemented to determine the compressed air mass flow when handling PAM, depending on position and force. Papin 16 describes a PWM control algorithm with quick-acting pneumatic solenoid valves in conjunction with PAM. His results confirm correlation of flow rate, pressure differences, and pulse width by experimental verification. As it is apparent from the mentioned, PWM control is in many cases provided by rather complex algorithms. At the same time, it is difficult to simulate a real course without using a suitable PWM pulse modulation generator.
The results published in this article are comparable to those in the mentioned publications. In this study, the conventional control is replaced by the application of real-time control using the NI cRIO unit in conjunction with the PWM control. The control program is designed to evaluate the required state of electropneumatic valves based on the measured values while using the comparison method.
On the basis of the experiments and analyses carried out, it can be stated that in controlling the required pressure with the PWM in the whole range of PAM pressures, the pressure stabilization and the stability of the required position are achieved. The system has no abrupt distortions or oscillations. The change of load does not influence the stability of the pressure and position courses. Compared to control without PWM, where it is possible to observe both load-free and loaded states modulated oscillations, when applying PWM, these are suppressed thanks to the control system. Switching of the control valves in the pressure control without the load (Figure 8) and with the load (Figure 9) (0%–100%) for the continuous control of the pressure, however, shows that in both cases undesirable oscillations occur. The switching of the control valves when changing the unloaded position (Figure 10) requires shorter total length of control compared to the change of loaded position (Figure 11) but thanks to the PWM control, a fine PWM regulation range within 15% of the required power is applied to stabilize the pressures, saving a significant amount of energy in regulation. The change of position as a function of the pressures has only a damped vibration in the unloaded system, which is caused by the switching frequency of PWM in the control of the pressures and by their interference. The position course of the valve switching is considerably more sensitive than that of the pressure course. The course of position with the PWM control and with a load is more stable (Figure 11(a) and (b-IV)).
In terms of evaluation of achieved position toward the required position, it follows that in the case without PWM for position control with a load, the courses of pressure control (except for position stabilization times) show longer control times of position change (Figure 12(b-IV)). In the case of control with a load, it is necessary to deliver an equivalently higher power. The position courses during regulation show higher speed and stability without a load. During the control with a load, slight deceleration occurs and at the maximum load values also slight overshoot pulse occur to stabilize the position (Figure 12 at time t = 40 s). The measurements confirmed the findings in previous studies1,6–9 where operation of PAMs is significantly affected by hysteresis in terms of an impact on position control as well as by oscillations in the reactions of the system as a whole.
Figure 13(a-I) shows the pressure course at position control using PWM. Position control with a load requires more power than control without a load, but overall PWM control power is significantly lower than that without PWM. When stabilizing the 0° position, the damped oscillations occur due to the system flexibility and PWM frequency. PWM control allows significant removal of oscillations in all observed states. It follows from this that by applying PWM, it is possible to properly alter the character of the leading edge of the pressure course during its change, which is manifested both in the stiffness of the whole antagonistic configuration and in increased accuracy of the achieved position. For the leading edge of the PWM control curve, the valve switching is characterized by the vertical part of the course. The different height of leading edge of the switching corresponds to the different pulse duration of the PWM and is given by the size of the difference between the actual and the required pressure values and the proportional increase in that difference.
At the same time, the PAM system in antagonistic configuration with the PWM control is stabilized, even if the PAMs at low pressures have lower stiffness, which manifests when the conventional control system is applied, as shown in Figures 8, 9, and 12.
Conclusion
The PAM system positioning is characterized by high nonlinearities, variable stiffness, and time-varying control system. This is caused by several reasons such as compressibility of the working medium, fluid flow through the valves, flexibility, high hysteresis, and the like. These theoretical and practical findings were followed during the experiments. The system exhibited oscillating problems with pressure stabilization as well as position stability in both no-load and loaded conditions. However, as can be seen from the carried-out experiments, the application of suitably designed control using PWM has largely eliminated these deficiencies. A repeatability rate was achieved in getting the required values, which is an essential requirement in the PAM control process. The system could be operated under different conditions at the required accuracy levels, both according to pressures courses and according to positioning accuracy requirements. The described control system is able to respond properly to changes in stiffness of the whole system. The system does not indicate any overshoot (pulses), even when applying load to the arm. The results of the experiments point to the fact that by applying PWM, it is possible to influence the nature of the leading edge of the pressure course when it changes, resulting in improved stiffness of the entire antagonistic configuration and, however, the accuracy of the achieved position is increased. When requesting a position change, it is possible to observe the leading edge of PWM for the fastest adjustment of the required position. The reached position is within the required accuracy range of ±1°. These precisions are repeatedly achieved when the accuracy of pressure is required, as well as for the positioning requirement. The courses of the control valves are characterized by typical PWM when the control power almost never exceeds 25% of the total power.
Footnotes
Handling Editor: James Baldwin
Declaration of conflicting interests
The author(s) declared no potential conflicts of interest with respect to the research, authorship, and/or publication of this article.
Funding
The author(s) disclosed receipt of the following financial support for the research, authorship, and/or publication of this article: This work was supported by the Slovak Research and Development Agency under the contract no. APVV-16-0192.