
Abstract
Calcium carbide sludge is a kind of dense paste; when transported by pipeline, the pressure loss is enormous. However, how to calculate the pressure loss accurately has not been solved until now. This article aims to present a new method to build a pressure loss calculation model based on the experimental data of pipeline transportation. To determine the relationship between the pressure loss and the properties of calcium carbide sludge, a new circulating pipeline testing apparatus was designed. The test studied pressure losses arising from changes in the mass concentration of the paste, flow velocity, pipe diameter, and pipe length. Analyzing the obtained data by means of nonlinear curve fitting, the adsorption coefficient and viscosity coefficient were defined and then the calculation formula was deduced. Finally, the calculation formula was verified for a project pipeline with a relatively large diameter equal to φ200 mm and the same parameters as those of industrial applications. The results show that under the appropriate conditions of applying the model, the relative error is less than 20%, so the model can be applied to engineering pressure loss estimation. This method provides a suitable pipe transportation calculation method for dense paste, combining experimental data and theoretical derivation.
Introduction
Calcium carbide sludge from acetylene production and other industrial processes1,2 has a high solid content, and its apparent viscosity can reach several thousand Pascal seconds. These calcium carbide sludge tailings in industry are also referred to as “dense paste” in this article to describe a sort of material that consists of high solid content and small particles, showing high viscosity and having a state somewhere between solid and fluid. In industry, the annual output of calcium carbide sludge increases continually, and it is used as a building material or for the production of soda ash due to its physical and chemical properties. If it is transported by open transportation methods, such as delivery wagon, it cannot avoid polluting the surrounding environment. So pipeline transportation is the best way to utilize sludge while limiting the potential for pollution.
Sludge is a special kind of non-Newtonian fluid that exhibits plug flow in pipes under high pressure. When it flows in a circular pipe, a thin layer exists between the inner pipe wall and the center plug, which is called the boundary layer.3,4 In addition, wall slip phenomena can be observed. Despite the large body of research about the boundary layer and wall slip, their contributions remain a mystery.3,5 Therefore, it is difficult to predict or calculate the resulting influence on the pressure loss. In industry, pressure loss is a key parameter to design and configure a pipeline system. So clarifying the pressure loss calculation model of calcium carbide sludge flow in a horizontal pipe plays an important part in industrial type selection.
Owing to this special flow state, pressure loss cannot be predicted with the traditional formula. To find the pressure loss characteristics and develop a calculation model of calcium carbide sludge flow in a horizontal pipe, many methods have been carried out to study the rheological properties,6–8 but most of them mainly focus on dilute slurry.9–13 Currently, there are three ways to calculate the pressure loss: theoretical derivation, dimensional theory, and empirical formulas. 14 For calcium carbide sludge, the empirical formula method is more feasible than the others, considering the lack of related theoretical studies. Several empirical formulas are used to calculate the pressure loss, such as the Jinchuan formula, Durand formula, and Xinwen formula. 15 A previous report 16 on the calculations of a high-concentration ore pulp in pipeline by MRI (magnetic resonance imaging) indicated that using the Wilson hierarchical model to calculate the pipe pressure loss is ideal. Another report 17 presented a pressure loss expression between the rheological and concentration properties and obtained a formula for the transportation pressure loss of a filling pipeline by analyzing the results of the mine filling of pastes. Yet another report 18 developed a formulation of Zhaotong lead–zinc filling pastes and then derived the Zhaotong formula of pressure loss calculation of pipeline transportation.
All the methods above provide some ideas for the calculation method applied for calcium carbide sludge. This sludge has a higher concentration and viscosity than those of ordinary paste. The physical properties of the above materials are different from those of calcium carbide slurry, and whether the theories can be applied to this sludge requires further study. The research on calcium carbide sludge is lacking, and a more effective formula for the sludge based on the measured data needs to be built. In this article, the flow theory is introduced first, and then the test principle and scheme are listed. Based on the principle, the pressure loss characteristics of calcium carbide slurry in pipeline transportation and the pressure loss calculation model are collected and established, respectively. Finally, another system which has the same test principle with bigger pipe diameter has been used to carry out the same tests to validate the results.
Theory
Flow state
Calcium carbide sludge paste exhibits plug flow when transported in pipes, as shown in Figure 1. When the dense paste flows, the center part undergoes no internal shearing as a whole, so the plug flow is also described as having a “flow core.” 19 A thin water-rich layer forms near the inner walls of the pipes.20–22 It can be observed that water appears on the surface of the plug flow and imparts a high water holdup. Although the boundary layer is thin, it can lead to substantial pressure drag reduction in pipe flow near the inner wall in the laminar flow regime.

Flow profile of calcium carbide sludge (75 wt%).
Pressure loss analysis
From the above flow state analysis, it can be found that calcium carbide sludge is a non-Newtonian fluid. It is different from general non-Newtonian fluids such as the Bingham fluid, power-law fluid, and Casson fluid. Therefore, the well-established fluid formula cannot be applied to calculate the pressure loss of calcium carbide sludge.
When calcium carbide sludge paste is transported in a pipe, the state is plug flow, which is similar to the case for coal slime. Therefore, the formula applied to coal slime in pipe was adopted for use in calcium carbide sludge.
14
The pressure loss can be expressed in terms of two aspects: the adhesion coefficient


But the above two parameters
Material and methods
Material
In this experiment, the dense paste used is calcium carbide sludge, which exhibits high viscosity and high water-holding capacity. The calcium carbide sludge particles are fine, even powdery, with various shapes; they are absorptive and tend to form agglomerates. After dewatering by filtering, the mass concentration of calcium carbide sludge is 55% to 65%, and its apparent viscosity ranges from hundreds to thousands of Pascal seconds accordingly. In our samples, the granularity of the calcium carbide sludge particles ranges from 2 to 1000 µm, while the median diameter of the constitutive particles is 70 μm, as shown in Figure 2. The larger the amount of fine particles, the higher the surface energy of the particles and the larger the viscosity of the material. 26 The particle density is 2.23 g/cm3. During the test, the paste temperature is maintained at 21 ± 2°C.
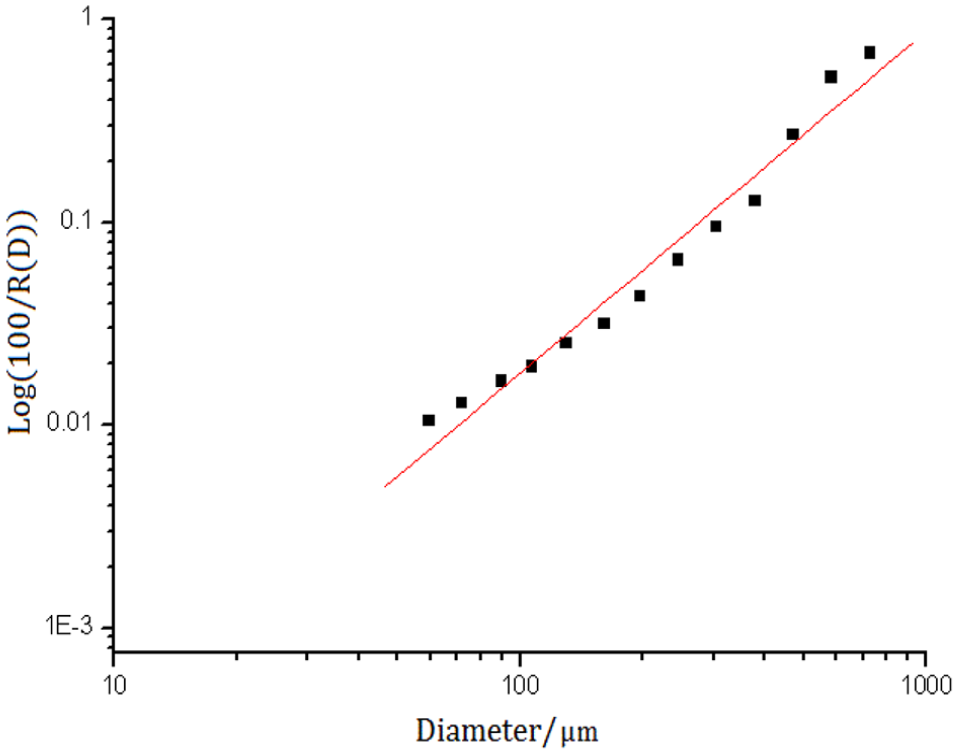
Grain size distribution curve of calcium carbide sludge and distribution regularity analyzed by the Rosin-Rammler method.
Test principle and scheme
On the basis of the aforementioned testing concept, a test system named the circulating pipeline testing apparatus 24 is designed to measure the pressure loss per unit pipe length and flow velocity of paste in a horizontal pipe. A schematic diagram of the designed pressure loss test system is shown in Figure 3. Calcium carbide sludge paste is stored in open storage silos (marked by 1 in Figure 3). When the hydraulic piston begins the backward reciprocating motion, the gate valve (marked by 2) between 1 and 3 opens, and the paste is sucked into the material cylinder (marked by 3). Then, the hydraulic valve closes, and the electric gate valve (marked by 4) opens. Therefore, the transferred paste can be discharged steadily through the horizontal test pipes (marked 5). Finally, the paste flows back to the storage silos through pipes.
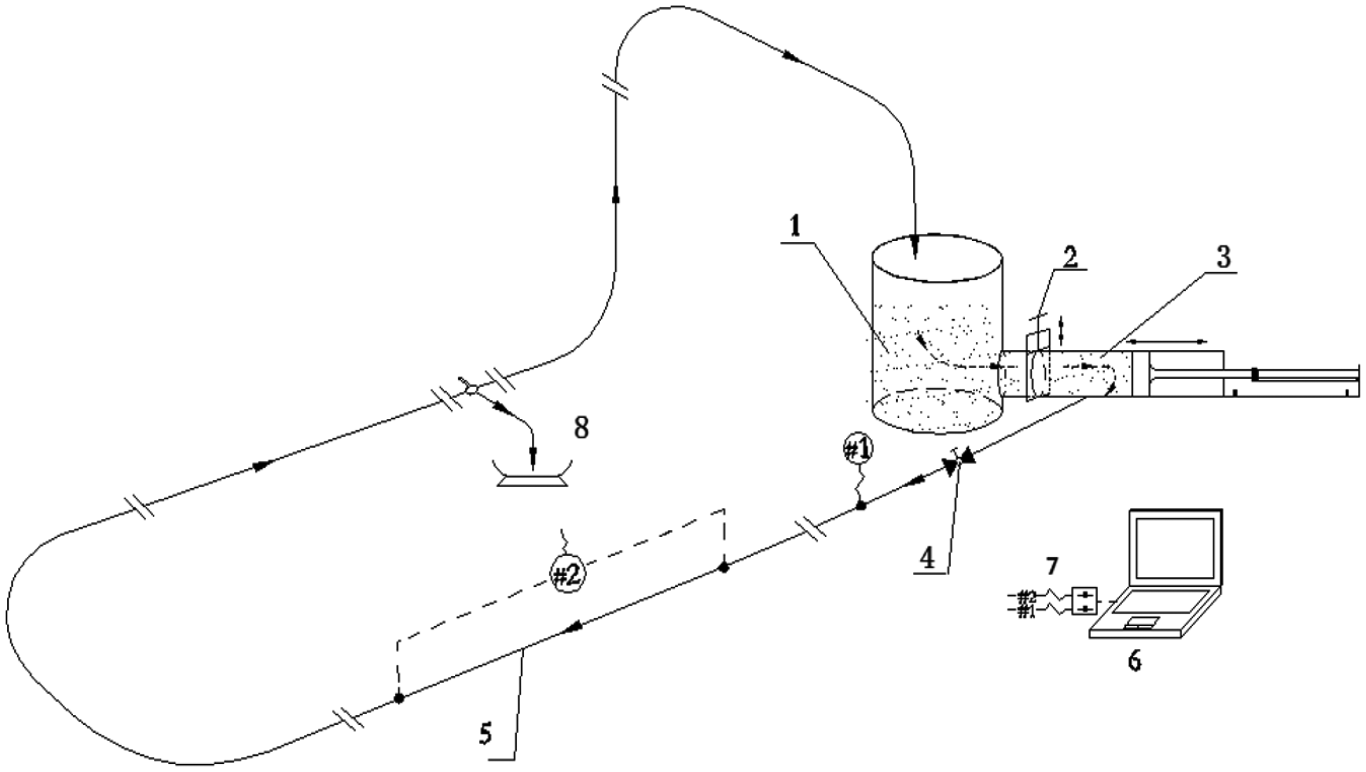
The measured schematic diagram XGS (C) 40–89 cycle piping test platform.
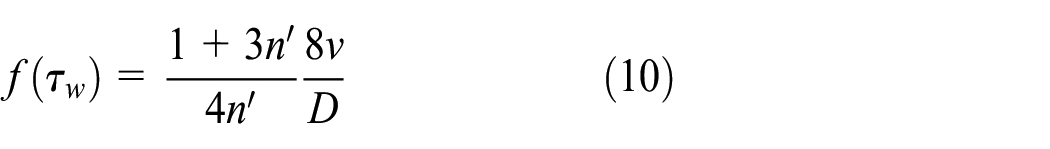
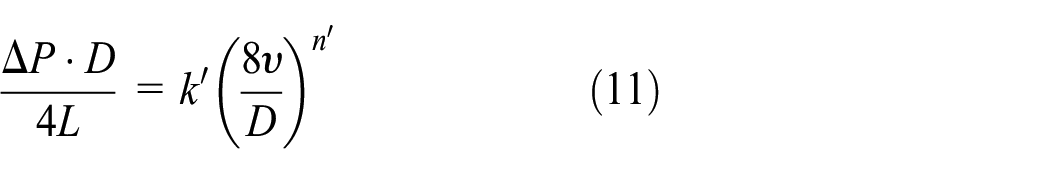
There are two key parameters to measure the pressure drop and flow velocity. The pressure drop is measured by electric differential pressure sensors ranging from 0 to 650 kPa with an accuracy of 0.5%, which were installed on the test pipe. The flow velocity can be calculated by the velocity relationship of paste in test pipe and material cylinder. The velocity of paste in material cylinder is equal to the forward distance divided by the discharging time which can be recorded by the pull wire displacement sensor. The real-time flow and differential pressure can be recorded using the NI-6032 DAQ Card. The flow rate of dense paste flowing through the pipe is equal to the piston speed times the cross-sectional area of the material cylinder. The test principle is as follows.
The velocity of the paste in the pipe is
The flow rate can be given as follows

Substituting equation (1) into equation (2), we obtain

For a Newtonian fluid,

The wall shear rate
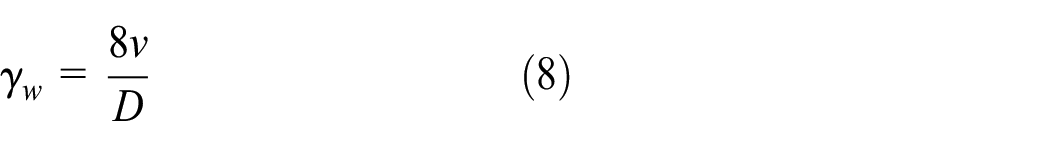
However, for a non-Newtonian fluid, the wall shear rate
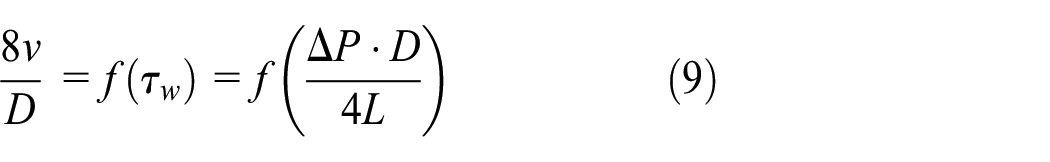
According to the Robin Norwich–Mona equation, we have
where
The parameters
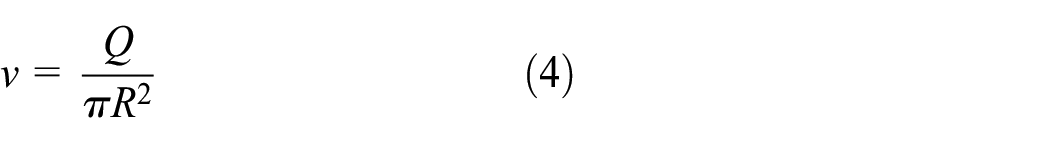
During the process, the flow velocity
Test data analysis
When calcium carbide sludge flows in a horizontal straight pipe, the relationships between the pressure loss and other factors (pipe length L, paste concentration Cv, pipe diameter D, and flow velocity v) were investigated on the above cycle piping test platform.
Transportation resistance as influenced by the pipe length
The mass concentration of the tested calcium carbide slurry is 59.57%. Taking the pipe lengths L = 1 and 2 m as examples, the pressure loss under different flow velocities (0.1–0.9 m/s) was obtained, as shown in Table 1.
Test data between the pressure loss and pipe length.

It can be seen from Table 1 that the pressure drop of 2-m pipe is approximately twice the pressure drop of that of 1-m, which indicates that the transportation pressure loss is proportional to the transportation distance, that is,
Transportation resistance as influenced by the flow velocity
The mass concentration of the calcium carbide slurry used in this test is 62.25%. The relationship between pressure loss per unit and flow velocity is shown in Figure 4.

Effect of flow velocity on 62.25% mass concentration of slurry in pipe flow with different diameters.
Figure 4 shows that the relationship between pressure loss and flow velocity is linear growth, which can be written as
Transportation resistance as influenced by the pipe diameter
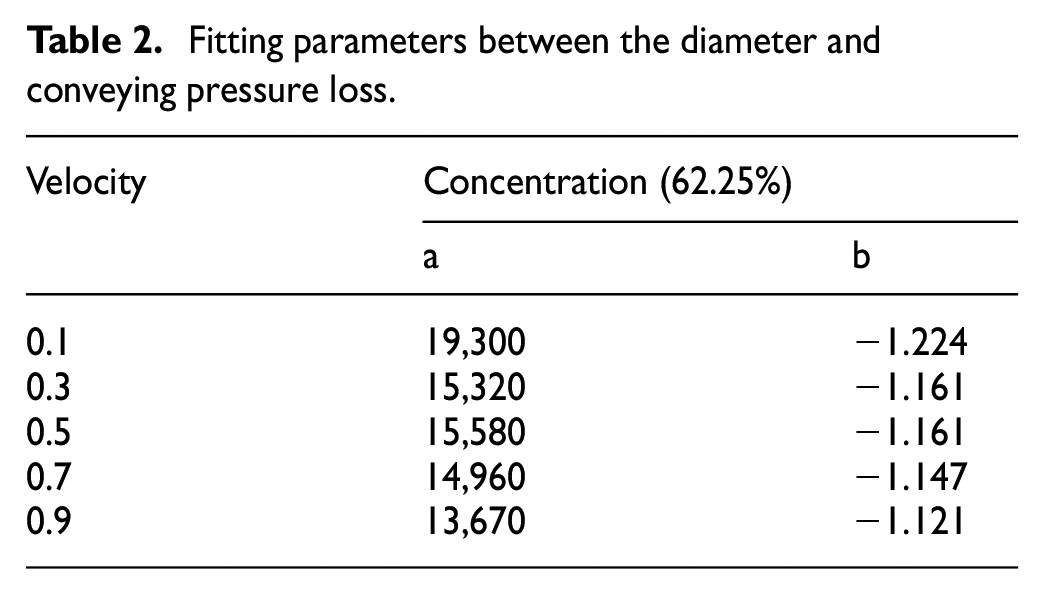
To study the relationship between pressure loss and pipe diameter, taking the concentration as 62.25% and unchanged, the pipes of diameter between 37 and 80 mm were set as the test pipe continuously. During each test, five groups of velocities between 0.1 and 0.9 m/s were set, and the pressure loss was measured for each group in the pipeline.
Figure 5 shows that the pressure loss per unit length decreases exponentially with the increase in pipe diameter when the concentration and flow velocity are constant. The trend of different diameters is consistent with exponential function, so it can be entirely described with the exponential relationship, which can be written as

where

Effect of diameter on 62.25% mass concentration of slurry in pipe flow with different flow velocities.
Fitting parameters between the diameter and conveying pressure loss.
Transportation resistance as influenced by the concentration of paste
To study the relationship between pressure loss and concentration, mass concentrations were set to increase continuously between 56% and 63%, while the pipe diameter is

Effect of pressure loss on mass concentration of paste in pipe flow with different flow velocities (the diameter of the pipe is 48.12 mm).
It can be summarized that the pressure loss and concentration follow an exponential relationship if the diameter and flow velocities do not change, which can be written as

where
The pressure loss calculation model of calcium carbide slurry in a pipe
Based on the relationships between pressure loss and the factors discussed above, it can be concluded that when the concentration and diameter are constant, the pressure loss and velocity are linearly related. When the concentration and velocity are constant, the pressure loss is inversely proportional to the diameter. Referring to the S. Morinaga formula, equation (1), the pressure loss can be divided into two parts, and the calculation model is as follows

where
Thus

According to equation (15), data of

The function of

According to this method, the series data of f1 and f2 tested with different concentrations can be obtained. The relationship of f1 and f2 and the concentration


Inserting equations (16) and (17) into equation (15), the pressure loss calculation formula of the calcium carbide slurry in the pipeline is

Equation (18) is the pressure loss equation, which can be expressed with only three physical quantities, all of which can be easily measured. When calcium carbide pastes are transported in a pipeline, the pressure loss can be calculated easily by equation (18). The pressure is the key parameter of dense paste and is the fundamental parameter for pipeline system design.
Validation of results
Equation (18) is based on laboratory conditions, but the diameters used in engineering applications are usually 200 mm or wider. Therefore, another pipe transportation system with a diameter of φ200 mm is used to perform the same test with the same calcium carbide slurry. This system is the same as that used in industrial applications. The test results of this system make it clear whether equation (18) can be applied in industry.
During the test, the flow velocity and concentration of slurry are controlled to be constant. Substituting the mass concentration

The relative error is shown in Figure 8. Although the two results are different, the errors are all below 20%. Owing to the difference in test conditions, the diameter of this system with a diameter of φ200 mm is larger than previous circulating pipeline testing apparatus. It is all known that there will be some changes in rheological properties when the diameter of the pipe changes. And the error is within acceptable limits. So it is concluded that the pressure loss equation based on experiments is still applicable for calcium carbide paste in pipeline transportation projects. This method can be used in the pressure loss calculation, and the error is within the permissible range for engineering practice. Thus, this research on flow patterns and measurement signals has great significance for engineering design.
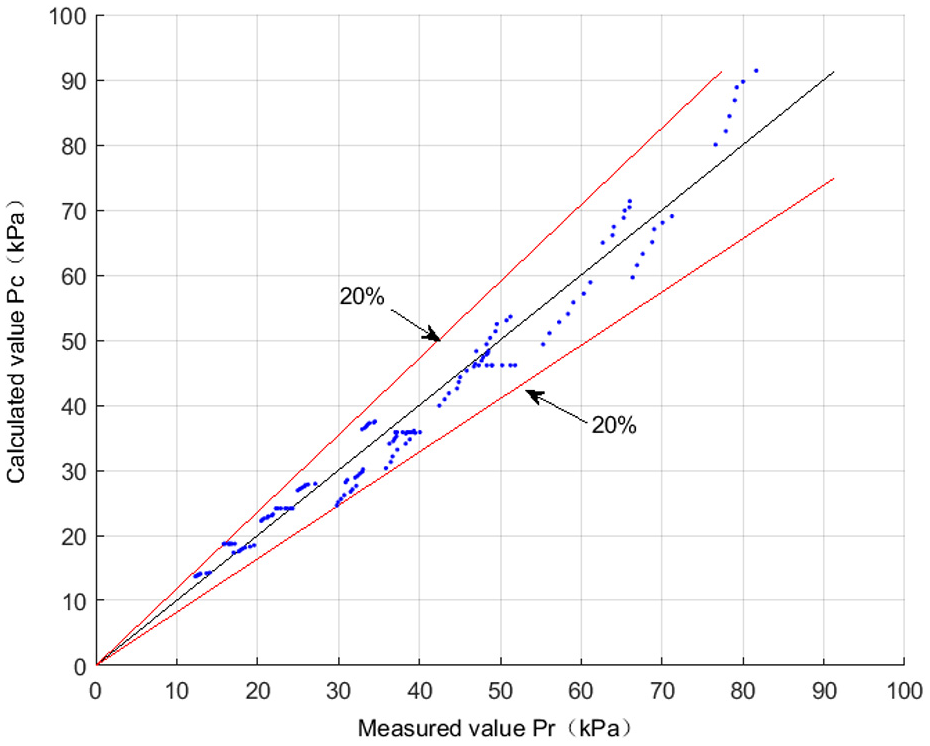
The relative error between the calculated and measured numerical results.
Conclusion
This article first studies the influencing factors of calcium carbide slurry flowing in pipes. The relationships among transportation pressure loss and pipe length, mass concentration, diameter, and flow velocity are established. By referring to the S. Morinaga formula, the pressure loss calculation model and formula for a project pipeline are deduced. The different test results show that this method can be used to calculate the transportation pressure loss in engineering design, and the error is in an acceptable range. According to the test results and formula, the conclusions are as follows:
The pressure loss is proportional to the pipe length and flow velocity but inversely proportional to the diameter. In addition, the pressure loss has an exponential relation with the paste concentration.
Based on the relationship between pressure loss and input factors, the calculation formula of calcium carbide slurry is derived. The formula is verified by the same experiments with a larger diameter pipe system. The results show that the formula can be applied to industrial situations.
The calculation model can be directly applied to predict the pressure loss of calcium carbide sludge with only three parameters (mass concentration
Discussion
The developed formula applies to calcium carbide slurry, but for other slurries its applicability needs to be further studied, such as for red mud, sewage sludge, and coal slime. In the above research, many factors that related to the pressure loss in pipe were fuzzily classified, and the main factors as variable parameters were selected to perform the relevant experiments, such as the viscous coefficient and adsorption coefficient. In the future, we expect the test methods to progress, and more detailed research will follow. However, the parameters used will change if the samples and the experimental system change from one situation to another.
Footnotes
Appendix 1
Handling Editor: James Baldwin
Declaration of conflicting interests
The author(s) declared no potential conflicts of interest with respect to the research, authorship, and/or publication of this article.
Funding
The author(s) disclosed receipt of the following financial support for the research, authorship, and/or publication of this article: This work is supported by the Natural Science Foundation of Shandong Province, China (ZR2018BEE014), the Scientific Research Foundation of Shandong University of Science and Technology for Recruited Talents (2017 RCJJ028), and the National Science Foundation (51801115 and 51905314) and Key Research and Development Project of Shandong Province (No. 2018GGX103027), Applied basic research project of Source Innovation Program in Qingdao (18-2-2-20-jch).