
Abstract
When a tamping machine is tamping track ballasts under railway, it is necessary to determine the tamping positions in advance. This study proposes a peak detection algorithm to locate rail spikes with magnetic sensor signals, and then determine the tamping positions. In this algorithm, we have performed the downsampling, sliding window, threshold classification, and secondary peak search to complete peak detection. Especially, we discuss how a sliding window length, a downsampling frequency, a secondary-search-window length, and other parameters affect the performance of the algorithm. In experiments, we use a group of real magnetic sensor signals to evaluate the algorithm. Compared with traditional methods, the proposed algorithm can reduce the false positives and misses of peak detection to 0, while the maximum location error will not more than 1 cm.
Introduction
The aim of tamping track ballasts under railway is to tamp the gap between sleepers and the ballast bed, make sleepers and the rail evenly stressed, and let ballast bed flat and compact. After tamped, the buffer capacity of track ballast can be enhanced, the positions of track are stabilized, and thus the safe operation of the railway will be ensured. The track tamping operation is done by a tamping machine, which usually needs to determine the positions of tamping in advance. If locating is wrong, the hoe may damage the railway and sleepers, and even tamping machine itself. 1 Therefore, how to find the positions of tamping is one of the most important steps in the tamping operation.
The traditional location adopts manual methods. An operator preliminarily judges the positions of tamping, stops the machine, and then presses a pedal. The hoe in the machine will be put down to the positions for tamping. After tamping completed, the hoe is lifted and then moved to the next position until the whole railway line completed. Such manual operation is laborious and inefficient. Furthermore, the fatigue operation is easy to cause operation error. In order to reduce the intensity of the manual operation and improve the efficiency, various automatic location methods have appeared in recent years. A simple method is an equidistant location method, which is to fix the working distance of each step of tamping. 2 However, this method is only suitable for rails with equal sleepers spacing, while the actual rail spacing is likely a random variable with a normal distribution. One available method is automatic positioning by sensors. Since the signals generated by the sensors through the track fasteners or rail spikes are different from those from other components, fasteners can be easily identified and the positions of tamping are determined. Sensors for locating include infrared sensors, laser sensors, and contact sensors, 3 but they still have problems. The infrared sensor uses the different temperatures between rail spikes and other components to identify the spikes, but the temperature differences between them are not very large in actual use. Optical instruments in laser sensors are required to be cleaner to ensure the effectiveness of measuring, but it is difficult to guarantee this condition in such a dusty railway. The contact sensor uses a contact switch to detect fasteners. However, the switch itself is a mechanical device and its effect is related to the installation positions and shapes of fasteners. When fasteners’ positions and the switch are not at the same level line or fasteners themselves are damaged and missing, identification performance will also be affected. In addition, computer vision technology can also be applied to the identification of sleepers and fasteners,4–8 but this technology is based on the images taken during tamping operation. If the shooting light is dim or sleeper itself is covered by ballast, the identification becomes also difficult.
Since the above sensors location methods have several problems, we consider a multi-sensors location system. In this system, the magnetic sensor is used to detect rail spikes. Since the sensor uses the magnetic change of a target to detect, the interference caused by occlusion, illumination, temperature, fouling, and poor contact can be reduced. Thus, this magnetic sensor method has strong environmental adaptability. To overcome the shortcomings that the magnetic sensor cannot detect rail spikes near fishplates, besides, image detection is also used for sleeper identification. Therefore, the positions of tamping are finally determined from rail spikes or sleeper.
This study mainly focuses on the problems of magnetic sensor locating rail spikes in the multi-sensor system and studies an effective and easy peak detection method. In experiments, we use a group of real magnetic signals sensing rail spikes to evaluate the proposed method. We compare the proposed method with traditional ones via the metrics of misses, false positives (FPs), and computational complexity and give results for multiple groups of parameters. From the results, when we use the techniques of downsampling, sliding window detection, threshold classification, and secondary peak searching for peak detection, the number of misses and FPs can be reduced to 0 and the number of searches (NSs) is about 104. And, the maximum location error will not more than 1 cm.
Related work
In order to accurately find the positions of rail spikes, the peak detections from magnetic sensor signals will include several steps such as multi-value optimization and classification. The location of rail spikes from magnetic sensing signals is actually a multi-value optimization problem. That is, finding a peak in each segmented magnetic signal chip and the peak coordinate will point to the location of a rail spike. In traditional optimization algorithms, the most popular ones are evolutionary algorithms. They start from random solution and find optimal value through iterations. Because of the evolutionary algorithms’ high precision and fast convergence, they have received more general attentions.9–11 The particle swarm optimization algorithm is a representative evolutionary algorithm, which seeks an optimal value in a solvable space through the cooperation and information sharing among individuals in groups.9,10 Genetic algorithm is also a good evolutionary algorithm, which seeks an optimal solution by imitating the choices of nature and the mechanism of inheritance. 11 Unfortunately, the evolutionary algorithms are a global optimal algorithm and are less concerned with local optimal values. For rail spikes’ magnetic signals, we just need to find each local extreme point. Multi-peak detection is a type of algorithm that can find multiple local optimal points,12–16 and automatic multiscale–based peak detection (AMPD)17,18 and Fibonacci peak detection (FPD) 19 are such a multi-peak detection algorithm.17–22 In applications, however, optimization performances and computational complexity of the multi-peak detection algorithms often depend on the parameters such as search range, search depth, and the number of sprinkling. Inappropriate parameter settings often lead to slow convergence of algorithms, failure to find extreme values.
In addition to rail spikes, there are some peaks in magnetic sensor signals that correspond to the fishplate and need to be removed by a classification algorithm. Existing classification can be broadly classified into supervised and unsupervised ones from whether they need to learn, from data with tags. Supervised classification requires training from data with tags. It learns through existing training samples to obtain a classification model, and then maps inputs to corresponding tags, 23 for example, neural networks. If the supervised classifications are applied to magnetic sensor locating rail spikes, a large number of training samples will be required, and thus have a high complexity. It will improve cost for the application to engineering. Unsupervised classification does not require learning from samples with tags. K-means 24 is a typical unsupervised classification method, which minimizes intra-class distance and maximizes inter-class distance by clustering. However, K-means algorithm has some problems when applied to peak classification, such as the selection of K value and the number of iterations. The computational complexity will depend on these factors. Of course, there is another kind of easy classification method that we can consider. It could be more practical to directly extract features from time or frequency domains. 25
Rail spike location is a typical engineering problem, just like in the study by Tang et al.26,27 When applying the above algorithms to this engineering practice, it is necessary to consider the performances of the algorithms and whether higher computational complexity will result in excessive system overhead. Thus, the focus of this study is to determine an effective and easy way to locate rail spikes. In addition, the setup of parameters will also have an important impact on the performances of the algorithms. Therefore, the selection of parameters is another issue that this study should pay attention to.
Problem description
Due to the instability, contamination, and breakage of the tamping condition in ballast track, only one single sensor is difficult to meet the requirements of automatic positioning. Therefore, we consider a multi-sensor location system with magnetic signal and image recognition. When fishplates interfere with the magnetic signal of the spikes, the sleeper is recognized by the image; when the sleeper is covered by ballasts or the image is difficult to recognize, the magnetic sensor is used for location. Under such a system, we focus on the algorithm of magnetic sensor locating spikes.
The location of rail spikes through the magnetic sensors is actually to process the magnetic signal. A magnetic sensor is installed on a tamping machine. When the machine goes, the magnetic sensor collects the corresponding magnetic signals. Compared with rail, sleepers, and ballasts, rail spikes have different magnetic properties, so their magnetic signals will also be different from the others. The signal waveforms are shown in Figure 1. It can be seen from the figure that signals from rail spikes are just local peaks and we can locate the spikes via the detected peak. Therefore, the problem of rail spike location can be regarded as a peak detection for rail spike magnetic signals.

Location of rail spikes through magnetic sensor signals.
In addition to peak signals from rail spikes, magnetic signals in Figure 1 also have some peak signals from fishplates. Rail spikes’ peak signals are disturbed by fishplates and are difficult to be detected. Thus, the detected peaks from fishplates cannot help us locate them and hence need to be screened out of the signals. How to screen out the peaks from fishplates is a classification problem. For the location, in this case, the system also needs to recognize sleepers for the tamping location through image recognition. Since image recognition is not the focus of this study, it will not be discussed more here.
Finally, magnetic sensor signals used in the system are sampled per constant millimeters. That is, the number of sampling points can be transformed to the corresponding kilometer coordinate. Therefore, the rail spikes’ kilometer coordinate can be determined from its detected peak position. From the adjacent rail spikes’ positions, for example, the center of the two spikes, the positions of tamping can be finally determined.
Peak detection algorithm research
Downsampling
The raw signals collected from the magnetic sensor are sampled per constant millimeters. If the sampling interval between adjacent sampling points is small, the number of sampling point will be more during a long measured distance. In order to reduce the NS for peak detection, we can perform a downsampling step first. The detected peak in the downsampled signals can be tracked to the original magnetic signals, and then we will perform a secondary search to find a more accurate peak. If a raw magnetic digital signal sequence is

where
Peak detection
The magnetic sensing rail spike signal is actually a one-dimensional signal that approximates a sinusoidal pattern, from wave-valley to wave-peak and from wave-peak to wave-valley. Consider a sliding window method for the peak detection, as shown in Figure 2. Given the wth sliding rectangular window with length


Sliding window peak detection.
if and only if

where
Compared with traditional peak detection algorithms, the sliding window method of equations (2) and (3) can find a peak through several comparisons and does not need to iterate or solve an objective function.
Besides, how to set the window length

Impact of window length on peak detection: (a) smaller window length introduces pseudo peaks and (b) larger window length causes peak missed.
Repeat detection
Since actual sensor signals are usually disturbed by noises, there is a phenomenon that a rail spike may correspond to multiple peaks. For example, a rail spike corresponding to a peak point degenerates into a straight line in a short time, or becomes multiple peak points, as shown in Figure 4. In this case, it can be checked whether it is the same peak by judging the distance between adjacent peak points. Assuming

then, it is considered that the two peak points correspond to the same spike, where

If the values of peaks are much different, a maximum principle can be used, expressed as


Peak repeat detected for rail spikes.
Peak classification
The detected peaks can be divided into two types. One is for rail spikes and the other is for fishplates, as shown in Figure 1. The peak signals of fish plate submerge rail spike information and make it difficult to locate rail spike. Therefore, the types of peaks need to be screened out. A feasible method is to use classification algorithm, but classification algorithm first needs to extract features from the classification object. A principal component analysis (PCA) method 28 can automatically extract features and achieve dimensionality reduction of features. We can first segment the magnetic signals into some chips with peaks, then use PCA to extract features, and finally cluster with K-means. However, the K-means is an unsupervised classification and its computational complexity is generally high.
Here, we consider using the value of a peak as the feature for classification. Since the size and weight of fishplate are usually larger than rail spikes, a stronger magnetic signal is generated. As shown in Figure 1, the amplitude of the fish plate signal is much larger than the rail spike signal. Thus, it is reasonable for the value of peak to be used as feature values. Let

where
Second searching
When peaks of rail spikes are detected, the position of peaks needs to be converted into the kilometer coordinates for final tamping location. This step will consist of two sub-steps.
First, the detected peaks in the downsampled points are traced back to original sampled points to perform secondary searching. Assume that the nth sampling point

is satisfied, where

Secondary search peek in raw magnetic signal.
Table 1 shows the searches number of downsampling secondary
The search number of downsampling and non-downsampling.

Second, the kilometer coordinates of peak points need to be determined. The magnetic sensor signals are sampled at constant millimeters, where peak points can give the coordinates of rail spikes desired. If magnetic sensor signals are sampled at a distance
Finally, the steps for rail spike peak detection are given, as shown in Table 2.
Peak detection algorithm for rail spike.

Experiment
Experiment setup
The sensor that collects magnetic signals in this experiment is developed from Turck sensor. The specific parameters of the sensor can be found in the previous literature. 29 The signal acquisition process is shown in Figure 6. A wheeled car is placed on an actual railroad with a complete rail, sleepers, ballast, and track bed. The magnetic sensor is fixed under the car near the rail to enable it to sense magnetic signals from rail spikes or fishplates. Then, the car is driven forward at a constant speed, and at the same time, the corresponding magnetic sensor signals are collected. The data collected by the sensor are two-dimensional data, one dimension is the signal amplitude and the other is the corresponding position, that is, the kilometer coordinate. We test our system in a rail of about 98 m, so we collect a total 98 × 103 magnetic data points. The collected magnetic sensor signals are first normalized to an interval [0 1], and then peak detection algorithms are performed.

Magnetic sensor signal acquisition.
In this experiment, we compared the detection results of downsampling slide-window peak detection algorithm (DSPD), non-downsampling slide-window peak detection algorithm (NSPD), AMPD algorithm, and FPD algorithm, where DSPD and NSPD are given in Table 2, and the difference between them is whether the downsampling in equation (1) and the second search in equation (8) are used. In addition, we also compared the threshold classification in equation (7) with PCA + K-means classification. Table 3 gives K-means parameter settings, and Table 4 gives the other related parameter for the above algorithm.
Parameter settings in PCA K-means.

PCA: principal component analysis.
Parameters in peak detection algorithm.

DSPD: downsampling slide-window peak detection; NSPD: non-downsampling slide-window peak detection; AMPD: automatic multiscale–based peak detection; FPD: Fibonacci peak detection.
Finally, experimental results introduce true positive (TP), false negative (FN, i.e. misses), FP, and the NSs to evaluate the performances of each algorithm. Besides, the result of maximum positioning error

where
Comparison of peak detection algorithm
Figure 7 shows FP, FN, and TP of four peak detection algorithms DSPD, NSPD, FPD, and AMPD. The relevant parameters for DSPD and NSPD are shown in Table 4. As can be seen from the figure, there are misses in the AMPD and FPD algorithms, while DSPD and NSPD do not have misses and FPs when selecting the parameters of Table 4. The reason is that the detection performance of AMPD and FPD depends on their parameter selection, and the selection of parameters is determined by objective function. Due to the randomness of rail spike spacing and the non-stationary of the magnetic signals, it is difficult for AMPD and FPD to guarantee that all peak points will be found only through fixed parameters, seen in Figures 8 and 9.
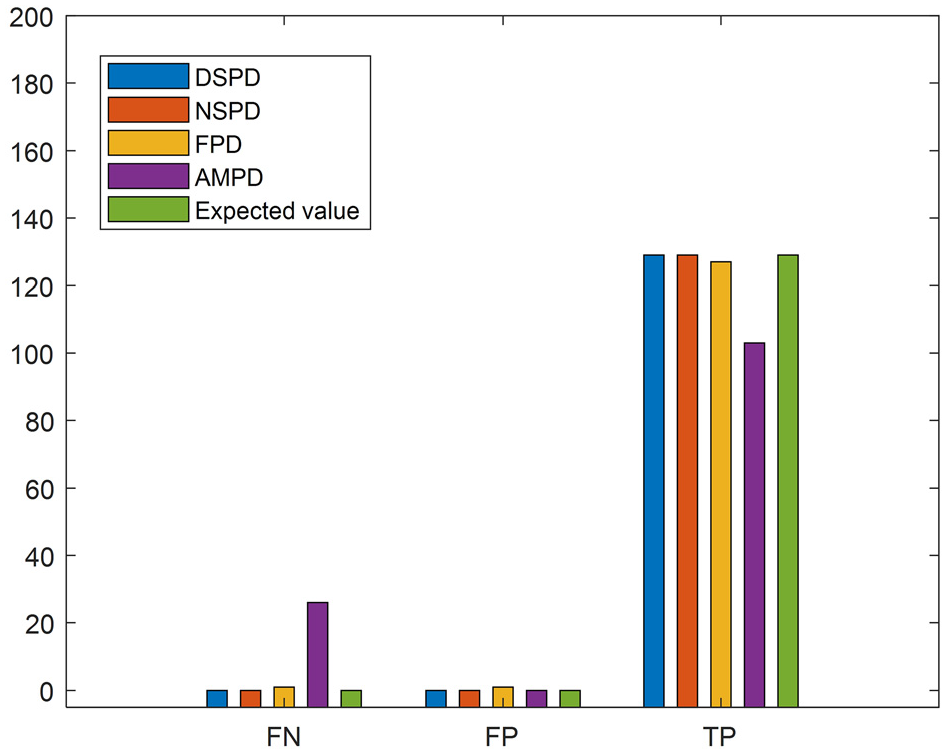
Comparison of peak detection algorithms.

FPD results.

AMPD results (part of the result).
Comparison of peak classification
Figure 10 shows the classification results of threshold method and K-means for rail spike and fishplate peaks. Figure 11 also shows the results of clustering in K-means classification. Note that K-means is to first perform PCA dimension reduction and then to cluster. Since PCA is a classical classification for data dimension reduction and data redundancy, we chose it as a comparison here. As can be seen from Figure 10, since K-means has FNs, the number of TP does not reach the expected value. In addition, K-means needs to complete the PCA dimension reduction and then the unsupervised clustering in Figure 11. Thus, the complexity is higher than threshold method. On the contrary, the threshold method has no FNs and FPs and has a better classification result.
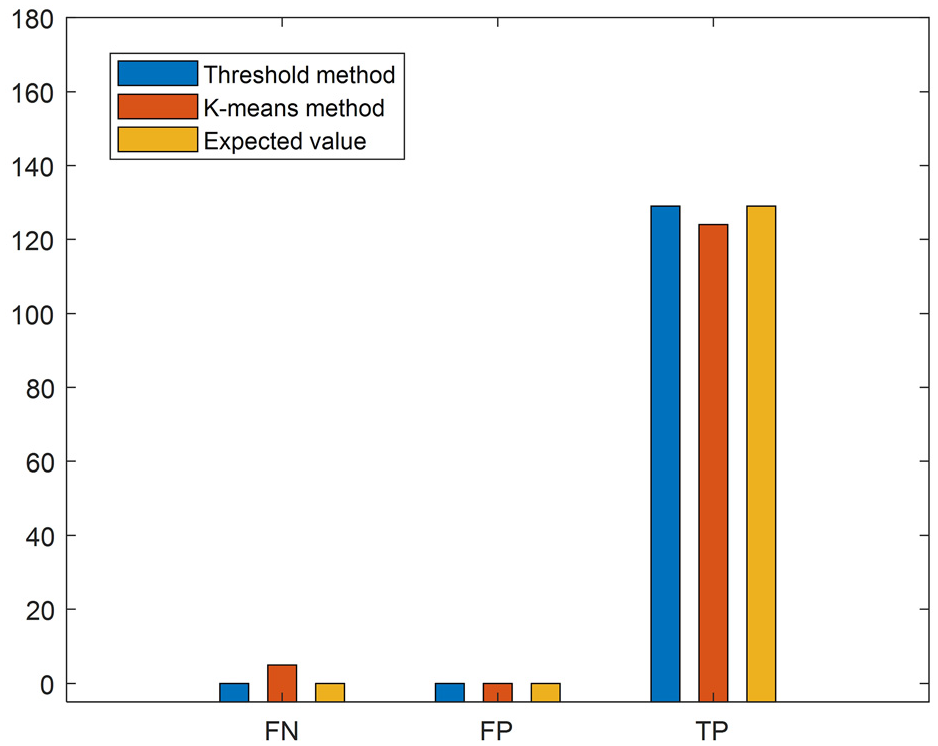
Results of different peak classification methods.

Peak signal waveform and clustering.
Comparison of NSPD and DSPD
Figure 12(a) and (b) shows the comparison results of NSPD and DSPD. It can be seen from Figure 12 that two algorithms can reduce FNs and FPs to 0 when the appropriate parameters are selected, for example, NSPD at

Comparison of NSPD and DSPD in detection results: (a) NSPD results under different
Effects of parameters on algorithm
In this sub-section, we will show the effects of the search window length

DSPD’s peak detection result when
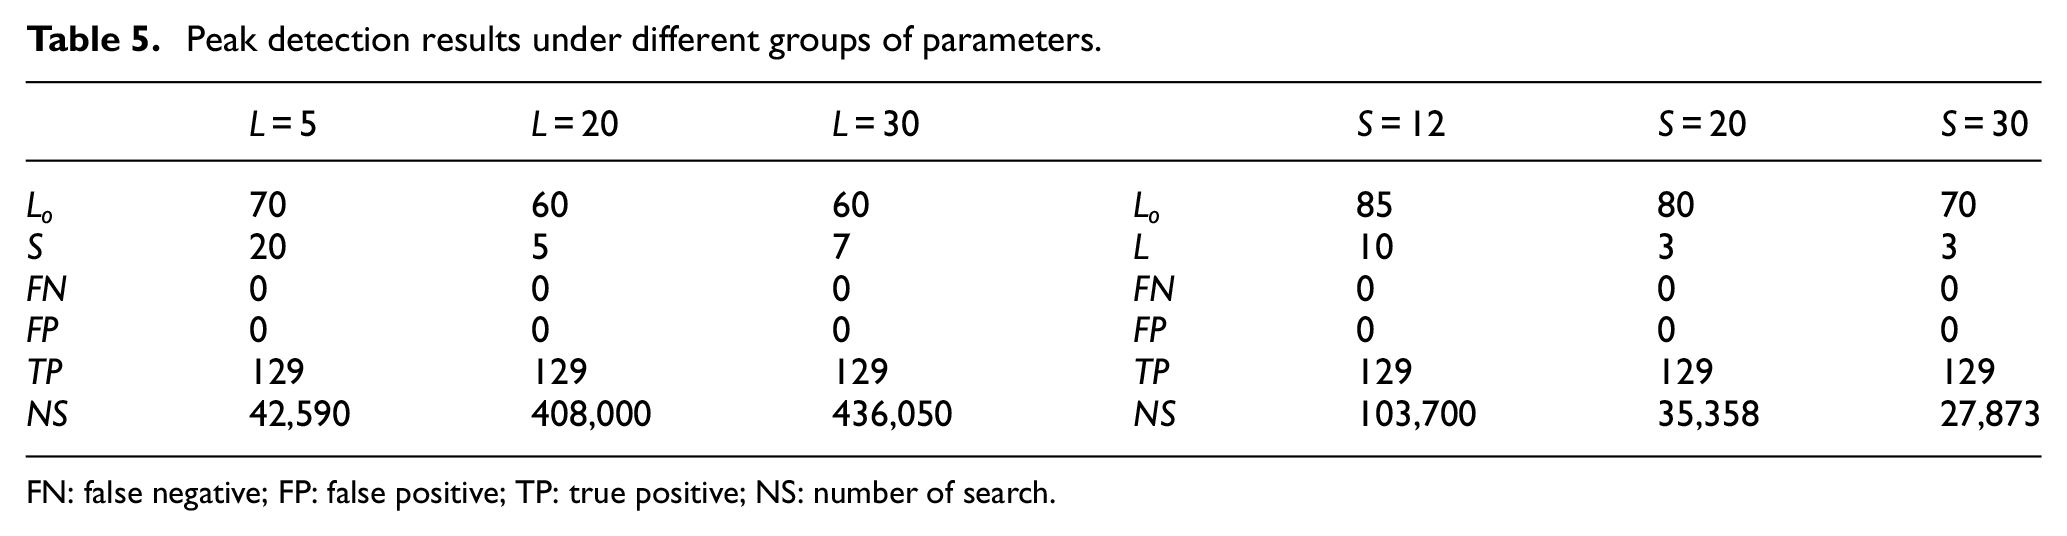
Figure 14 shows the results for DSPD at S = 12, 20, and 30 when

DSPD’s peak detection result when
DSPD’s peak detection result when
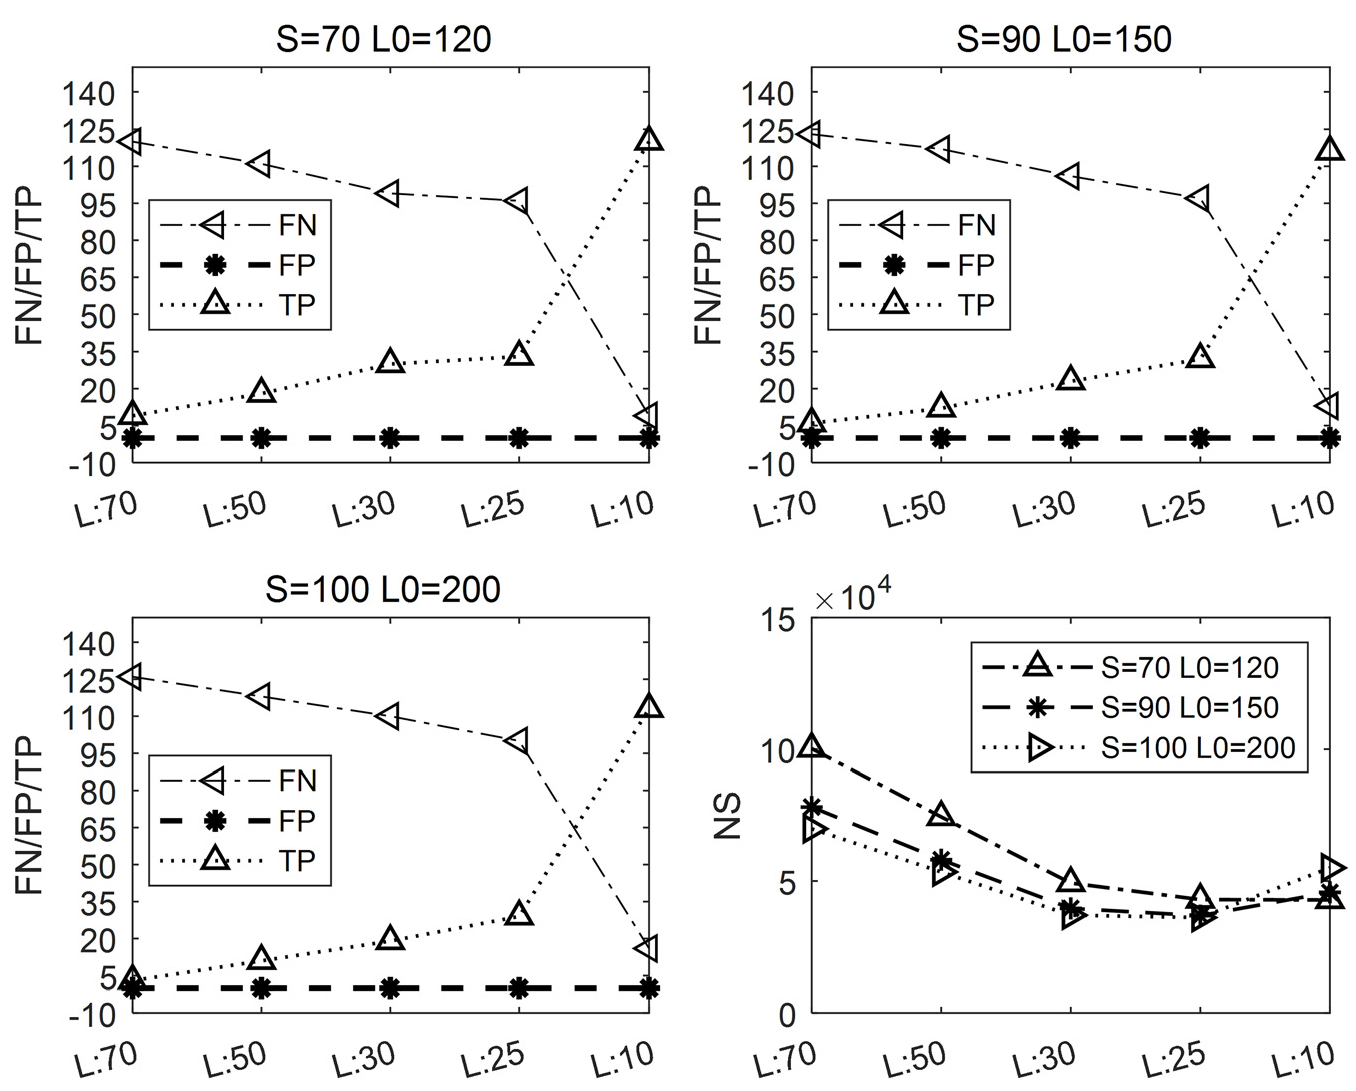
In addition, Figure 16 shows the results for DSPD with fixed
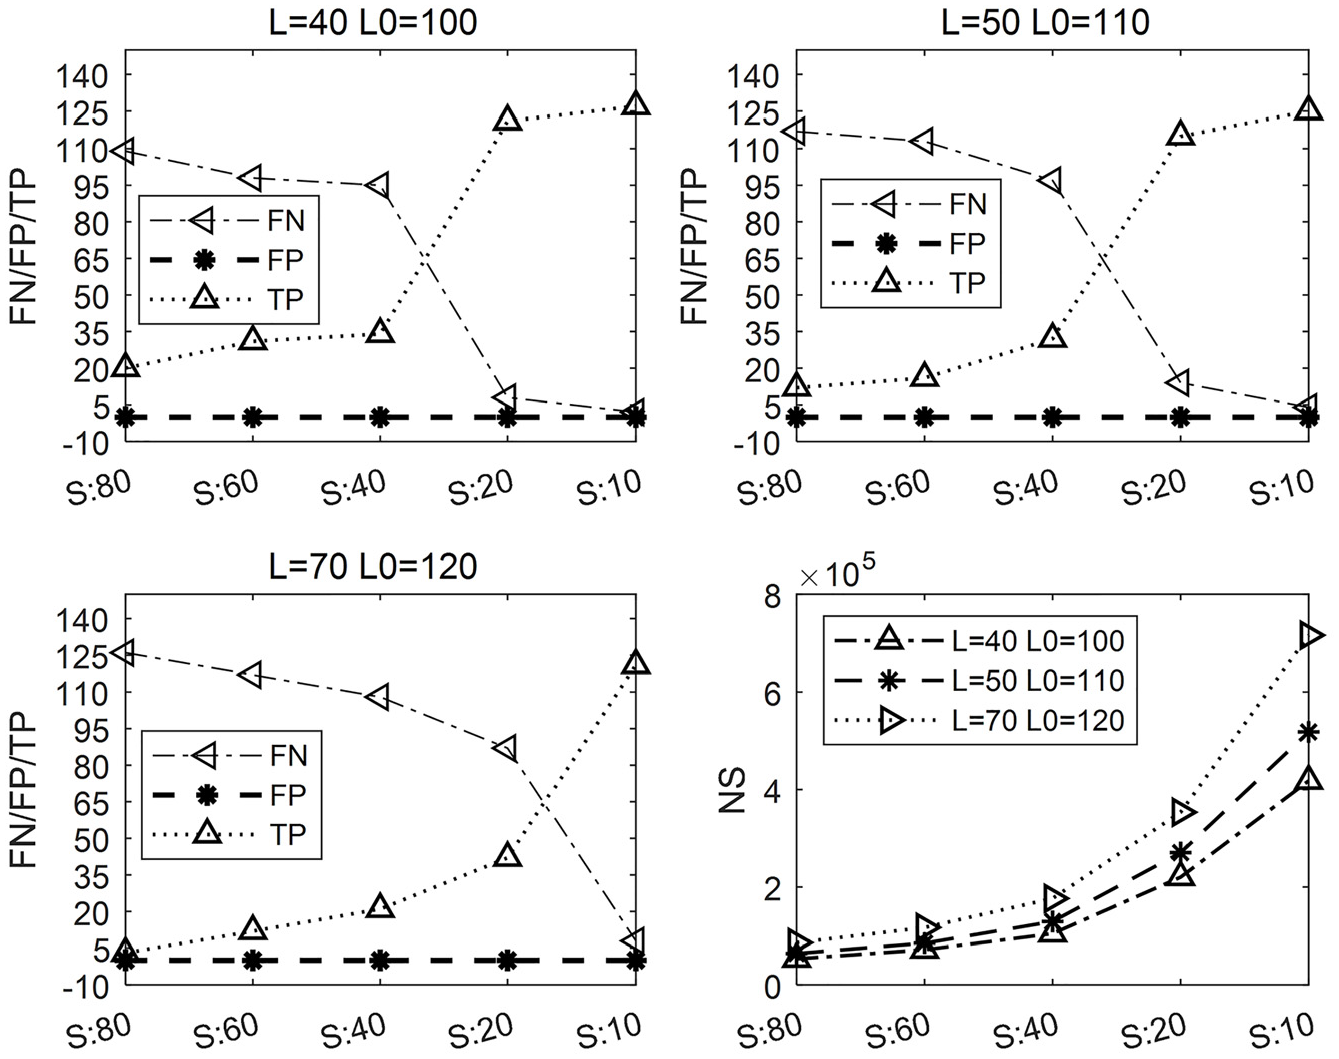
DSPD’s peak detection result when
Finally, it is seen from the results of Figures 13–16 that, on one hand, a smaller window length can reduce misses and ensure fewer searches. On the other hand, a too small window length may produce FPs. One available method is to choose a small length and a larger downsampling frequency to avoid FPs. Besides, when FPs and misses of DSPD are both 0, the values of parameters
Peak detection results under different groups of parameters.
FN: false negative; FP: false positive; TP: true positive; NS: number of search.
Maximum location error
In this sub-section, we give results for maximum positioning error in Table 6. The parameter selection is to ensure that the number of misses and the FPs is 0 in the final peak detection. From the results in the table, the location error of proposed algorithm does not exceed 1 cm. The location errors come from that a rail spike will correspond to multiple peaks in the magnetic signals, or a peak will degenerate into a straight line, as shown in Figure 4. However, the distance between the test track sleepers in this experiment is usually about 600 mm (depending on the number of sleepers laid per kilometer), so the location error of rail spike to the distance is only 1/60, which is less than 2%.
DSPD’s maximum positioning error.

DSPD: downsampling slide-window peak detection.
Discussions
From the magnetic sensing signals on a railway, this study studies a peak detection algorithm for locating rail spikes. Comparing with traditional schemes, we design an easier detection scheme, and determine an optimal parameter selection by analyzing and testing the relevant parameters of the algorithm. Although in the experiment, we made a detailed comparison of the algorithm’s scheme and parameters, and gave some experimental results, but there are some issues that need further discussion.
The first is the peak detection of fishplates. It can be seen from the magnetic sensor signals, when a fishplate is present, the peak signals of rail spike will be submerged and thus difficult to be detected. This study only discusses how to distinguish the peak signals of the fishplates and rail spikes, and does not discuss how to detect in this case. As mentioned above, the system will be a multi-sensor location system. When the magnetic sensing signal cannot locate rail spikes, it will be compensated by an image detection method. Since the image detection scheme will involve additional algorithms, this study will not introduce it too much.
The second is the location error. The location error given in the experiment is the distance between the peak detected by the algorithm and the actual peak on the magnetic signal, while the true positioning error should be the distance between the peaks detected by the algorithm and the actual rail spike positions. However, the latter depends not only on the performance of the peak detection algorithm, but also on the performance of the magnetic sensor itself. When the peaks of the magnetic sensor signal deviate from the positions of rail spike, it is difficult to locate them accurately even if the algorithm is accurate. Therefore, the selection of magnetic sensors is also a factor in determining the accuracy of rail spike location.
The third is the sliding length. From a search perspective, an increase in the sliding length will reduce the number of sliding windows and therefore reduces the NSs. But in turn, the increase can lead to more misses. In the experiment, we only considered the case where the sliding window length is 1, because the increase in downsampling frequency is actually equivalent to increasing the sliding window length. Thus, the other sliding length is not considered too much.
The last is about the misses. The misses may not be an important metric to consider, if we can use an image detection to compensate for the misses for rail spikes. Then, we can sacrifice the miss metric in exchange for other performances of the algorithm. From the experimental results, an increase in downsampling frequency can effectively reduce the NSs, although the large sampling frequency will produce some misses. This case will get a faster peak detection algorithm.
Conclusion
In this study, a peak detection algorithm for rail spikes location from magnetic sensing signals is proposed. In this algorithm, we compare the propose algorithm with various traditional algorithms and analyze the relevant parameters of the algorithm.
In the experiment, we used a group of magnetic sensing signals obtained on real rails to evaluate the algorithm. The experimental results show that the schemes of downsampling, sliding window peak detection, threshold classification, and second peak search have better detection performance. At the same time, in order to ensure that the algorithm does not appear FPs and misses, and reduce the computational complexity, the algorithm should also consider a smaller window length, a larger downsampling frequency, and a moderate secondary-search-window length. Finally, when the above three parameters are selected, 3, 30, and 70, misses and FPs are both 0, the NS is only 104 orders, and the maximum location error does not exceed 1 cm.
Footnotes
Handling Editor: Yanjun Huang
Author contributions
Meng Gao performed and completed the experiments. Haifeng Wu proposed the idea of algorithm and revised the article. Yong Shen provided the experimental data. Xia Wang provided a comparison algorithm. Yu Zeng devoted to the analysis of the algorithm feasibility.
Declaration of conflicting interests
The author(s) declared no potential conflicts of interest with respect to the research, authorship, and/or publication of this article.
Funding
The author(s) disclosed receipt of the following financial support for the research, authorship, and/or publication of this article: This research was funded by the National Natural Science Foundation of China under grant no. 61762093, the 17th Batch of Young and Middle-aged Leaders in Academic and Technical Reserved Talents Project of Yunnan Province under grant no. 2014HB019, Program for Innovative Research Team (in Science and Technology) in University of Yunnan Province, the Key Applied and Basic Research Foundation of Yunnan Province under grant no. 2018FA036, The Science Research Fund Graduate Program in Education Department of Yunnan Province under grant no. 2019Y0166, the Graduate Innovation Fund of Yunnan Minzu University under grant no. 2018YJCXS162, and The Scientific Research Project of Yunnan Minzu University in 2019: Research on the Location Method of Tamping in Tamping Vehicle Based on Multi-source Information Fusion.