
Abstract
Thousands of lives are lost in traffic accidents every year, and most traffic accidents are caused by driver errors. Causes and impairments such as fatigue, inattentiveness, alcohol usage, stress, and drugs are the main factors of these accidents. When a driver is subject to changing and complicated driving tasks in traffic, he or she should be able to assure driving authority to prevent potential hazards and accidents. In this context, the purpose of this study is to determine the stress level of the driver when driving in urban traffic in such situations requiring delegation of driving authority. Thus, the work combines stress questionnaire and galvanic skin response sensor to validate results and fuses with a force-sensing resistor. In this study, a prototype electric vehicle is equipped with sensors providing various drivers’ data including the responses of a force-sensing resistor sensor while galvanic skin is being collected on a specified route. At the end of the trip, the stress level of the drivers is determined by the collected data. Results indicate that the galvanic skin sensor stress results are consistent with the results of the survey with an average accuracy of 87.5%. The force-sensing resistor sensor is only used to determine gender stress. And the force-sensing resistor sensor gender-stress results are consistent with results of the survey with an accuracy of 100%. These results are used to validate the results of post-driving stress survey evaluated by SPSS 23.0 windows statistics software. Data analysis is particularly focused on demographic properties of participators, factor analysis, reliability tests, correlation, T-test, and one-way analysis of variance.
Keywords
Introduction
The global status report on road safety in 2015, reflecting information from 180 countries, indicates that 1.25 million people die worldwide each year due to traffic accidents. 1 According to the current data of the Turkish Statistical Institute, in the road network of Turkey, 1,229,364 traffic accidents occurred during the year 2018. Among all those 1,229,364 accidents resulted in collision damage, 186,532 resulted in human death or injury. Concerning these accidents involving death or injury, 75% of them occurred in an inhabited area and 25% occurred at an uninhabited area. As a result of 186,532 accidents involving death or injury occurred during the year 2018, 3368 people were killed at an accident scene and 3307 people were injured and transferred to health facilities, and then they died within 30 days because of accident-related health damage (reported road fatalities: 75.9% males and 24.1% females). Table 1 presents a summary of accident losses between 2008 and 2018. 2
Road traffic accident statistics 2008–2018 in Turkey. 2

Between 2008 and 2014, the number of people died due to accident-related injuries was not recorded and only the number of people died at accident scenes was given.
Considering 217,898 total faults causing accidents involving death or injury in Turkey during the year 2018, it was determined that 89.5% of faults were driver faults, 8.4% were pedestrian faults, 0.9% were passenger faults, 0.6% were road faults, and 0.6% were vehicle faults. 2 Overall, driver faults were the primary fault causing traffic accidents with a proportion of 89.5% in the report. These driver faults may be due to causes such as sleeplessness, inattentiveness, fatigue, alcohol use, impairment by drugs, and stress in an unexpected situation in traffic.
Stress is defined as a response to particular events, 3 the relationship between people and situation, 4 or attributed to events in the situation. 5 Traffic is a complex phenomenon exciting the unknown and sudden events for vehicle drivers. Therefore, the level in stress experienced by the drivers in traffic needs to be considered in order to reduce traffic accidents. In this respect, there are many studies examining driver stress in the literature. Numerous research efforts have been focused on personality while correlating drivers’ stress using a questionnaire. Correlations between personalities and driver stress are presented by Matthews et al. 6 and Dorn and Matthews. 7 Pattern recognition methods are applied to identify the features to detect stress in drivers derived from different physiological sensors such as electromyogram, electrocardiogram (ECG), respiration, galvanic skin response (GSR), or a camera.8,9 Westerman and Haigney 10 investigate driver stress and aberrant driver behavior using a questionnaire. Gulian et al. 11 develop the driver behavior inventory to study dimensions of driver stress. Hennessy and Wiesenthal 12 measure each driver’s predisposition to stress (trait stress) as well as their reactions to the experience of either low or high traffic congestion (state stress) through phone interview to discover stress and coping ability of the driver.
Stress is an important factor affecting driving performance. Although a moderate or low level of stress contributes to maintaining driver attention, 13 high-level stress affects driving performance such as impaired driving and may increase the possibility of accident involvement, 14 traffic violations. 15 Women may be more stressful than men while performing driving tasks, 16 and particularly, female drivers who have been involved in accidents with collision are more stressful than other female drivers. 17 Brewer 18 states that old drivers are usually less prone to exhibit aggressive driving behavior, and they have been associated with lower stress levels. 19 However, stress is not only related to human being driver characteristics but also to the driving environment. 20
In recent studies, DS Lee et al. 21 and BG Lee and Chung 22 develop and test a wearable glove system to detect driver stress using physiological signals and steering wheel motion analysis. And the driver stress is detected with a level in accuracy reaching 95%. Munla et al. 23 present a method to detect the stress level of drivers. This method is based on heart rate variability (HRV), which is derived from the ECG signal and it reflects autonomic nervous system state of the human body. Results indicate that stress detection can be predicted with an accuracy of 83%. El Haouij et al. 24 use electrodermal activity (EDA) to classify and recognize the stress level of drivers. Kim et al. 25 characterize driver stress using physiological (electroencephalogram (EEG) and eye-gazing) and data measured while driving an electric vehicle. The results of this study identify two groups of subjects: one group is not showing evidence of stress and the other group exhibits a certain level of stress. Among the subjects who perform sufficient driving stress, nine out of the top 10 high EEG-entropy drivers are female, one driver showed a strong pattern of range anxiety, and several showed patterns of uphill climbing anxiety.
According to the statistics above, the causes of accidents are mostly driver faults. Thus, this driver-related accident rate can be reduced by forestalling. The purpose of this study is to determine the relationship between driver and stress combining a survey method and sensor data outputs. Some of the previous studies on the relationship between driver and stress have been done by a survey method or with sensor measurements. Previous studies are also narrow-scope studies such as gender-stress, personality-stress. Beyond the state of the art, this study includes the experience of the driver including driving experience-stress, driving frequency-stress. In this work, we extract and analyze the stress level of the drivers according to their descriptive characteristics. The contributions of this study are summarized as follows:
Two different methods based on survey and experimental sensor data are proposed to determine the stress levels of the drivers. These two different methods improve the reliability and consistency of the stress level analysis with respect to previous studies.
A sensor data acquisition prototype system was deployed for measurement purposes. Although the GSR sensor data and force-sensing resistor (FSR) data are mainly used, other sensor data may be evaluated to determine and compare the stress level of drivers.
This study contributes to the extraction of the stress levels of the drivers. Since most of the traffic accidents are human-centered when the stress level is determined, it is possible to mitigate possible traffic accidents by improving educative feedbacks and driving skills of the drivers subject to the high level of stress.
The rest of this article is organized as follows: section “Research methodology” presents the research methodology and elaborates the sampling procedure, research design, data collection instruments, and data collection set-up. Section “Results” presents the results of stress level determination. The results obtained by surveys, the responses of galvanic skin sensor, and FSR are elaborated. Finally, section “Conclusion and future work” gives some conclusions and discusses further work.
Research methodology
This study extracts the stress level of drivers while combining a questionnaire survey along with experimental sensor data. The survey aims to extract driving stress by asking questions to the driver about the hypothetical situation. However, the sensors aim to collect the data of the drivers and determine the stress of the drivers during the trip. Thus, the opportunity to examine driver stress by different methods is obtained. At that point, the importance of the study is that the stress level of drivers is determined in order to contribute to the enhancement of driver’s authority. The phases of this study are given in Figure 1 and the methodological part consists of four tasks: the sampling procedure, research design, data collection instruments, and data collection set-up.
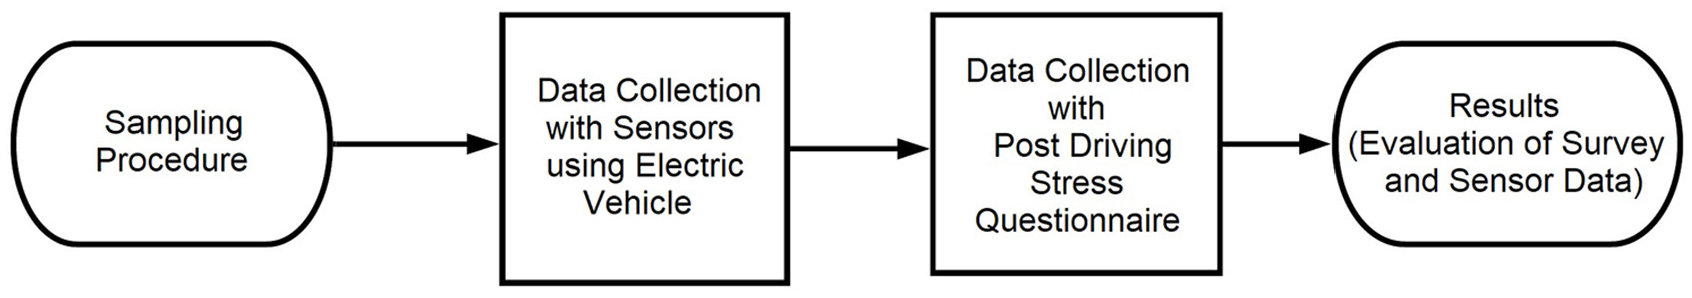
The main blocks of the presented methodology.
Sampling procedure
In this study, convenience sampling, which is a part of non-probability sampling, is used and applied among the test drivers. Convenience sampling is used in exploratory research where the researchers are interested in getting an inexpensive approximation of the truth. This non-probability method is often used during preliminary research phases in order to predict a gross estimate of the results, without incurring the cost or time required to select a random sample. The sample driver group for the study will consist of 38 random selected drivers.
Research design
The descriptive research method is validated by experimental sensor data. Combined method (descriptive and experimental) is implemented to determine the stress level of drivers using 38 (19 male drivers and 19 female drivers) participants. The design of the study is correlational in order to understand the relations between key concepts.
Data collection instrument
Data collection instruments consist of three parts. The first part is the questionnaire and other parts are GSR sensor and FSR which are used to measure driver stress.
Questionnaire is constituted by two sections: 26 the first section includes general demographic information about the participant drivers (9 questions) and the second section includes the stress attributes of drivers (38 questions are given in Appendix 1).
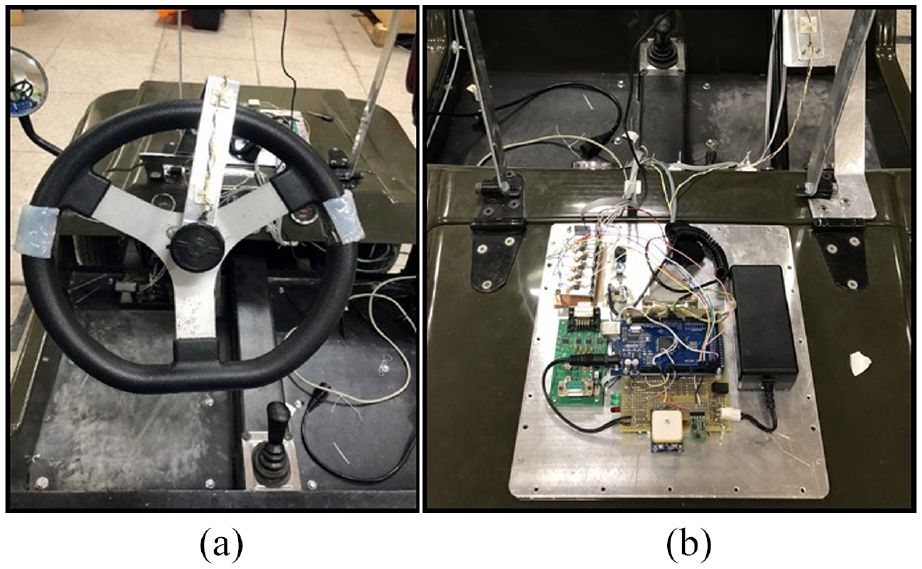
The second part uses the GSR sensor as shown in Figure 2(a). However, GSR sensor measures the electrical conductivity of the skin attaching two electrodes to two fingers. Thus, GSR allows spotting strong emotions because electrical conductivity changes when moisture level changes in the skin and sweat glands are more active. To capture this phenomenon, the GSR sensor is used to detect the different electrical conductance of the skin when a person is under stress or not.

Sensors: (a) galvanic skin response sensor and (b) force-sensing resistor.
The third part uses the FSR as shown in Figure 2(b). FSR sensor decreases its resistance in correspondence with the increase in the force applied to the measurement area. Hence, pressure or force on the active area can be detected. In our application, FSR is used to detect steering wheel grip forces of drivers. Thus, the grip forces of the drivers will be compared to interpret the stress level of each driver.
Data collection set-up
Data collection set-up consists of a prototype electric vehicle equipped with sensors as shown in Figures 3 and 4, a pre-specified route, and a post-ride questionnaire survey. Overall, by following the survey responses, 81.6% of test drivers agreed that the driving was as usual and normal with respect to their daily commuting.

Data collection set-up components.
Data collection set-up: (a) force-sensing resistors on the wheel and (b) galvanic skin response sensor.
The sensors mounted on the vehicle can capture driver behaviors and environmental conditions at the same time. For example, the bidirectional camera detects both the driver’s face and the environment. Laser imaging detection and ranging (LIDAR) detects objects and distances in the vicinity of the vehicle. FSRs determine how the driver keeps the steering wheel and when and how much braking he or she does apply. Encoder, potentiometer, the inertial measurement unit (IMU), current sensor sense vehicle motion, and the global positioning system (GPS) receiver measures position, velocity, and time. GSR sensor detects the different electrical conductance of the skin when a person is under stress or not. FSR detects steering wheel grip forces of drivers.
GSR sensor and FSR data are used along with the results of questionnaire surveys. Since this study is particularly focused on discovering correlations of the stress level of drivers, these two on-board sensors are used to extract information about stress level of each driver during the trip.
After the data collection set-up was created, a route was determined for driving. This route is located on the campus of Istanbul Technical University as highlighted in Figure 5. The black dot represents the starting point and the red line represents the path. The route is 1.5 km and the data were collected in the afternoon. The route passes through the center of the campus traversed by a high number of students and vehicles.
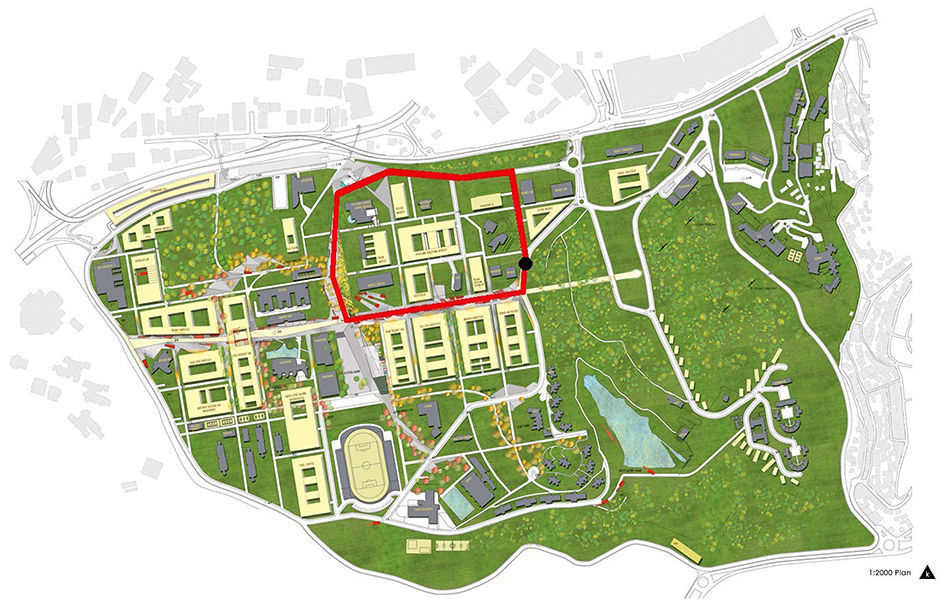
Driving route in the study. 27
Results
Questionnaire
The questionnaire consists of two sections: descriptive questions and stress questions. Questionnaire answers are used for quantitative analysis using the SPSS 23.0 software package for Windows.
Descriptive statistics
Descriptive statistics define the profiles of participants. Questions of descriptive section ask the drivers: age, gender, education level, driving experience, driving frequency, driving accident, vehicle comfort level, route comfort level, normal driving behavior level. Thus, profiles of the drivers who participated in the questionnaire are categorized in Table 2.
Profile of drivers in the study.

According to descriptive statistics, most of the participants are in the age range of 20–25 years (52.6%). Nineteen participant drivers are women and 19 participants are men. In total, 65.8% of the drivers have a high school degree, 26.3% of drivers have a bachelor’s degree, and 7.9% have a master’s degree. Most of the participants did not involve in an accident and they drive on a daily or a weekly basis. More than 50% of surveyed drivers stated that they were very comfortable with the route and the test car and also they stated that test drive reflects their normal behavior.
Factor and reliability analysis
Factor analysis is used to describe variability among observed and correlated variables. Factor analysis provides data reduction to identify a small number of factors that explain most of the variance among variables. Factor analysis usually proceeds in four steps, as follows:
First step is the correlation matrix: It is computed to observe the correlation of variables. Correlation level is important because if the correlation between variables is low, it is unlikely that they share common factors. Bartlett’s test is used to test the hypothesis of the correlation matrix. The Kaiser–Meyer–Olkin (KMO) measure of sampling adequacy is an index for comparing the magnitude of the observed correlation coefficients to the magnitude of the partial correlation coefficients. The closer the KMO measure to 1 indicates sizable sampling adequacy (0.8 and higher are great, 0.7 is acceptable, 0.6 is mediocre, less than 0.5 is unacceptable).
Second step is factor extraction: It estimates initial factors obtained using principal component analysis that forms a linear combination of observed variables.
Third step is factor rotation: Varimax rotation is used. Varimax uses orthogonal rotations yielding uncorrelated factors.
Fourth step is to make final decisions.
The principal components method is used to find sub-dimensions of the dataset in factor analysis, varimax rotation method is used, and the factor number is defined depending on eigenvalues (eigenvalue > 1). Thus, first, it is decided about the appropriateness of dataset using KMO values; then, relationships between variables are determined using Bartlett’s test.
Only statistically significant factor loadings are taken into account. This level is defined over 0.6 for significant factor loading and the minimum value for alpha reliability test is considered to be 0.6. As a result of the factor analysis of 38 questions, 24 questions remain with KMO value of 0.687 at the end of 13 iterations. These test results are given in Table 3.
KMO and Bartlett’s test.

KMO: Kaiser–Meyer–Olkin.
These 24 questions are categorized into six groups of stress questions as presented in Figure 6.
First group questions: 12: Driving when it is difficult to see the road and the surroundings due to the direct sunlight during sunset or sunrise. 22: Driving on a road whose pattern/shape changes frequently. For example, a road that is a mixture of straight, turns, merging, and splitting, such as highways in big cities. 25: In traffic jam, driving with frequent breaking and accelerating. 29: Driving when you are not comfortable with how the control of pedal feels, such as accelerating and breaking. 30: Driving when you are not comfortable with the positions of seat, wheel, or pedal. 31: Driving when you are not used to the dimensions of the vehicle (e.g. driving a large SUV in a city for the first time.)
Second group questions: 16: Driving for a long time without getting out of the vehicle often. 17: Driving when you are not sure of where you are driving due to the reasons such as you are not familiar with the roads in the area. 20: Driving in a seat whose shape does not fit your body. 27: Driving when the road signs to the destination are difficult to interpret. 28: Driving when the air in the vehicle is not clean due to dust, exhaust, and so on.
Third group questions: 8: Driving when it is too cold, such as when the air conditioning is too strong in the summer, or it takes time before the car starts warming up in the winter. 9: Driving on a mountain road or wilding road, which requires more attention to steering and acceleration. 10: Driving in a seat that is soft (too flexible) and does not fit with your body. 19: Driving with careful steering on narrow roads continuously. 24: Driving when you feel sick (illness such as cold or headache).
Fourth group questions: 2: Driving at night where brightness changes because of a varying number of street lights. 4: Driving late at night. 26: Driving drowsy due to a lack of rest.
Fifth group questions: 33: Driving when you are carrying items that are fragile, unstable, or expensive which requires extra care. 34: Driving after psychologically stressful work.
Sixth group questions: 3: Driving while feeling upset due to reasons that are not related to driving. 5: Driving in a traffic jam where there is no way out. 15: Driving at a speed slower than what you would like such as the speed limit being too low for you.

Six question groups after factor analysis.
For the above survey questions, the answers required to be selected are as follows:
1: I will drive normally.
2: I will drive carefully, but it is not stressful for me.
3: I would feel a little stressed to drive under this condition.
4: I would feel nervous and stressed; it would be a lot of stress for me.
5: It is too stressful. I would not want to drive under this condition.
Reliability analysis measures the overall consistency of the items that are used to define a scale. Thus, factor and reliability analysis is applied to get answers to be used in the questionnaire. According to the reliability analysis, as shown in Table 4, the sixth group was excluded from the list because the alpha value of the sixth group was less than 0.6 and even if the question was deleted, it was not higher than 0.6.
Reliability statistics.

In general terms, Group 1 questions represent the stress level of driving on an unknown road with varying speeds. Group 2 questions represent the stress level of the long drive and driving disturbance. Group 3 questions represent the stress level of driving on a road that requires attention and uncomfortable driving status. Group 4 questions represent the stress level of sleepy driving and driving with a negative environmental light factor. Group 5 questions represent the stress level of fragile goods transport and driving after stressful work. Group 6 questions represent the stress level of driving at a lower speed with respect to the legal speed.
Correlation
Correlation is a statistical technique that can show whether and how strongly pairs of variables are related. Thus, correlations between stress and variables are needed to determine relations exactly. Table 5 shows the correlation between stress questions that are obtained as outputs of reliability analysis and descriptive questions.
Correlation results.

5% significance level.
1% significance level.
Correlation analysis results are clearly summarized and expressed in Tables 5 and 6. In Table 6, the first column presents correlative pairs, the second column is correlation type, and the third column is the definition of correlation.
Correlation analysis results.

T-test
The T-test is used in cases where the variables are not quantitative or qualitative. These variables do not reflect superiority versus each other when subject to gender difference. Hence, meaningful differences between stress level and gender are searched using the T-test. The T-test was applied to find a meaningful difference between the stress groups and gender separately. According to the results of the T-test given in Tables 7 and 8, a significant difference was discovered between stress_group_1 and gender, and also between stress_group_3 and gender. This means that stress levels of male and female drivers can be compared separately according to stress_group_1 and stress_group_3 questions.
Stress_group_1 and gender T-test.

Stress_group_3 and gender T-test.

According to T-test results in Table 7, there is a meaningful difference between stress level (stress_group_1) and gender. Participant women are more stressful than men. According to T-test results in Table 8, there is a meaningful difference between stress level and gender. In this experimental evaluation, participant women are more stressful than men.
Analysis of variance
The relationship between the stress groups and descriptive variables except gender is investigated using one-way analysis of variance (ANOVA). First, this significant difference was detected between driving experience and stress groups as shown in Table 9.
Stress level and driving experience (ANOVA).

After finding significant differences, the average values of stress levels are calculated according to the driving experience as shown in Table 10. Thus, the stress levels of the drivers can be sorted according to the driving experience.
Stress level and driving experience (ANOVA) means.

According to ANOVA results in Table 10, there is a meaningful difference between stress level (stress_group_1, stress_group_5) and driving experience. Drivers with less than 2 years of experience are the most stressful drivers. Drivers with 10–15 years of experience are the least stressful drivers. Second, this significant difference was detected between the driving frequency and stress groups as shown in Table 11. The stress levels of the drivers are sorted according to the driving frequency as shown in Table 12.
Stress level and driving frequency (ANOVA).

Stress level and driving frequency (ANOVA) means.

According to ANOVA results in Table 12, there is a meaningful difference between stress level (stress_group_1) and driving frequency. Participants who drive once a year are the most stressful drivers. Participants used to drive daily are the least stressful drivers.
According to ANOVA results in Table 12, there is a meaningful difference between stress level (stress_group_2) and driving frequency. On the contrary, participants who drive once a week are the most stressful drivers.
Third, this significant difference was found between the representative of normal driver behavior and stress_group_1 as shown in Table 13. In this experiment, normal driver behavior is considered to be a possible change between driving on the experimental electric vehicle versus the used driver behavior on his or her owned car. Then, the stress level of the drivers can be sorted according to the representative of normal driver behavior as shown in Table 14.
Stress level and representative of normal driver behavior (ANOVA).

Stress level and representative of normal driver behavior (ANOVA) means.

According to ANOVA results in Table 14, there is a meaningful difference between stress level (stress_group_1) and representative of normal driver behavior. Participants who stated that driving represents very little change from their normal driver behavior are the most stressful drivers. Participants who stated that driving does not highly represent their normal driver behavior are the least stressful drivers.
GSR sensor
GSR sensor is used to compare stress levels of variables. Standard deviation values rather than mean values can be used to compare the level in stress because the excess of the standard deviation value gives information about the intensity of the emotional state such as stress. For this reason, standard deviation values and mean values are obtained using MATLAB software. Table 15 gives the mean and standard deviations of the variables, and the stress levels can be compared. The GSR sensor measurement is given through the serial port between 0 and 1023.
Means and standard deviations of galvanic skin response sensor data.
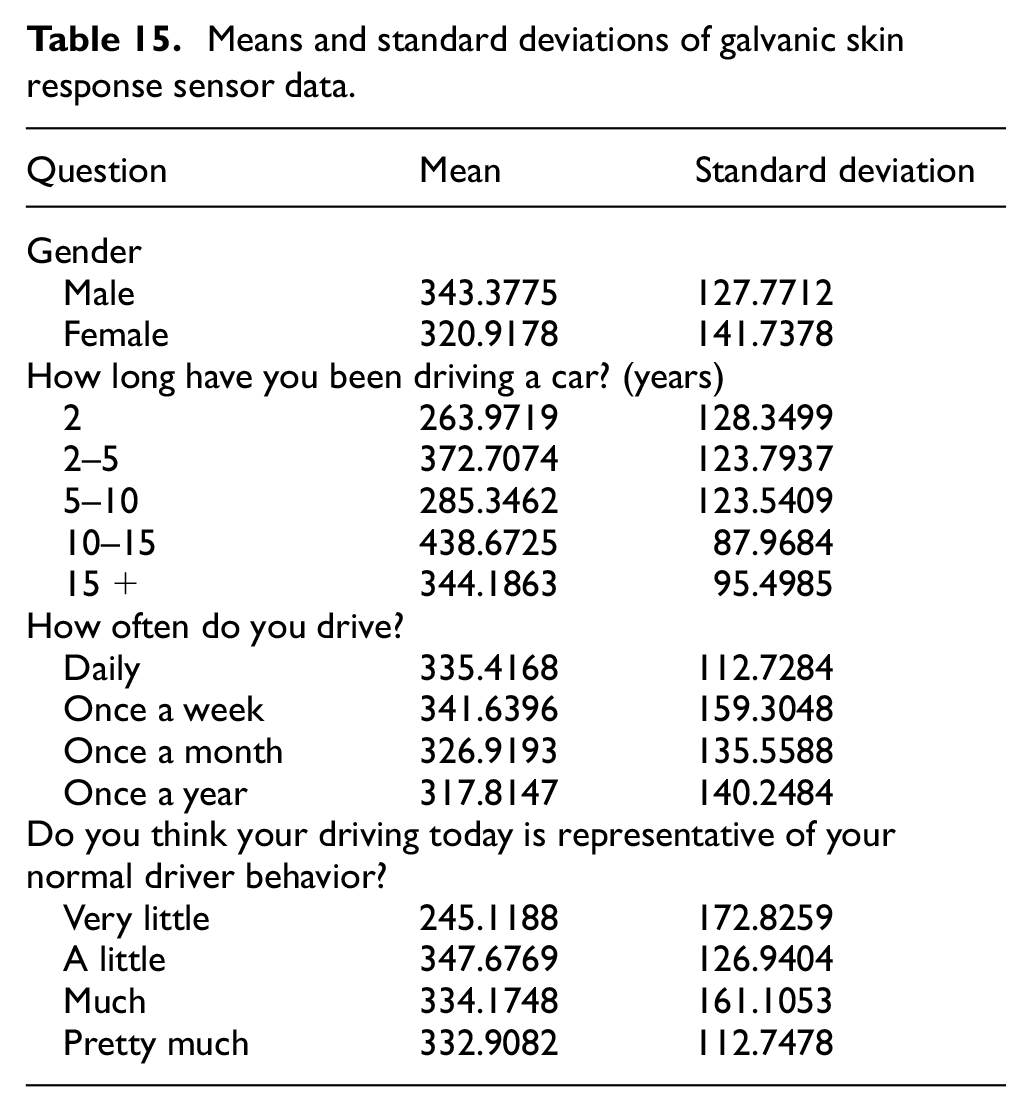
According to the standard deviations in Table 15, women participants are more stressful than men participants. This observation is fully (100%) consistent with the T-test results obtained from the survey.
According to the standard deviations in Table 15, drivers with less than 2 years of driving experience are the most stressful drivers. They are followed by drivers having driving experience between 2 and 5, 5 and 10, 10 and 15, and 15 or more, respectively. This finding is also fully consistent with stress_group_5 and driving experience results obtained from the survey.
According to the standard deviations in Table 15, drivers who drive once a week are the most stressful drivers. These drivers are followed by the drivers who drive once a year, once a month, and daily. This is 100% consistent with stress_group_2 and driving frequency results obtained from the survey.
According to the standard deviations in Table 15, participants who state that driving represents very little change of their normal driver behavior are the most stressful drivers. According to the survey results, the results are very little, much, pretty much, and a little, respectively. And these drivers, who state that driving represents very little change of their normal driver behavior, are followed by the drivers, who state that much, a little, and pretty much, respectively. This observation based on GSR measurement is 50% consistent with results obtained from the survey, which means a change in the response list quantized as very little, a little, much, pretty much. In this case, pretty much and a little is changed their order according to Table 14 giving defining the order of stress_group_1 and representative of normal driver behavior.
FSR
FSR is used to obtain mean values and standard deviations of steering wheel grip force measurements, as shown in Table 16. It is not straight-forward like a GSR sensor to establish a relationship between the FSR data and the level in stress, because a relationship between the FSR and stress cannot be established directly. For this reason, the FSR sensor is used to measure the force applied by the female and male driver participants to grip the steering wheel. And a connection is sought to be established between stress and gender. The FSR sensor measures force in the range of 0.2–20 N.
Means and standard deviations of force-sensing resistor data.

The mean values and the standard deviations of the data measured from the four FSRs mounted on the steering wheel were calculated according to gender using MATLAB software. The grip forces mean value of female drivers was 0.8829 and the grip forces mean value of male drivers was 1.0244. According to these results, the difference in mean values obtained from the FSRs can be interpreted as the difference in stress level, because the drivers who have the same level in experience exist in both gender groups.
Following the study of Massy-Westropp et al., 28 mean values of hands’ grip force are analyzed and males hold about 1.6 times stronger than women. In our tests, the ratio of the mean force value obtained from the force sensor is 1.16, which is the result of 1.0244/0.8829. Benchmarking with the ratio in Massy-Westropp et al., 28 we observe that test drive participating women hold the steering wheel tighter than other men participants. Moreover, according to the standard deviation values, female drivers hold the steering wheel subject to drastic force change than male drivers. This FSR measurement-based statistical analysis shows that test drive participating women are more stressful than other participating men drivers.
But FSR can only identify gender but not the driving experience, driving frequency such as daily, weekly, monthly, and difference from normal driver behavior. It is not possible to say that these differences are directly caused by stress. For example, according to the driving experience, the grip strength mean value has been higher for drivers having more than 15 years of driving experience. The second highest value was with drivers having less than 2 years of driving experience. The stress of drivers with more than 2 or 15 years of experience may not be correlated because the steering should be held with a particular amount of force for precaution purposes. In this context, comparing stress is not very likely correlated with gender data.
Causes of instantaneous driver excitement
Driver excitements were determined using synchronous bidirectional dash cam data as shown in Table 17. The main causes are extracted from the driver’s face looking camera by an expert in Table 17 as listed in the following:
Speaking: loss of attention to the driving scene because of speaking with the passenger for a short period of time such as 5 s.
Acceleration: speeding up unintentionally caused by the disturbing effect of downhill driving for the duration of 6 s.
Noise from the vehicle: perturbation caused by the internal noise generated by the prototype electric machine of the vehicle for the duration of 1 s.
Gaze direction and loss of attention: the driver’s unintentional habit of following objects on the road scene such as pedestrians and other objects, causing distractibility and increment in stress level for the duration of 3 s.
Surrounding vehicles in the traffic scene: loss of attention and perturbation due to oncoming and passing vehicles in a single-lane road in both directions for the duration of 5 s.
Curvature on the oncoming road: failure to follow navigation directions and executing turn on an approaching curvature on short notice for the duration of 2 s.
Bump: perturbation effect of passing a bump mounted on a road to reduce the speed of the vehicles on a university campus for the duration of 2 s.
Pothole: perturbation effect of passing over a pot on a road for the duration of 2 s.
Distraction effect of passing cars when the car is parked: the perturbation of other passing cars after parking the car for the duration of 6 s.
Uneasiness: the state of being nervous or restless during the driving for the duration of 10 s.
Excitement (stress) data number, time, and causes.

Case study: instantaneous excitement changes of the drivers according to the GSR sensor and instantaneous hand force changes of the drivers according to the FSR sensor
The excitement and stress experienced by the drivers in traffic actually reflect an instant situation. For this reason, instant excitement states and instantaneous force changes of drivers are examined. The GSR and FSR sensors data are plotted using MATLAB in Figure 7. In Figure 7, female drivers are labeled by (F) on the titles and males drivers are denoted by (M). The GSR sensor outputs are scaled by 200 to visualize instantaneous excitement variations and hand force changes simultaneously.

Instantaneous excitement (blue) and hand force changes (yellow and red) of the drivers.
Although the FSR sensor in Figure 7 provides the observation of force changes on the steering wheel, the instantaneous excitement information is not sensed by the FSR sensor. However, the FSR sensor plots can give information about steering wheel grip force level of the drivers. Thus, the tighter grip of the steering wheel points out uneasiness and stress. For example, driver15 (F) grips the steering wheel with her two hands during the all route tightly. However, the GSR sensor gives instantaneous information about the intensity of the emotional state. The peak points indicate instantaneous stress in the GSR sensor plots in Figure 7. Thus, according to the instantaneous changes of GSR sensor excitement in Figure 7, driver10 (F), driver11 (M), driver12 (M), driver14 (M), driver18 (F), driver25 (M), driver26 (M), driver28 (M), driver29 (M), and driver33 (F) are not excited during driving. Other drivers have been excited and stressed during driving from time to time.
Conclusion and future work
In this study, the relationship between the stress level of the drivers and their descriptive features is presented. The proposed concept of study consists of post-drive stress survey, GSR sensor data, and FSR sensor data to determine the stress level of drivers. The prototype electric car is equipped with sensors to collect data on the specified route. Data were collected from the GSR sensor and FSR to extract information about the stress level of the drivers. The GSR sensor data were used to determine whether the post-driving stress survey results were consistent. Thus, two different methods were used to verify the same study. The FSR sensor data were used to determine whether the post-driving gender-stress survey and GSR sensor gender results were consistent. Thus, gender-stress results are verified.
According to the results of the survey, it was concluded that women are more stressful than men in two different stress group questions. Due to the high standard deviation values, the results of the GSR sensor showed that women were more stressful than men, and this is also justified by the survey responses. Due to the high mean values relatively, the results of the FSR showed that women were more stressful than men as in the survey.
Considering the first stress group questions and the fifth stress group questions, drivers with less than 2 years of experience are the most stressful drivers, and drivers with 10–15 years of experience are the least stressful drivers. The results of the GSR sensor are consistent with the fifth stress group questions and driving experience results exactly.
The results of the first stress group questions show that participants who drive once a year are the most stressful drivers and participants who drive daily are the least stressful drivers. Participants who drive once a week are the most stressful drivers. And participants who drive daily are the least stressful drivers. The results of the GSR sensor are consistent with the second stress group questions and driving frequency results. Participants who state that this test drive represents very little deviation from their normal driver behavior are the most stressful drivers and participants who state that test drive represents little deviation from their normal driver behavior are the least stressful drivers. According to the data measured by the GSR sensor, pretty much and a little, which are the least stress answers, are displaced in the survey results.
In this study, the GSR sensor is used for stress-gender, stress-driving experience, stress-driving frequency, and stress-representative of normal driving behavior analysis, and the FSR sensor is used to determine gender stress. Thus, the GSR and FSR sensor’s stress-gender results are consistent with the results of the survey with an accuracy of 100%. The GSR sensor stress-driving experience results are consistent with the results of the survey with an accuracy of 100%. The GSR sensor stress-driving frequency results are consistent with the results of the survey with an accuracy of 100%. The GSR sensor stress-representative of normal driving behavior results is consistent with the results of the survey with an accuracy of 50%. As a result, the GSR sensor stress results are consistent with the results of the survey with a total accuracy of 87.5%. The FSR sensor gender-stress results are consistent with the results of the survey with an accuracy of 100%.
These highly consistent survey, GSR sensor data, and FSR data results are crucial at categorizing the driver’s stress level. The least and most stressed groups were identified and stress-related traffic accidents could be prevented by education or treatment. Thus, the stress factor in driver-related road accidents can be minimized using study results.
The usage of other sensor data from drivers to determine the level of stress is underway. These data can be the driver sound and face image data provided by on-board camera. Different sensors will be used to determine the stress level of drivers, and the results obtained will be validated in various ways.
Footnotes
Appendix 1
Handling Editor: James Baldwin
Declaration of conflicting interests
The author(s) declared no potential conflicts of interest with respect to the research, authorship, and/or publication of this article.
Funding
The author(s) received no financial support for the research, authorship, and/or publication of this article.