
Abstract
An automatic tensioner that consists of a torsional spring and friction damping elements is widely used in belt drive system. The relation of the applied torque versus the imposed angle of tensioner during loading and unloading processes is described as a hysteretic loop. An analytical model is established for estimating the hysteretic behavior of a tensioner, and measurements for hysteretic loop in quasi-static and dynamic excitation are carried out to validate the analytical model. Taking one engine timing belt drive system as a studying example, the method and the procedure for estimating vibration responses of the nonlinear tensioner are given. An iterative algorithm for predicting the accurate equivalent viscous damping of tensioner is carried out in analyzing a belt drive system. The vibration responses of tensioner are validated by the measurement of timing belt drive system. The developed method presented in this article is useful for predicting the hysteretic behavior of tensioner, vibration responses, and the parameters optimization of a belt drive system.
Keywords
Introduction
An automatic tensioner is widely used in a belt drive system, such as timing belt drive system (TBDS). A typical TBDS consists of a driving pulley, a teeth belt, an automatic tensioner, and several accessories pulleys, such as pulleys of camshaft, idle, oil pump, and so on. The tensioner is an important component of TBDS for maintaining belt tension constantly, avoiding the jumping in meshed belt teeth and improving the belt service life by reducing vibration.1–4
Generally, a typical tensioner is mainly composed of a torsional spring, friction elements, and an eccentric tensioner arm. 5 The spring functions as an energy storage element for tensioning the belt, and the damping element is used for reducing and absorbing the vibration of the belt. 6 Owing to the friction damping, the tensioner arm behaves a stick–slip motion, and relation of the applied torque and the imposed angle is a hysteretic loop during loading and unloading processes. 5 The nonlinear behavior (hysteresis) of tensioner has an evident impact on the capacity of applied load, the dynamic performance and the working life of a belt drive system.6–8
Now some researchers focused on the model of the dynamic characteristics for tensioner hysteresis, and the identification of model parameters of tensioner. Zhao et al. 9 developed a mathematical model to describe the hysteretic behavior of a spring-load tensioner. The model was validated and model parameters were identified under different excitations. Bastien et al. 10 proposed a modified Dahl and a Masing model to describe the hysteretic behavior of a tensioner. The tensioner was modeled as a torsional spring stiffness, an equivalent friction stiffness, and an equivalent viscous damping. Michon et al. 11 presented a general hysteretic model to describe the dynamic behavior of the tensioner. A polynomial expression was used for approximating the hysteresis loop. Chatelet et al. 12 presented a method to choose the most appropriate contact model of tensioner in predicting hysteretic behavior. The nonlinear forces transmitted along contact surfaces should be described as accurately as possible. Zhu et al. 5 put forward an analytical model and a three-dimensional (3D) finite element model to investigate the hysteretic characteristics of a tensioner. An experimental device was developed to obtain the friction coefficients of contact pairs and the working torque performance of a tensioner.
Other researchers have studied on the application of tensioner in analyzing dynamic responses of belt drive systems. A rotational vibration model for a belt drive system was established by Hwang et al. 13 The tensioner was modeled as a linear spring and an equivalent viscous damping. The oscillation angle of tensioner arm and the fluctuation of belt tension are predicted. Kraver et al. 14 presented a tensioner model with a coulomb damping and a viscous damping. The frequency characteristics of tensioner arm oscillation in a belt drive system were analyzed. Cheng and Zu 15 investigated the influences of a tensioner with dry friction on dynamic characteristics in a serpentine belt drive system. Two kinds of period responses of nonstick and stick–slip motions for tensioner arm were obtained. Shangguan and Zeng 16 and Feng et al. 17 investigated the stick–slip motion of tensioner arm in a belt drive system, and analyzed the influence of tensioner parameters on dynamic performance of system. Farong and Parker 18 investigated the influence of dry friction of tensioner on dynamic performance in a belt-pulley system, and discussed the energy dissipation caused by the hysteretic behavior of tensioner and the stick–slip phenomena of tensioner arm.
In the previous studies,5–18 the research works are focused on the parameters identification and the physical model of tensioner. The analytical model stated in Zhu et al. 5 is suitable for a specific form, and the method for obtaining the hysteretic behavior of tensioner in a dynamic manner is not given. On the other side, the tensioner is simplified as a linear torsional spring and an equivalent viscous damping in the dynamic analysis of a belt drive system.13–18 The equivalent viscous damping of tensioner is an approximation value in analysis, which can only be obtained by a known vibration amplitude and frequency of tensioner arm.15,16 Thus, the contributions of this article are:
To establish an analytical model for calculating the hysteretic behavior of a friction type tensioner based on the structure parameters.
To develop a method for calculating vibration responses of tensioner in TBDS.
To carry out a method for estimating the accurate equivalent viscous damping of tensioner in analysis of a belt drive dynamic.
The organization of this article is as follows: In section “Model for calculating the hysteretic behavior of tensioner,” an analytical model for calculating hysteretic behavior of a friction type tensioner is established. In section “Experiment and model validation for vibration responses of tensioner,” the hysteretic behavior of tensioner is measured and compared with calculations by analytic model. In section “Method for estimating the vibration responses for tensioner in TBDS,” a method for estimating vibration responses of a tensioner in TBDS is presented, and a method for obtaining the accuracy equivalent viscous damping of tensioner is given. In section “Validation for the vibration responses of tensioner,” the vibration responses of tensioner are analyzed by the presented method and validated by the measurement of TBDS.
Model for calculating the hysteretic behavior of tensioner
In this section, the structure of a TBDS tensioner is introduced, and the modeling and calculating methods of the hysteretic behavior for the tensioner are presented.
Structure of tensioner and friction torques
The structure of a tensioner is shown in Figure 1. The tensioner consists of a base (1), a torsional spring (2), a tensioner arm (3), and a friction disk (6), and so on. The description for each component and the mechanical fit among components of tensioner are shown in Tables 1 and 2.
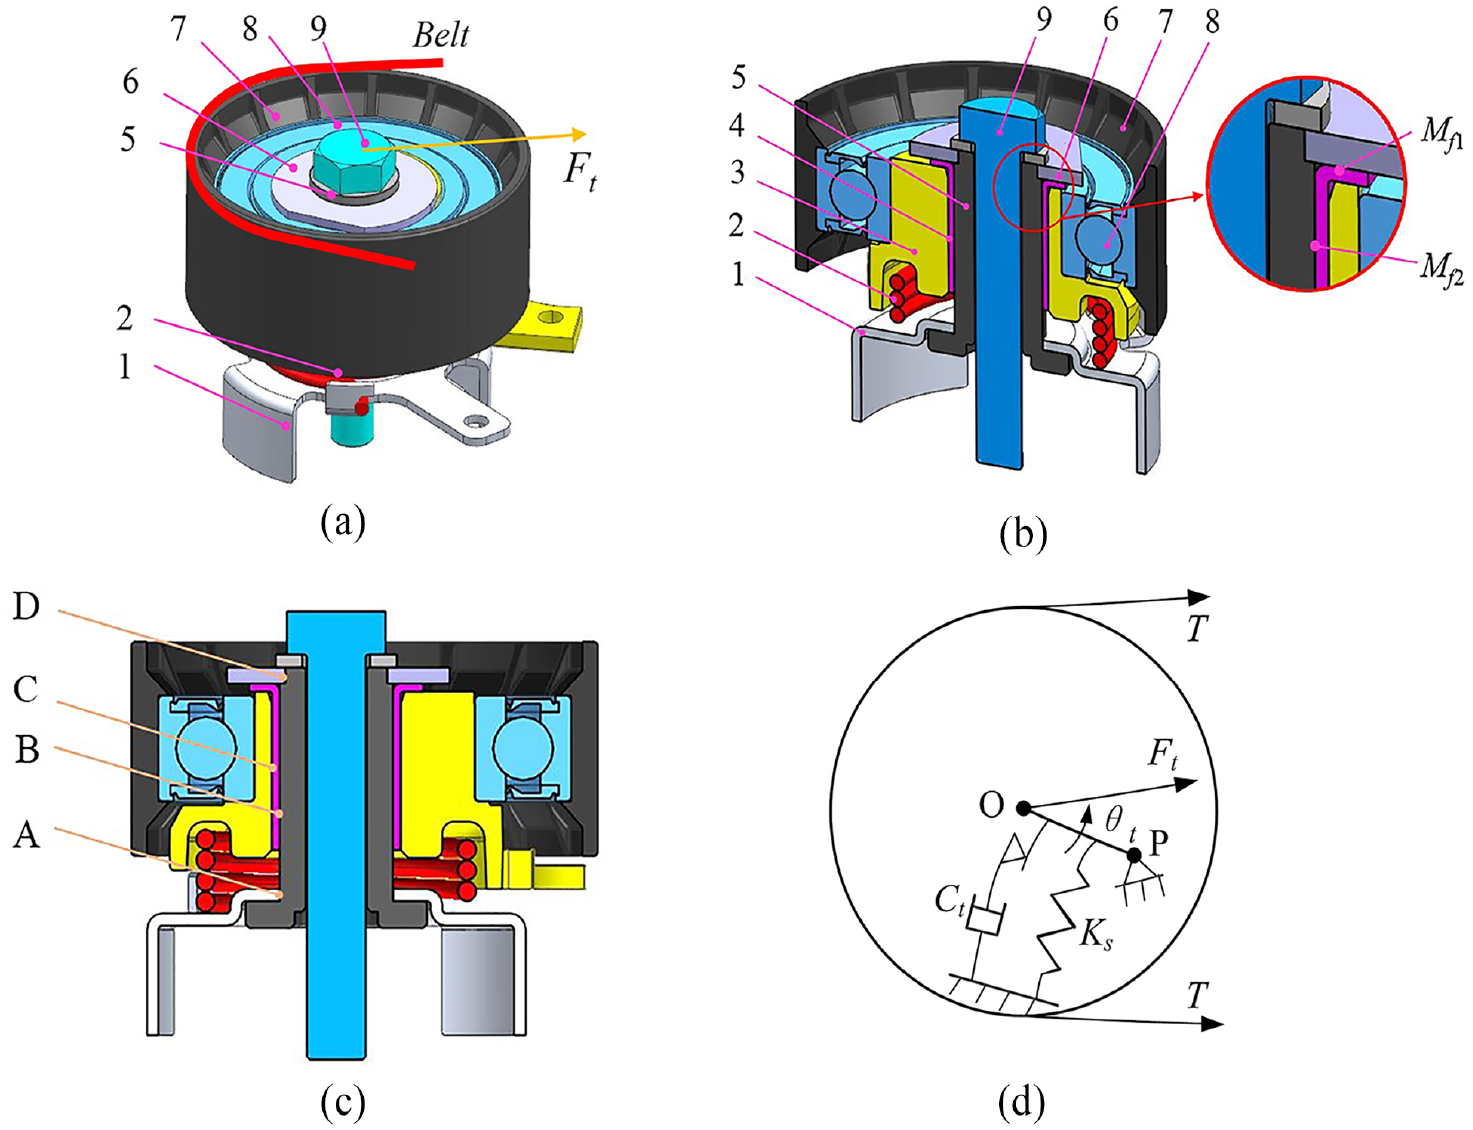
The structure analysis of the tensioner. (1) Base, (2) torsional spring, (3) tensioner arm, (4) bushing, (5) pivot shaft, (6) friciton disk, (7) pulley, (8) bearing, and (9) bolt. (a) Structure diagram of tensioner, (b) section view and location of the friction zone, (c) mechanical fit among components of tensioner, and (d) functional scheme of tensioner.
The description for each component of tensioner.

The mechanical fit between contact pairs of tensioner.

As shown in Figure 1(b), owing to the rotation of tensioner arm (3), a counter torque is generated by the torsional spring (2). Two types of friction torques are generated: the friction torque (Mf1) between the top surface of bushing (4) and friction disk (6), and the friction torque (Mf2) between the cylindrical contact surfaces of the bushing (4) and the pivot shaft (5). It is seen from Figure 1(d) that the tensioner is modeled as an element with torsional stiffness of spring and an equivalent damping caused by the friction.10,11
Modeling of friction torque of a tensioner
The working torque of a tensioner (Mt) consists of the spring torque (Ms) caused by the torsional spring, and the friction torques ( Mf1, Mf2) caused by the friction pairs. In this section, the method for obtaining the working torque of a tensioner is presented.
The torque (Ms) caused by the torsional spring is calculated by

where
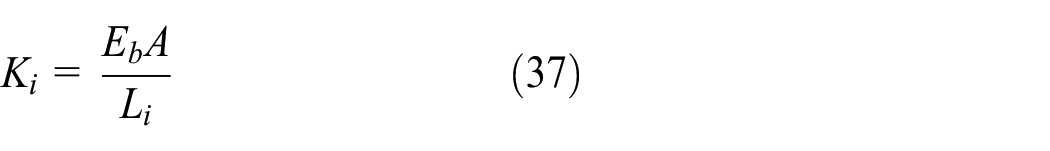
The torsional stiffness of spring is calculated by 19

where
Modeling of
As shown in Figure 2, the top surface of bushing is contacted with the friction disk under a compression spring force (FN). As the tensioner arm rotates, a friction torque (Mf1) is generated in the contact area.

The friction ring between the top of bushing and the friction disk.
Assuming the amount of compression displacement of spring is

The compression stiffness of the spring

where
A tiny ring with an increment dr′ in radius is taken as a studying objective. The force applied to the tiny ring is obtained by

where r′ is the radius of the tiny ring,
Then, the friction torque caused by the compression on the ring is calculated by integration as following

where
Modeling of
As shown in Figure 3, the friction torque

The force analysis on the tensioner arm and pivot shaft.
The definitions of parameters in Figure 3.

The resultant force applied on the axis
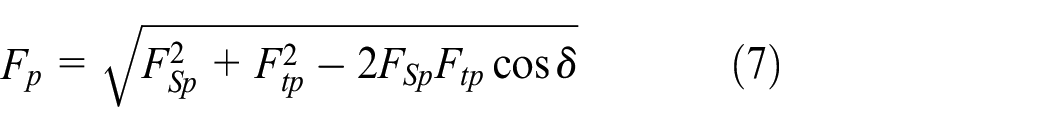
One end of the torsional spring is fixed to the tensioner arm, thus the direction of tangential force (FS) is determined by the structure of tensioner. The tangential force (FS) and the translational force (FSp) are calculated from the spring torque

The working torque (Mt) is generated if the hub load (Ft) is applied on the tensioner arm. It is seen from Figure 3 that the relationship between the hub load (Ft) and the working torque (Mt) is

where
The friction toque generated in cylindrical contact surfaces between the bushing and the pivot shaft is

where
The working torque (Mt) of tensioner is calculated by

where “±” represents the processes of loading and unloading.
According to equations (7), (9), (10), and (11), the friction torque (Mf2) is coupling with the working torque (Mt). It is difficult to find the explicit expressions of the friction torque (Mf2) and the working torque (Mt). Thus, an iterative algorithm is proposed in order to obtain these two torques. The iterative method is shown in Figure 4 and the steps are described as follows.
Step 1 Set the initial value (Mt0) to working torque.
Step 2 Calculate the friction torque (Mf2) using equations (7)–(10).
Step 3 Calculate the working torque (Mt) using equation (11).
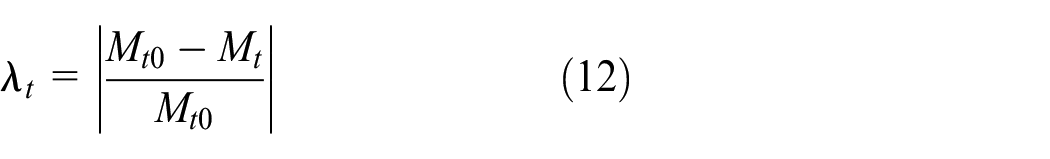
Step 4 Calculate the defined error index (λt)
Step 5 Check the error index (λt) in step 4 to see if it is less than a given limit
If it is “yes,” output the friction torque (Mf2) and the working torque (Mt) and then stop.
If it is “no,” record the new working torque (Mt) and then go to the next step.
Step 6: Update the initial data with the known working torque (Mt), and go to step 2.

Flow chart for obtaining the friction torque
Analytic model for calculating hysteretic behavior of tensioner
Owing to the existing friction torques, the relation between the working torque and imposed angle behaves in a hysteretic manner as shown in Figure 5.10,11
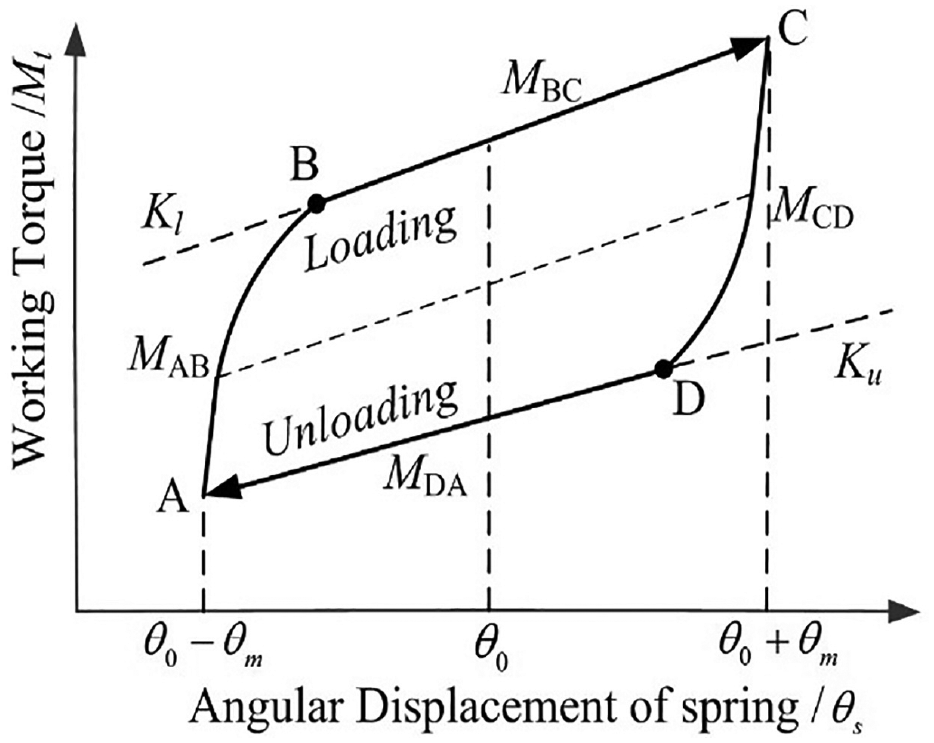
Hysteretic model of tensioner.
It is seen from Figure 5 that the hysteretic loop consists of two parts: the loading process and the unloading process. The loading process concludes the sticking motion of arc segment AB with a nonlinear reaction torque (MAB), and the slipping motion of line segment BC with a linear reaction torque (MBC). The point A and point C are the start point and the end point of loading process, respectively. The point
According to the Bastien et al.
10
and Michon et al.
11
, the slipping motions

where
The stiffness of loading (Kl) or unloading (Ku) process at slipping motion varies with frequency excitation. The dynamic stiffness under excitation is estimated by20,21
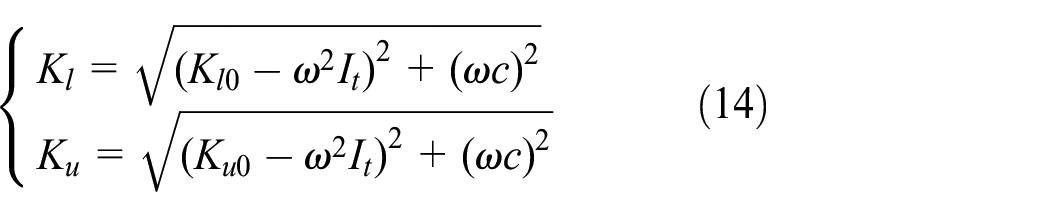
where

where
The friction torques are steady versus the imposed angle at slipping motion because the friction coefficient between contact pairs is fixed. Thus, the torques (MBC and MDA) can be calculated by equation (11). Then, the static stiffness

where
According to Bastien et al.
10
and Michon et al.
11
, a Duhem model is applied for describing the hysteretic behavior of tensioner. A first-order differential equation is used effectively for disclosing the relationship between the working torque (Mt) and the imposed angle

where
The integration of equation (17) gives 10
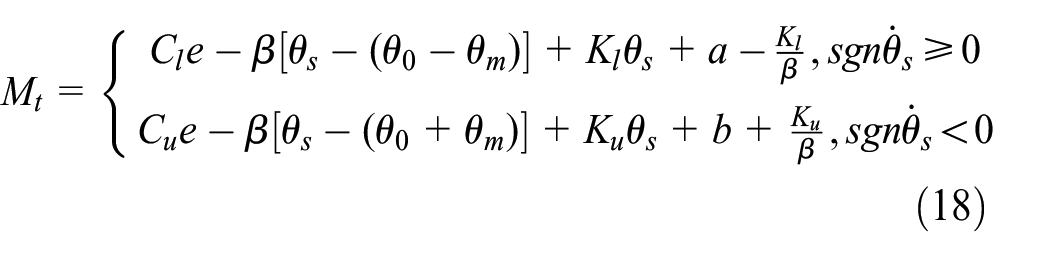
where

It is seen from equation (18) the working torque is described with three parts: an exponential function

The principle diagram for the exponential functions.
The exponential function


where
It is seen from Figure 5 that the lost energy (Ed) which corresponds to the difference of loading and unloading torques is caused by the existing friction torques. It is calculated by

Equivalent viscous damping (Ct) of tensioner is a key parameter in analyzing dynamic responses of a belt drive system. According to the hysteretic loop, the viscous damping is calculated by 16
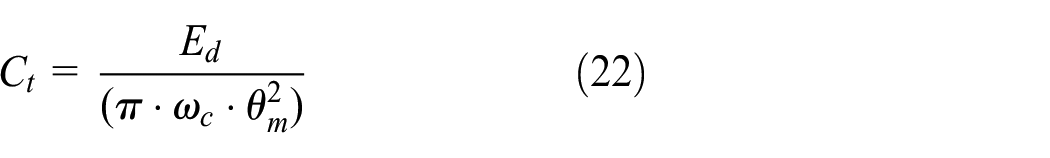
where the
Based on the established analytic model, the procedure for estimating the hysteretic torque of a tensioner is shown in Figure 7.
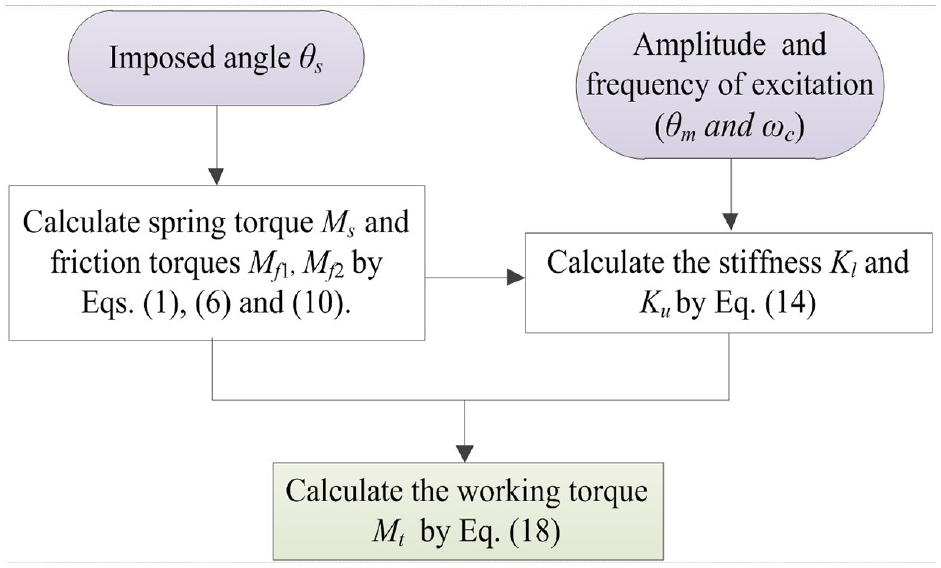
The flow chart for estimating the hysteretic torque of tensioner.
Experiment and model validation for vibration responses of tensioner
In this section, test rigs and procedures for measuring the hysteretic behavior of tensioner are presented. The working torque is measured and compared with the calculation.
The test rig for measuring the working torque of tensioner is shown in Figure 8. The tensioner pulley (3) is mounted inside a hook (2), and the hook (2) is connected to an actuator (1). The base of tensioner (3) is installed in a connecting support (4) which is fixed to the fixed jaw (5). The force sensor is installed inside the actuator (1).

Test rig for measuring working torque of the tensioner. (1) Actuator, (2) hook, (3) tensioner, (4) connecting support, and (5) fixed jaw. (a) Layout of a tensioner test rig, (b) schematic diagram for obtaining the working torque, and (c) measurement spot.
It is seen from Figure 8(b) that the actuator (1) applies a linear displacement

The measured working torque of the tensioner is calculated by

Validation of hysteretic model in a quasi-static excitation
Based on the parameters of tensioner listed in Tables 6 of Appendix, and the model developed in Section “Model for calculating the hysteretic behavior of tensioner,” the working torques of tensioner are calculated and measured from an initial spring position 63.5° to a limit position 90.5° in a quasi-static excitation. The results are shown in Figure 9.

Hysteretic torque versus angle in a quasi-static excitation (f = 0.01 Hz). (a) The torque versus angle with different coefficients β and (b) the comparison of the measured and calculated torque versus angle.
Based on equations (18) and (20), the positive constant
According to the research results of Bastien et al.
10
, the effective value of coefficient (β) is
Comparisons of stiffness for tensioner.

Validation for hysteretic model in a dynamic excitation
In this section, a measurement for obtaining the dynamic stiffness (Kl and Ku) of tensioner is presented by the test rig in Figure 6. The tensioner arm is excited with a reciprocating motion. The excitation amplitude of tensioner (θm) is set as 2.85°, and the excitation frequency (f) are swept from 1 to 35 Hz, respectively. The excitation amplitude of tensioner (θm) should be larger than the angle of sticking motion as shown in Figure 5, and it cannot be too large because of the limitation of test rig in a high frequency with large displacement excitation.
The hysteretic loops of tensioner versus different excitation frequencies (from 1 to 35 Hz) are measured one by one by the existing test rig stated in Figure 8. Based on the measured hysteretic loops, the dynamic stiffness of tensioner during loading and unloading processes are obtained by equation (16). The input parameters for tensioner are given in Table 7 of Appendix 1. The measured dynamic stiffness of tensioner versus exciting frequency is given in Figure 10. Based on the measurement, the damping of the tensioner arm

The dynamic stiffness during loading and unloading processes versus exciting frequency (θm = 2.85°).
It is seen from Figure 10 that the trend of measurements and calculations is the same. The stiffness of loading or unloading decreases first with an increasing excitation frequency which is caused by the inertia moment of tensioner arm. Then, the stiffness increases because of the rotational damping of tensioner arm.
Based on the method for estimating hysteretic loop stated in Figure 5 of Section “Analytic model for calculating hysteretic behavior of tensioner,” the working torque of the tensioner versus angle is calculated and compared with the measurement. The static stiffness of tensioner is the stiffness under a zero excitation frequency.
It is seen from Figure 11(a) and (b) that the hysteretic loops of calculation are close to the measurements. The maximum error occurs in the unloading process, because the unloading torque calculated by analytic model is larger than that of measurement. With a low excitation frequency 1 Hz, the loop calculated by the dynamic stiffness of tensioner is almost the same with that of the loop calculated by static stiffness.
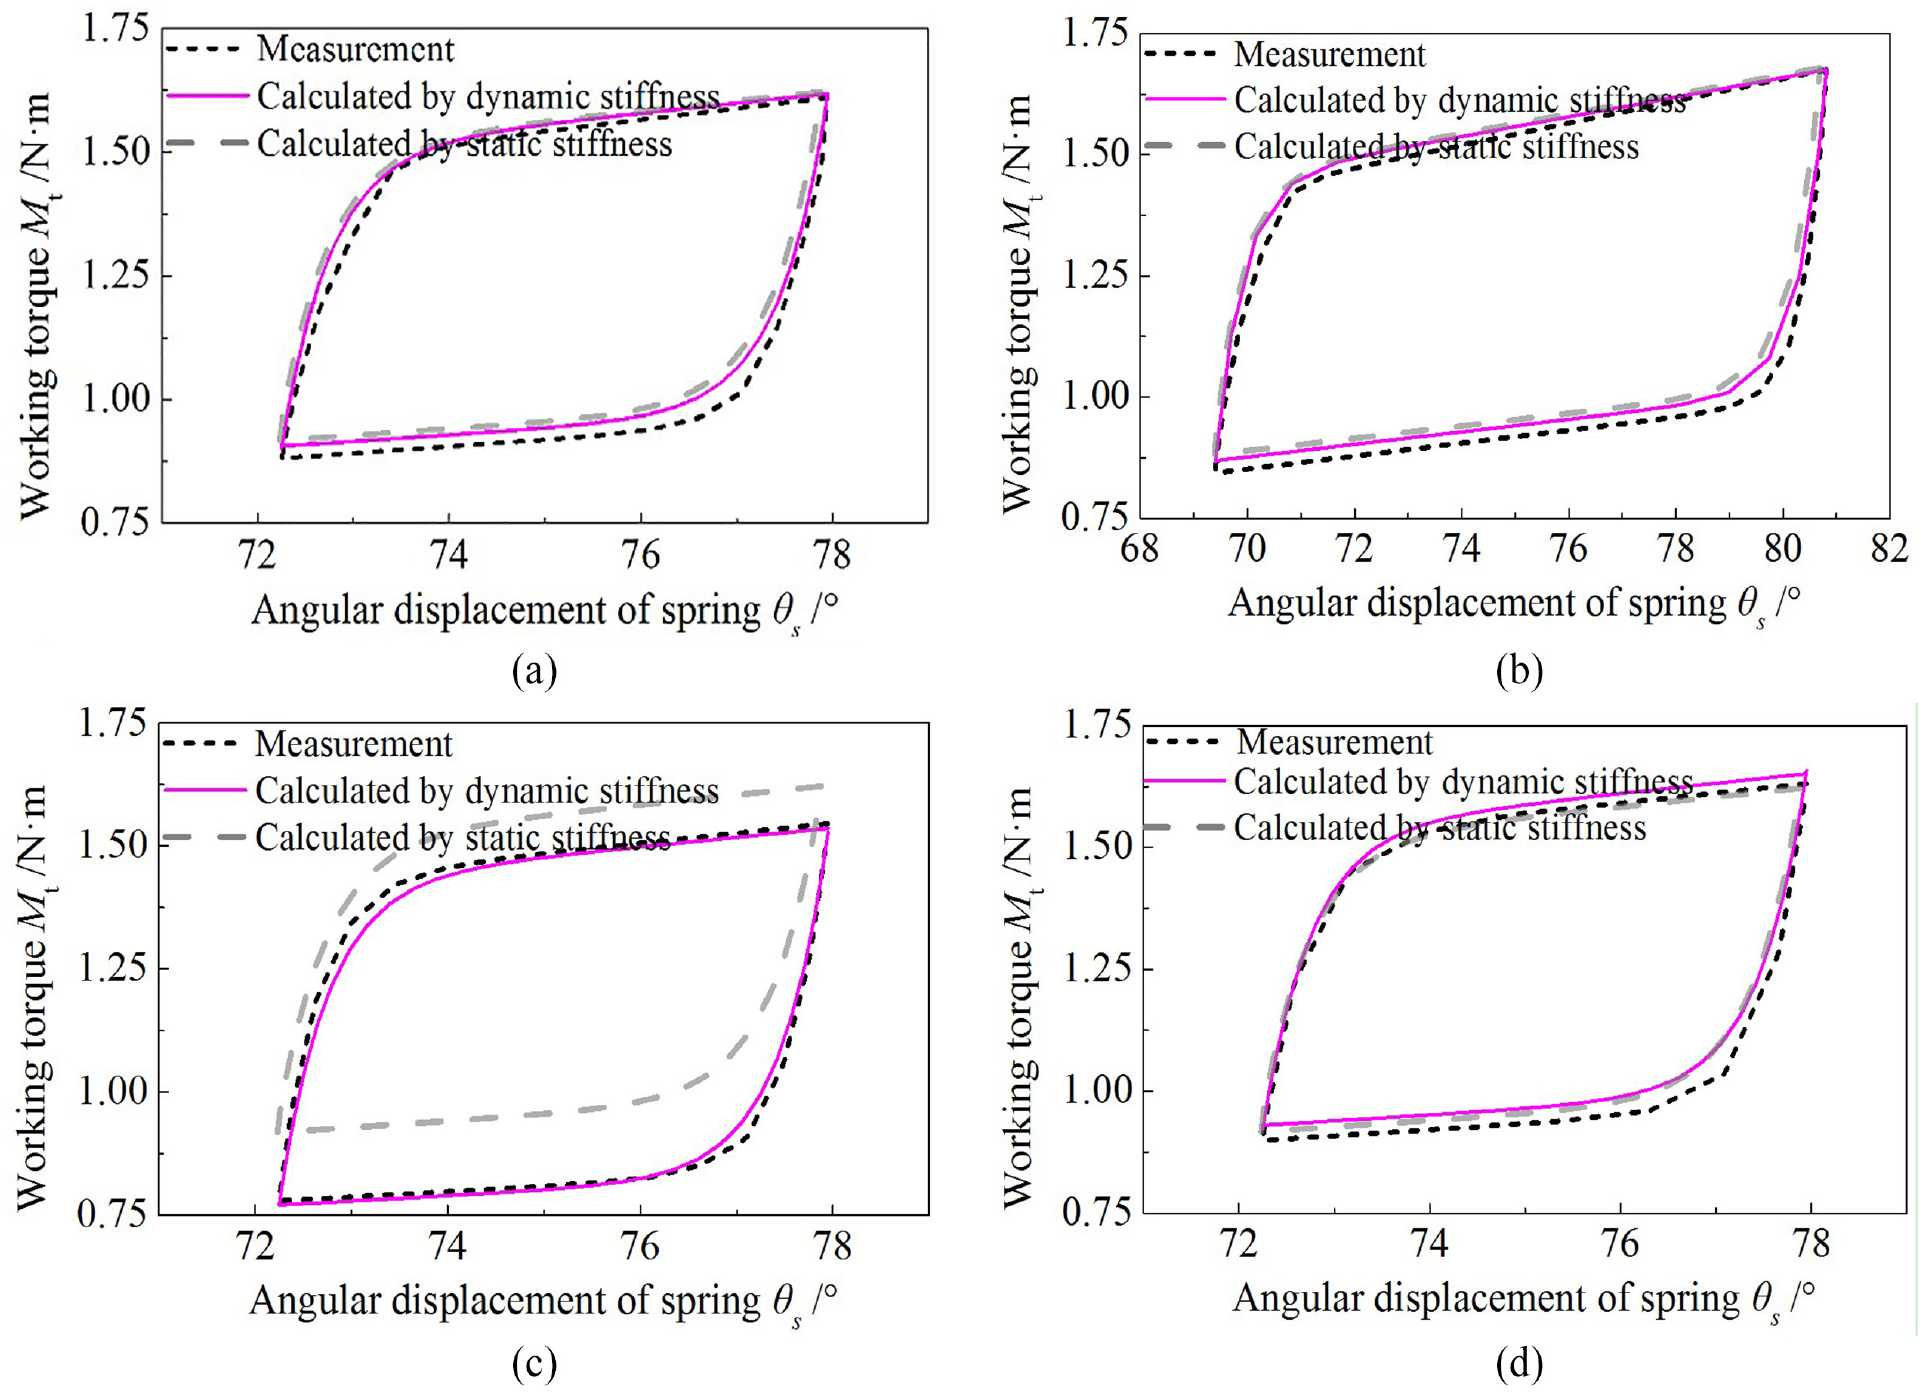
Comparison between the measurement and the calculation by the dynamic analytic model. (a) Hysteretic loop of torque versus angle with an excitation amplitude 2.85° and excitation frequency 1 Hz, (b) hysteretic loop of torque versus angle with an excitation amplitude 5.71° and excitation frequency 1 Hz, (c) hysteretic loop of torque versus angle with an excitation amplitude 2.85° and excitation frequency 15 Hz, and (d) hysteretic loop of torque versus angle with an excitation amplitude 2.85° and excitation frequency 30 Hz.
The dynamic stiffness of tensioner with an excitation frequency 15 Hz is smaller than the static one as stated in Figure 10. Thus, the hysteretic loop calculated by dynamic stiffness moves down comparing with that of the loop calculated by static stiffness as shown in Figure 11(c). With an excitation frequency 30 Hz, the dynamic stiffness of tensioner is close to the static one as stated in Figure 11(d). It is seen from Figure 11(d) that the hysteretic loop calculated by static stiffness is near to that of the loop by dynamic stiffness.
Method for estimating the vibration responses for tensioner in TBDS
As shown in Figure 12, a four-pulley engine TBDS is taken as an example. The system consists of a crankshaft (CRK), two camshafts (CAM1 and CAM2), and a tensioner (TEN). The pulleys and the belt spans are numbered counterclockwise. The driving pulley CRK is numbered as the first pulley. A coordinate system
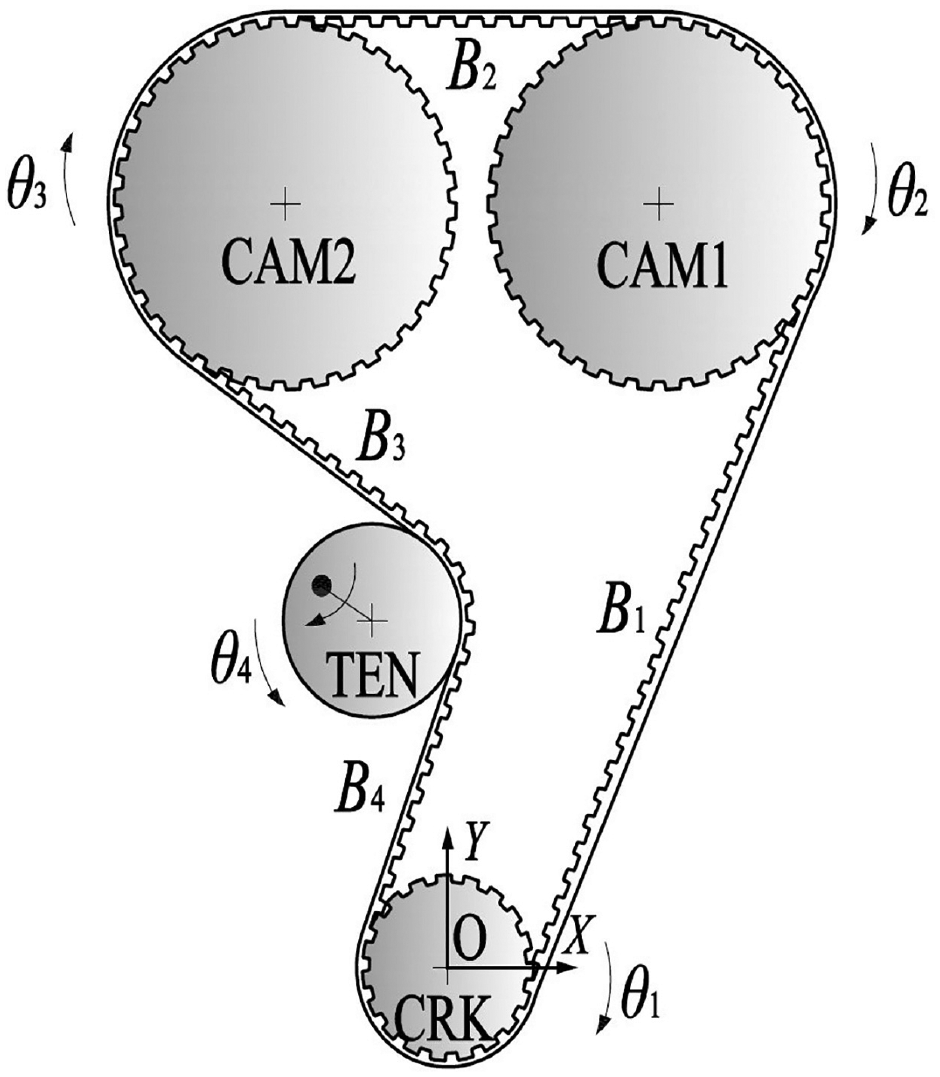
Schematic of a four-pulley timing belt drive system.
Modeling of TBDS
The TBDS includes four parts: the rotational pulley, the automatic tensioner, the meshed teeth region, and the belt tension. In this section, the modeling process for these parts is given.
Equation motion for driven pulley
In Figure 13, a transmitted torque

where

The moment applied to the fixed driven pulley.
Equation motion for automatic tensioner
The moment applied to a tensioner arm is shown in Figure 14. The reset direction of the tensioner arm is assumed to be counterclockwise. As the arm rotates clockwise around the pivot

where

The moment applied to a tensioner arm.
As shown in Figure 14,

Modeling of belt length variation on the meshed teeth region
The belt length variation on the meshed teeth region is used for calculating belt tension. Based on the Karolev and Gold, 22 the belt length variation on the meshed region depends on belt tensions around the pulley, the number of meshed teeth and the parameters of belt.
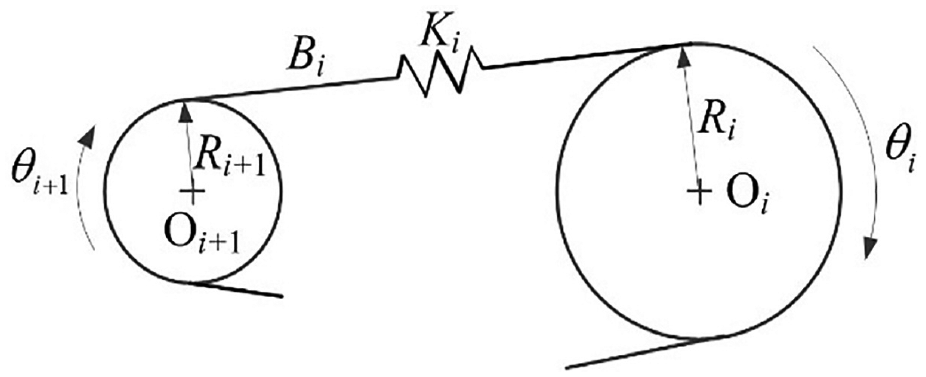
Assuming that the gap between each tooth of belt and pulley is assumed to be zero. Figure 15(a) shows the model of a meshed belt and pulley. The teeth of the pulley are assumed to be rigid. The timing belt is modeled as a soft spring

The meshed model of timing belt. (a) The model of a meshed timing belt and pulley and (b) the forces applied to the timing belt as the pulley drives the belt.
The forces applied to the timing belt are shown in Figure 15(b). The friction force

where
Taking the belt cord between the tth belt tooth and the

where
The relations among the belt tensions are simplified as a form of difference equation 22


where
The solution of the tension


where

If the timing belt drives the pulley, the direction of friction force is the opposite as the direction of belt moving. In this case, the frictional coefficient
The variation of belt length

where
Calculation of belt tension
The tension
1. Formulas for belt tension between two fixed pulleys
In Figure 16, based on the Hook’s law, the belt tension between two fixed pulleys is calculated by 17

where
Belt tension between two fixed pulleys.
The elongation

The variation of belt length


2. Formulas for belt tension between tensioner and fixed pulley
Assuming that the center of tensioner pulley moves from

Belt tension between tensioner and fixed pulley.
The belt tension is related to the belt elongation between the fixed pulley and the tensioner, the variation of belt length caused by the arm movement, respectively. Thus, the tension is 17

where
The variation of belt span length

where
If the tensioner arm angles
Solutions of vibration responses for tensioner
Under the excitations of the driving pulley and the load applied to each driven pulley, the vibration responses of tensioner are obtained by the model developed in section “Modeling of timing belt drive system.”
Method for obtaining the vibration response of tensioner
The excitation that applied to the TBDS consists of a central speed of CRK and fluctuations of angular speed. It is expressed as16,17
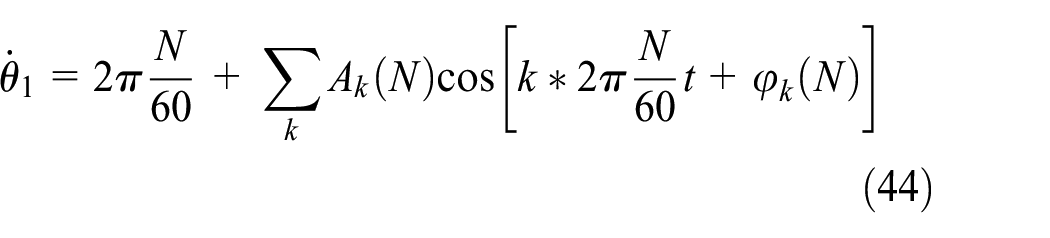
where
According to the established models, the dynamic differential equations of TBDS are derived as follow

The inputs of the system are the angular speed and the angular displacement of the CRK
It is seen from equation (45) that there are second order components, such as

Substituting equation (46) into equation (45), a first-order equation is obtained as follow
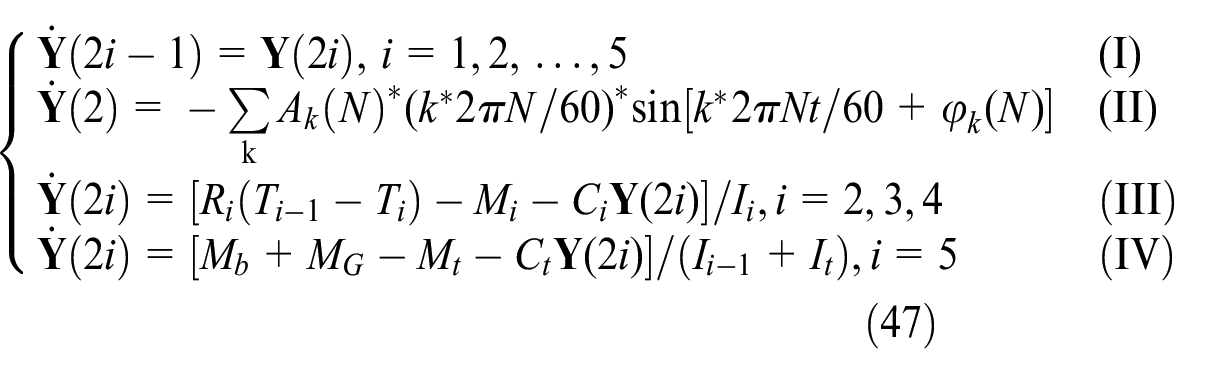
It is seen from equation (47) that the formula (I) is obtained by the definition of state variable
The moment

According to equations (36) and (41), the belt tension


The initial value of

A numerical method Runge–Kutta is used for solving the differential equations as stated in equation (47). The flow chart for calculating the vibration responses of tensioner is given in Figure 18.

Chart for calculating the vibration responses of tensioner.
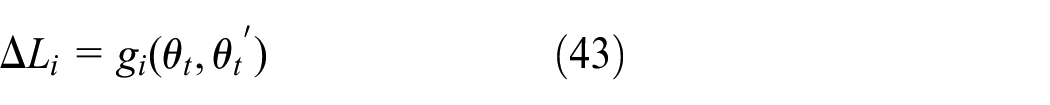
The angular displacements
Method for obtaining the equivalent viscous damping of tensioner
It is seen from equation (22) that the equivalent viscous damping
In the existing methods, an approximation value of equivalent viscous damping is used for estimating the oscillation response of tensioner arm.11–17 Besides, a measured result from the oscillation of tensioner arm in a belt system is added into the input data for obtaining the equivalent viscous damping of tensioner.
23
Here, an iterative algorithm is proposed in Figure 19 in order to estimate the accurate value of amplitude
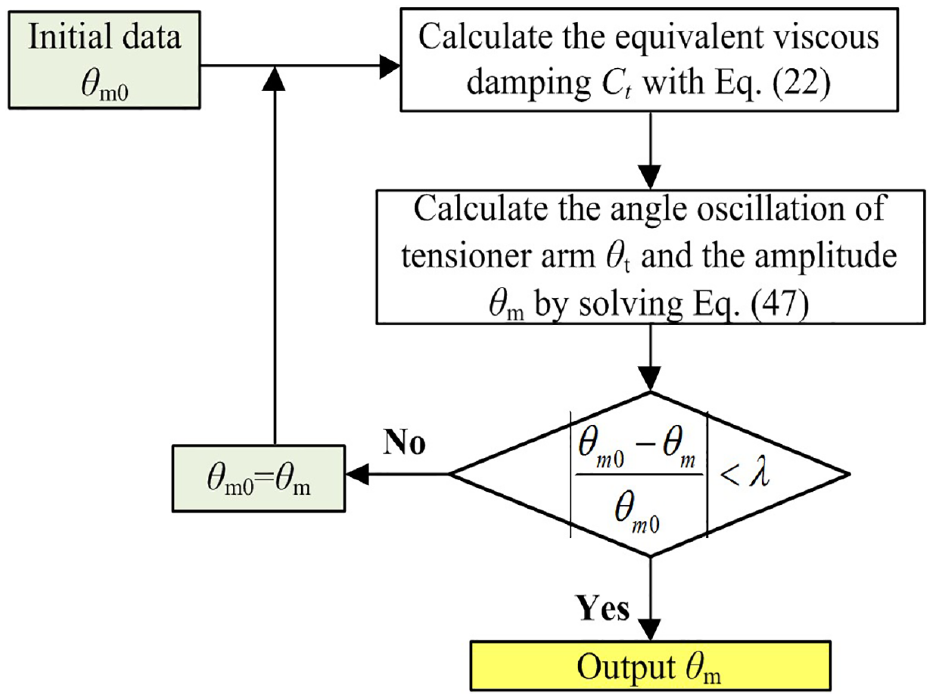
Flow chart for estimating the oscillation angle amplitude of tensioner arm.
Validation for the vibration responses of tensioner
Test rig for measuring the vibration responses of tensioner
The dynamic performance of tensioner is acquired by a test bench rig as shown in Figure 20. A data acquisition and analysis system is used in the measurement.

Test rig for measuring dynamic performances of a timing belt system. (1) Laser displacement sensor, (2) angle encoder. (a) Schematic diagram of the test rig and (b) layout of the test bench.
It is seen from Figure 20(a), that the angular displacement and angular velocity of the CRK are obtained by the angle encoder, and the laser displacement sensor is used for measuring the oscillation displacement of the tensioner arm.
The torsional vibration of the CRK is measured first by the angle encoder under an average CRK speed 1000 r/min. The excitation parameters stated in equation (44) are given in Table 5.
The excitation parameters of crankshaft with a speed 1000 r/min.

Figure 21 shows the loaded torque of camshafts versus phase at an average CRK speed 1000 r/min. The camshaft drives the valve with a cyclic varying load, and the phased difference is around 45°.

The loaded torque versus the phase of camshaft if crankshaft average speed equals to 1000 r/min.
Validation and analysis for vibration responses of tensioner
The coordinate, radius, moment of inertia, and damping for each pulley are shown in Table 8 of Appendix 1, the parameters of timing belt is shown in Table 9 of Appendix 1, respectively. Based on the stated method in section “Solutions of vibration responses for tensioner,” the oscillation angle of tensioner arm is calculated and compared with measurements.
It is seen from Figure 22 that the calculated value is smaller than that of the measurement. The maximum error occurs in a changing from slipping motion to sticking motion of tensioner arm with a value 27.1%. The amplitude of oscillation angle of tensioner arm

The oscillation angle of tensioner arm versus time for a crankshaft average speed 1000 r/min.
Using the existing oscillation amplitude

Working torque versus oscillation angle based on the calculating results (f = 33.33 Hz, θm = 2.55°).
According to the calculated oscillation angle of tensioner arm in Figure 22, the spring torque and the working torque of tensioner are calculated by equations (1) and (18), and are shown in Figure 24.
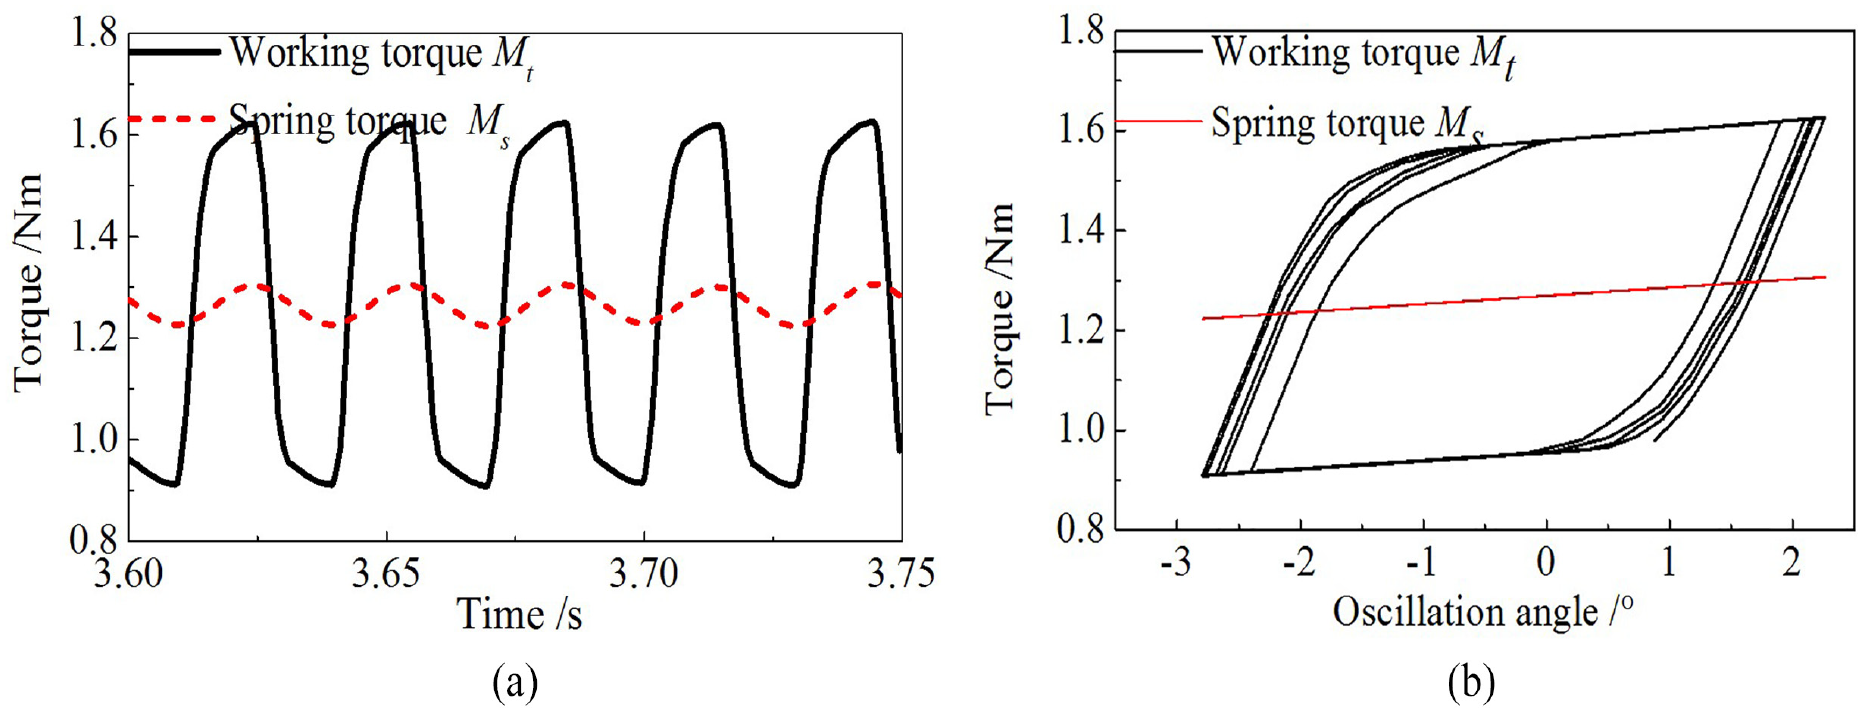
The working torque of tensioner. (a) The working torque of tensioner versus time and (b) loop of the working torque versus oscillation angle.
It is seen from Figure 24(a) that the working torque changes rapidly when the tensioner arm changes its direction of oscillation. The friction torque reaches maximum with a small angular displacement of tensioner arm, then the working torque of tensioner varies with a small loading or unloading stiffness. Figure 24(b) shows hysteresis loops of the working torque for tensioner. It is seen that the spring provides a basic torque, and the working torque mainly varies with friction torque.
The method stated in Figure 19 of section “Solutions of vibration responses for tensioner” is used for obtaining the equivalent viscous damping of tensioner. The initial amplitude of oscillation angle
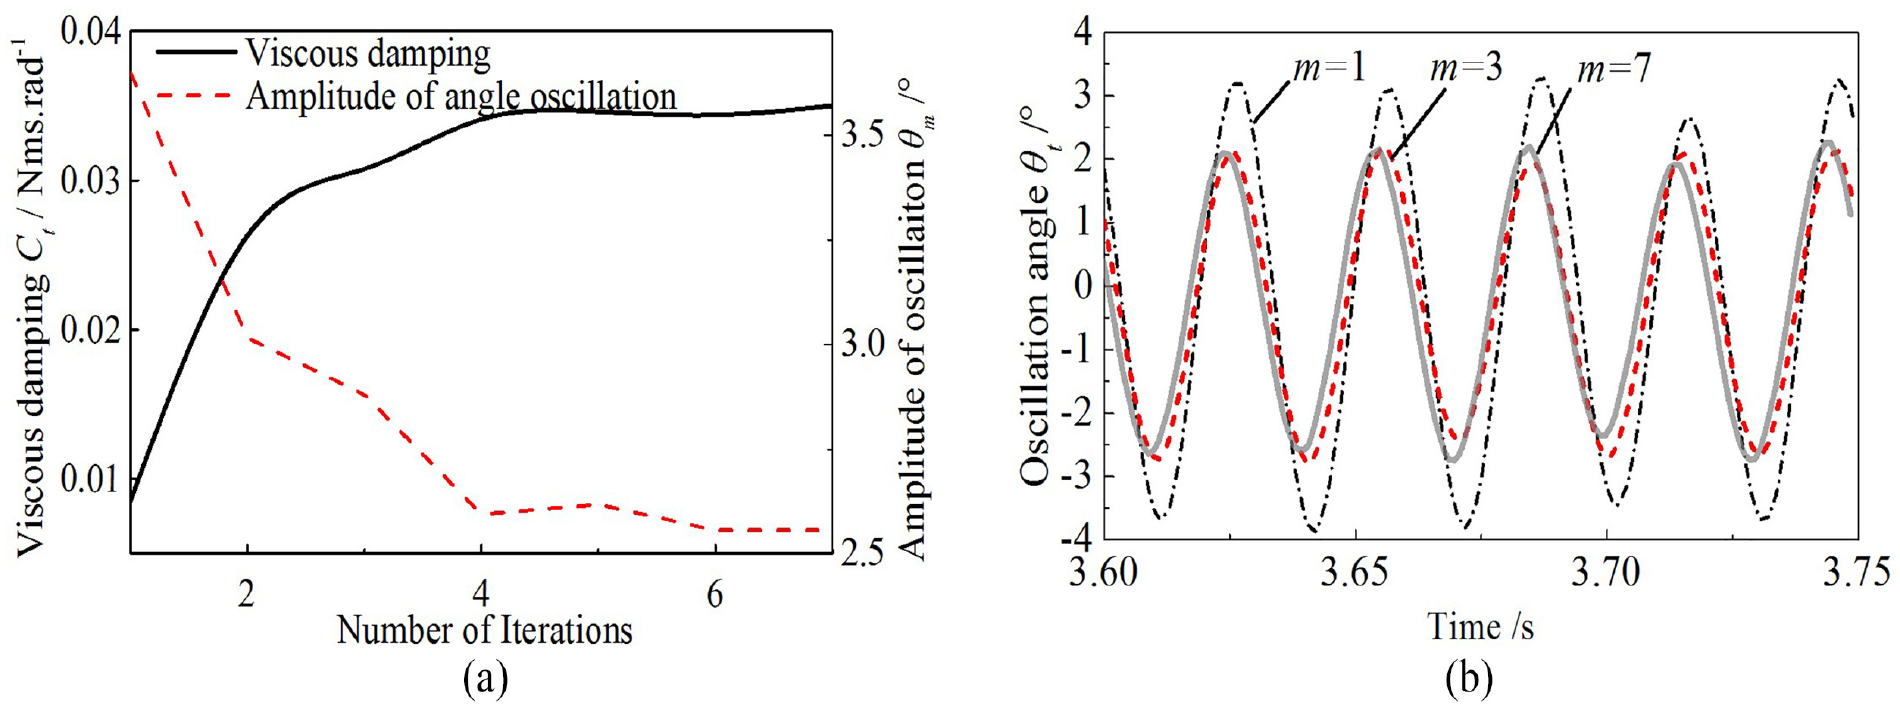
The viscous damping and amplitude of oscillation under different iterations. (a) The viscous damping and the amplitude of oscillation versus number of iterations and (b) the oscillation angle of tensioner arm versus time.
It is seen from Figure 25(a) that the amplitude of oscillation angle decreases with more iterations because the initial value is larger than the actual value, and the viscous damping increases with a smaller amplitude of oscillation angle
It is seen from Figure 25(b) that the amplitude of the oscillation angle of tensioner arm becomes smaller with more iterations. The vibration frequency of tensioner arm equals to the excitation of CRK. The phase of the oscillation angle delays with fewer iterations because of a smaller equivalent viscous damping.
Conclusion
The established hysteretic model provides a good description for the working torque of a friction type timing belt tensioner. The hysteretic model of tensioner displays a smoothness zone at the sticking motion during loading or unloading process.
The computational accuracy of the hysteretic loop depends on the stiffness of loading or unloading, and the initial torque at the position with maximum amplitude of excitation. The dynamic stiffness of tensioner varies with the frequency of excitation, which has an obvious influence on the hysteretic torque of tensioner.
The iterative algorithm has a good accuracy in estimating the value of oscillation angle of tensioner arm and viscous damping of tensioner in a belt drive analysis. The maximum error occurs in a changing from slip motion to sticking motion of tensioner arm.
Footnotes
Appendix 1
Parameters of the timing belt.

| Symbol | Parameter | Value | Unit |
|---|---|---|---|
| Pitch | 9.525 | mm | |
| Cross-sectional area | 49.78 | mm2 | |
| Angle covering the belt piece between two teeth | 9 | ° | |
| Angle of the tooth profile | 32 | ° | |
| Elasticity modulus | 5107 | MPa | |
| Installation tension of equilibrium position | 208.6 | N | |
| Belt length of equilibrium position | 1114.42 | mm | |
| Stiffness of one tooth | 252 | N/mm | |
| Frictional coefficient of belt | 0.2 | – |
Handling Editor: James Baldwin
Declaration of conflicting interests
The author(s) declared no potential conflicts of interest with respect to the research, authorship, and/or publication of this article.
Funding
The author(s) disclosed receipt of the following financial support for the research, authorship, and/or publication of this article: The paper is supported by the National Natural Science Foundation of China (No. 51305139).