
Abstract
In this article, a series of analysis were performed on a two-dimensional structure of steel and rubber-covered rollers. First, a hyperelastic–viscoelastic composite constitutive model based on a dynamic mechanical experiment of rubber was formulated to accurately describe rubber properties. Meanwhile, a hyperelastic constitutive model not considering viscoelasticity was set as the control group. The material used in this article was the nitrile rubber with the Shore hardness of 40. Then, the effects of viscoelasticity on the von Mises stress were analyzed by comparing results of two models. The influences of working conditions (roller speeds/compression displacement) on the von Mises stress and the area of hysteresis loop were also studied. Next, the contact characteristics under different working conditions and constitutive models were analyzed combining viscoelasticity. A verification experiment of contact width was carried out, and the theoretical and simulated values were calculated and compared. Finally, the relation of “low peak” phenomenon with viscoelasticity was studied, and the effects of working conditions and rubber viscoelasticity on contact feature of rollers were summarized. The conclusions of the article can help engineers to better optimize dynamic working conditions and judge the working state of the structure.
Keywords
Introduction
In the field of papermaking, printing, and sheet making, rollers are widely used in the process of media transfer or sheet material manufacturing. Pairs of steel and rubber-covered rollers are typical combinations usually used in rollers machine. The mechanical characteristics and rolling stability during the transmission process are worth studying, especially the changes caused by working conditions and the material. This is also the main research content of this article.
Many other researchers have studied the contact problems of steel and rubber-covered rollers. The assumption of plane-strain state, in which the rollers have infinite length and the uniformly axial pressure, was used frequently to determine the contact pressure distribution of rubber-covered rollers. Johnson 1 discussed the pressure distribution and pressure state of two-dimensional cylindrical rolling contact problems based on narrow strip theory and half-plane hypothesis.
To study the contact behavior of rubber covered roller, Parish2,3 discussed the various loading conditions of rubber-covered rollers through physical experiments and proposed a method on Hertz contact theory to analyze the contact problems with a rubber-covered roller and an elastic roller. Wang and Knothe 4 analyzed the contact stress, rolling resistance, and contact width of two rolling viscoelastic cylinders. ACT Aarts et al. 5 developed a mathematical model to solve the pressure distribution in nips of flexible rubber-covered rollers. Austrell and Olsson 6 performed a large number of static simulations and proposed a two-dimensional elastic contact model to discuss the influence of structure dimensions, the shear modulus of material, and the line loading by fitting the nip function. However, the differences in contact characteristics between static and dynamic conditions exist for contact problems. Many researchers were doing static or quasi-static simulations to approximate dynamic conditions. Despite the huge computational cost, it is a better way to study contact problems under dynamic working conditions that perform transient numerical simulations.
Researchers had done a lot of investigations on the contact problems of polymer rollers. A Elsharkawy 7 proposed the numerical solution of dry contact of two viscoelastic rollers. To analyze axial pressure distribution, KC Hinge and Maniatty8,9 evaluated a three-dimensional rolling contact for two rubber-covered rollers and studied the effect of skewing on nip pressure distribution. The relationship between friction coefficient and contact pressure in rolling contact is discussed in Domitran et al. 10 and Bijelić et al. 11 EL Deladi et al. 12 developed a friction model in metal–rubber contact based on viscoelastic–rigid asperity coupling and discussed the contact behavior of metal–rubber in displacement/load-controlled cases. A Jurkiewicz et al. 13 studied the radial displacement and half of the contact width and gave the mathematical solution. 14 However, A Jurkiewicz and many researchers have described the properties of rubber using the equivalent elastic modulus and some modified empirical formulas or correction coefficients. These treatments are engineering-oriented and have a strong applicability under certain conditions. Since rubber has the highly nonlinear stress–strain relationship, it is more appropriate to accurately construct its constitutive model through material experiments.
The research object of this article is the structure of steel and rubber-covered rollers. A two-dimensional structure of steel and rubber-covered rollers was studied based on the plane strain assumption. The results of this article should be beneficial in structural design and process parameter selection for researchers and engineers.
The remainder of this article is outlined as follows. The properties of nitrile rubber, the dynamic mechanical analysis (DMA) experiment, and the construction of a hyper-viscoelastic constitutive model of rubber are described in “Materials and methods” section. Geometry models, working conditions, and simulation settings are detailed in the “Model description” section. Next, in “Results and discussion” section, analysis of dynamics and contact characteristics are presented. The effects of rubber viscoelasticity and working conditions are discussed in detail by theoretical calculations, numerical simulations, and experimental verification. Finally, the conclusions are given.
Materials and methods
In the mechanical problems of steel and rubber-covered rollers during rolling, since the deformation mainly occurs in rubber layer, this section is dedicated to studying rubber properties and establishing accurate rubber constitutive models by experiments.
Mechanical behaviors of rubber
Rubber is one of the most widely used polymer materials in the industry. It has low Young’s modulus and high ductility. Hyperelasticity and viscoelasticity of rubber are the fundamental characteristics that can describe many mechanical behaviors of rubber, such as large deformation, heat generation, and hysteresis under dynamic loading. In addition, the properties of rubber are also closely related to temperature and frequency.
Hyperelasticity can be used to define the elastic parameters of rubber, reflecting the resistance of rubber to deformation. The heat generation, relaxation, and creep are caused by the viscoelasticity of rubber. Viscoelasticity is a key property that affects the mechanical behavior of rubber. Dynamic viscoelastic properties such as rubber hysteresis and heat generation become obvious with the time accumulation. In order to consider the effect of rubber viscoelasticity in rolling, an experiment on rubber was carried out.
Experiment on DMA
DMA is the most efficient technique used to study and characterize the viscoelastic behavior of polymers. The DMA experiment was carried out to test the viscoelastic properties of nitrile rubber where the Shore hardness (HSA) was 40. The DMA experiment details are listed in Table 1.
The DMA experiment details.

DMA: dynamic mechanical analysis.
The phase lag between stress and strain for viscoelastic polymers appears during DMA experiment. The loss factor which is used to characterize the hysteresis between stress and strain can be expressed by tan δ = G2 / G1 (the tangent of the phase difference between the stress and strain). The larger the loss factor, the more obvious the viscoelasticity. As shown in Figure 1(a), a relaxation curve with a frequency of 8.5 Hz and a test temperature of 20°C is taken as an example to reflect the change of the shear relaxation modulus with time. The relaxation modulus curves at different temperatures and frequencies can be calculated by the Williams–Landel–Ferry (WLF) equation using experimental data and temperature shift factors. The loss factor tan δ at different load frequencies with a temperature of 20°C is shown in Figure 1(b).

Experiment of shear relaxation: (a) modulus curve and (b) loss factor.
Constitutive model of rubber
Rubber is a material with strong nonlinear stress–strain characteristics. In order to characterize rubber, various methods have been proposed to describe it. Theory and test is one of the most widely used manners for obtaining the equivalent elastic modulus and Poisson’s ratio. Another widely used method is to construct different constitutive models to describe complex rubber properties based on experiments or some empirical formulas.
It is known from the elastic mechanics, in the range of small strain, the Poisson’s ratio μ is 0.5 for incompressibility materials. Rubber is an approximately incompressible material, and its Poisson’s ratio is extremely close to 0.5, for example, in Aarts et al.,
5
it is set to 0.49. The μ was set to 0.495 in this article for numerical simulation, and the relationship between elastic modulus and shear modulus was given as follows:
Hyperelastic constitutive model
Polynomial strain energy functions are important methods for describing hyperelastic material, as shown in equation (1). Equation (1) is suitable for describing rubber elasticity while viscous effects need to be modeled by a separate viscoelastic model. As shown in equation (2), taking N = 1 and only considering the first term of i and j, equation (1) becomes the two-parameter Mooney–Rivlin HEL model that has been used in this work


where W is strain energy potential;
The relationship between
Properties of rollers material.

HEL: hyperelastic.
Viscoelastic constitutive model
Viscoelasticity is one of the most important characteristics of rubber, which is closely related to hysteresis and heat generation during rolling contact. So it is necessary to consider the influence of viscoelasticity, especially dynamic viscoelasticity. For dynamic viscoelasticity, hysteresis can be seen in the stress–strain curve and the energy dissipation in the cycle of force loading–unloading. The generalized Maxwell viscoelastic constitutive model was used as the viscoelastic model of rubber and described by discrete Prony series. The constitutive model for a generalized Maxwell model is given by equations (4) and (5). G(t) and K(t) are the Prony series shear relaxation and bulk modulus, respectively


where
The viscoelasticity of rubber was defined by curve fitting the DMA experimental data (shear relaxation modulus and bulk modulus) using the Prony series. Finally, the H-VEL constitutive model of rubber was established by superimposing the hyperelastic and viscoelastic parameter.
Model description
Geometric model and conditions setting
Two-dimensional geometric model
The actual geometric sizes of structure are shown in Figure 2. The rubber roller is composed of a central shaft which is made of steel and an outer rubber layer. The diameter of the steel shaft is 45 mm, and the thickness of rubber layer is 10 mm. The geometric sizes adopted in this work come from the contact dynamics platform of steel–rubber rollers.

Steel and rubber-covered rollers structure.
In real engineering components, stress and strain are three-dimensional tensors. However, in the roller structure studied in this work, the length of the structure is larger than the other two dimensions, and the length direction is uniformly loaded, which can be regarded as the “planar strain” assumption. Basing on plane strain condition, the study of steel–rubber roller structures can be analyzed in a two-dimensional state.
In addition, in order to consider the effect of the length of the roller, the analysis mode of the generalized plane strain was used in the numerical simulation. The structure of steel–rubber rollers was modeled in the module of transient dynamics in ANSYS to simulate and analyze the problem considering the nonlinearity of rubber and the dynamic contact.
Contact conditions setting and basic assumptions
Combined with physical structure, the working conditions were drawn up in Figure 3. The three stages of the process were indicated: static compression, accelerating rotation, and stable rotation. The numerical simulations were done in ANSYS WORKBENCH. The rubber layer was divided using the 0.25 × 0.25 mm grids to ensure the accuracy of the calculation. Furthermore, the time step was set small enough to capture the change of stress and other contact characteristics. The following basic assumptions and conditions were made in numerical simulations:
The steel roller and steel core were set to rigid body due to the significant difference of stiffness for steel and rubber, that is, the deformation of the steel roller was not considered. Meanwhile, the contact type was set to asymmetrical so as to improve the calculation precision.
The friction coefficient between steel and rubber is set to 0.2. This article is mainly focused to investigate the influence of rubber viscoelasticity and does not involve the discussion of friction coefficient. In fact, the different friction coefficients between steel and rubber affect the tangential stress and strain, contact pressure, and other results. The relationship between contact pressure and friction coefficient is discussed in Domitran et al. 10 and Bijelić et al. 11 and the static friction problem of rubber–metal contact is also studied in Deladi et al. 12
In the numerical simulation, the thermal effect of the rubber during the rolling process was not considered. Actually, temperature is an important factor, especially under some working conditions. As the running time increases, the heat generation of the roller becomes obvious due to friction and rubber viscoelasticity. When the loading is large, with the accumulation of rolling time, the heat generation caused by friction and viscoelastic hysteresis leads to an increase of working temperature. The Young’s modulus of rubber becomes more “soft” as the temperature increases and the contact width changes.

Simulation process of working conditions.
Loading differences in the rolling
The viscoelastic data of rubber were obtained by the DMA experiment. Relaxation data are crucial, which can fit the relaxation curve shown in Figure 1. The deformation of rubber layer in contact zone would exceed the allowable range of working operation if the relaxation modulus is reduced to a certain extent, which affects the stability of working and the quality of finished product.
To identify the working condition, the applied loading, or compression displacement, rolling speed n and geometric sizes should be obtained. We have calculated the time that any node passes the contact area, that is, the contact time of any node can be obtained. Because rubber is the isotropic material, using nodes can reflect changes in material, which draws on the “micro-element” idea of finite element method (FEA). The loading function was established and the difference between the actual working and the DMA experiment is shown in Figure 4. The value of contact width

Difference in loading between DMA experiment and working condition.
The rolling period T can be obtained from the n and the contact time is recorded as Δa. Meanwhile, the rolling motion can be regarded as a uniform circular motion when rolling speed is stable and so the contact frequency f = 1 / T = n / 60. Although f is determined by T, the contact time of the loading is significantly smaller than T. Taking the displacement under loading distributed in the form of a trigonometric function as an example, if this quantity (the compression displacement) is λ, the following function can be used

To solve the contact time Δo, the rolling speed of structure and speed of microelement should be equal. The rolling speed of structure is equal to the circumference divided by the time, and the speed of the microelement is equal to the contact arc length divided by the corresponding time. So there is an equivalent relationship between Δl/T and 2b/πd and equation (7) can be listed as

where
It can be seen that for a certain area during rolling, there always exists a stage without the loading and deformation recovering. This time for the zero loading is shortened by increasing the rolling speed. The viscoelasticity of rubber may be different in rolling, so the numerical simulations were carried out at different conditions.
Results and discussion
Result of dynamics analysis
Effect of rubber viscoelasticity
In order to study the effect of viscoelasticity, the HEL and H-VEL models were used in the numerical calculation. The difference between the two models is related to viscoelasticity. The von Mises stress and strain were obtained.
The displacement under loading was 1.2 mm and the rolling speed was 240 r/min. The nephogram of the von Mises stress is shown in Figure 5, extracting the node value of the maximum stress in Figure 6. It can be seen from Figure 6 that the contact problem of the steel and rubber-covered rollers for this loading condition belongs to a small strain range.

Nephogram of the von Mises stress.

The von Mises stress (strain) of same node during passing contact zone.
The von Mises stress of the HEL model is greater than in the case of the H-VEL model, which means that the presence of viscoelasticity reduces the stress peaks. Viscoelasticity is described as the relationship between time and the reduction of modulus. The modulus (the “instantaneous” Young’s modulus of the rubber) decreases as the residence time of the node in the contact zone increases, which ultimately leads to the reduction of von Mises stress.
Another significant difference between two constitutive models is the relationship between stress and strain during the loading–unloading process. The stress–strain relationship in the HEL model remains linear and the value of Young’s modulus of the rubber is almost constant. However, for the H-VEL model, as shown in Figure 7, the stress–strain relationship of the same node with HEL model presents a hysteresis loop, which is the related to the reduction of Young’s modulus as well as proportional limit. The hysteresis loop area represents the value of the energy dissipated, that is, for heat, for example.

Stress–strain relationship of two constitutive model.
An effect due to rolling speeds and compression displacement
In the simulations of this work, the von Mises stress in the HEL model is higher than that of the H-VEL model, so it is mainly discussed based on the H-VEL model. Different rolling speeds and displacement loading were used to study the effect of viscoelasticity and to discuss the scope of application of the results.
Rolling speed of the roller is an important feature of the structure. Small-size rollers are prone to vibration problems at high rolling speed while not obvious at low speed. Keeping the compression displacement between the two rollers at 0.4 mm, the rolling speed ranges between 60 and 600 r/min—there are 10 groups in increments of 60 r/min. As shown in Figure 8, an increase of velocity causes a raise of the von Mises stress. However, the increase is only obviously visible at the lower range of speed. In a case of the low friction coefficient of 0.2, the speed of the rollers is not a sensitive variable. When the friction becomes significant, the influence of the speed on the structure behavior gradually becomes obvious. Moreover, an increase of the rolling speed caused the increase of energy dissipation. The effect of viscoelasticity can be intuitively reflected from the stress–strain hysteresis loop area, and the enlargement of the hysteresis loop area implies an increase in energy dissipation caused by viscoelasticity. It can be seen from Table 3 that hysteresis loop area enlarges with the increase in rolling speed.

The von Mises stress at different rolling speeds.
Hysteresis loop area under different rolling speeds.

In offset printing, the loading is added by an increase of compression displacement in this operation. In fact, the displacement and compression forces can be converted to each other. Keeping the rolling speed of rollers at 240 r/min, the compression displacement ranges from 0.4 to 2.0 mm—there are five calculation groups in increments of 0.4 mm. It can be drawn from Figure 9 that the stress increases with the increase in displacement. The effect of viscoelasticity deserves attention. As shown in Table 4, the increase of the compression displacement makes the hysteresis loop area significantly expanded, which also means the enhancement of viscoelastic effect.

The von Mises stress at different compression displacement.
Hysteresis loop area under different displacement.

For von Mises stress, in the case of a low friction coefficient, the effect due to normal loading is much greater than the rolling speed. However, in terms of the running state of the structure, both the rolling speed and compression displacement are important factors that cause the different expression of viscoelasticity. Neglecting changes in material caused by temperature, the actual extent of rubber viscoelasticity is related to the loading condition and the frequency, which corresponds to the compression displacement and the rolling speed, respectively. It can be seen from Tables 3 and 4 that the hysteresis loop area enlarges as compression displacement and the rolling speed increase, that is, the extent of rubber viscoelasticity becomes more obvious.
Result of contact characteristics
In the industry, roller structures are common in the field of printing and packaging machinery. Any region of the structure undergoes the process of entering–leaving the contact zone during the rolling of rollers. The medium often performs its functions in this process, such as the process of ink flowing for printing and plastic film transferring for packaging. Contact of the components creates a nonlinear problem, and the characteristics of the area during dynamic rolling deserve to be studied to be better applied to production.
Contact width
In printing, contact width is a critical feature. When the ink passes the contact zone, it is subjected to compressive force and evenly transferred to the next component. Similarly, in the field of textile and metal rolling, the roller structure plays an indispensable role in compressing or making the object uniformly.
First, the measurement experiment of contact width under different compression displacement was carried out. An intuitive high-speed photographing method was used to record contact images with different compression displacement, and the rolling speed keeps 240 r/min. The rollers were mounted in a metal frame and the extremity was visible. Many pictures of the contact area were taken after each increase in the compression displacement of the rollers and reaching the constant rolling speed 240 r/min. Contact width was measured on the basis of the pictures and a constant covered rubber layer thickness of 10 mm was used as the measurement scale. Image processing was performed in MATLAB to obtain the contact width. The result is presented in Figure 10.

Contact width at different compression displacement.
The results of contact width 2b of experiment and numerical calculation were shown in Table 5. It can be seen that the errors of contact width obtained by experiment and simulation were kept within an acceptable range.
Contact width at different compression displacement with rolling speed 240 r/min.

Contact pressure
Contact pressure is one of the most important features of the rollers structure. The stability of rolling would be strengthened if the contact pressure is stable. For example, it is directly related to the uniform extent of ink adhesion in printing.
The contact problem between two parallel cylinders was first studied by Hertz and widely recognized. As shown in equations (8)–(10), the half of contact width b0 and the applied load per unit length of the cylinder Q were given by Hertz theory. In general, this theory is suitable for the contact of homogeneous bodies and the dimensions of contact region is much smaller than the dimensions of structures


where
However, Chu et al. 16 showed the results of the dynamic rolling steel–rubber rollers obtained by means of the Hertz contact theory had a deviation from the actual calculation. Moreover, Johnson et al. 17 find that the contact area under low value of loading was larger than the result predicted by Hertz theory, and the contact area was not zero even after the loading was removed.
Equations (8) and (10) are no longer suitable if the roller consists of a rubber layer and a steel core. Thomas and Hoersch
18
gave the solution of two parallel rollers in the plane strain condition, one is assumed the rigid and another is elastic. When the soft roller is a rubber roller, the contact width is recorded as 2b0, and when it is a rubber-covered roller, the contact width is recorded as 2b. Parish
2
found 2b is smaller than 2b0 and further discussed the contact case of roller covered with a rubber layer of thickness H under plane strain condition. Based on the experiment, he proposed a solution that seeks the half contact width b in hard roller/rubber-covered roller according the relationship between
We use the Parish method to calculate the theoretical contact pressure value and compare it to the simulated ones. Parish proposed that the contact width 2b with a rubber layer can be obtained by the relationship between
The theoretical and simulated values of contact pressure were shown in Table 6. The displacement can be converted into the applied loading per unit length Q by extracting reaction force in ANSYS. According to the simulation results, we give an approximate conversion relationship of the force-compression displacement suitable for this work, as shown in equation (11)

Similar conversion relationship has been studied by Johnson and others. The relationship between the λ and Q of two cylinders’ contact problem is shown in equation (12)

where m is a constant and m = 1 in Johnson, 1 0.72 and 0.52 in Nakhatakyan. 19
Contact pressure at rolling speed 240 r/min.

The value range of m needs to be studied in the future. Even if equations (11) and (12) are highly similar, considering equation (11) to be a numerical relationship rather than the universally applicable theoretical derivation is more reliable and reasonable. The simulation results of contact pressure were obtained under the H-VEL constitutive model of rubber.
Table 6 shows the relative error of the maximum contact pressure in theoretical calculations and numerical simulations. It can be seen that the relative error is kept within an acceptable range under different conditions, which means that the simulation accurately describes the contact pressure. So the reliability of the simulation was verified by the experimental verification in “Result of dynamics analysis” section and the calculations here. In addition, the accuracy of the Parish method within the scope given in this work is also demonstrated.
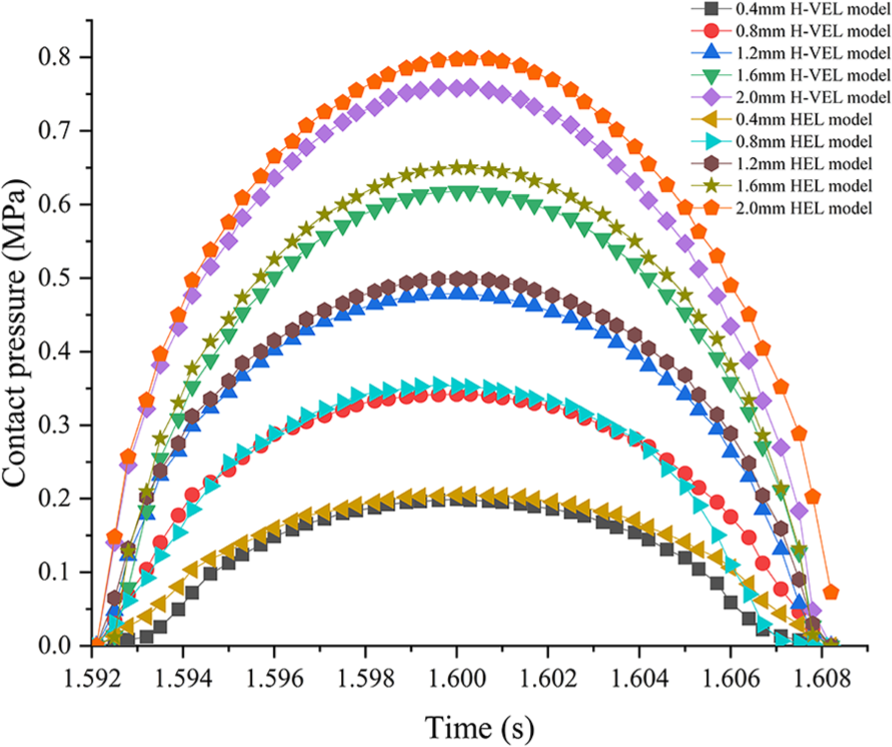
Figure 11 shows the change of contact pressure with time in different compression displacement and models. The circles in the Figure 11 present the moment where low peak of contact pressure occurs. The contact areas corresponding to these moments were the areas that were subjected to compression displacement at 0–1 s. When these areas reenter the contact zone during steady rolling time, it would show a low contact pressure. The reason for this phenomenon is that the area is loaded for a longer time and its deformation has not fully recovered in a certain time at the beginning of initial rolling compared to other areas of the rubber-covered roller.

Contact pressure during steady rolling time.
As shown in Figure 12, the distribution of contact pressure is revealed by the process of a node from entering to exiting the contact area. For the contact pressure, the calculation results of the two constitutive models present differences. The contact pressure of the HEL model that does not consider the viscoelasticity is larger than the value of H-VEL model. The differences of contact pressure for two models are shown in Table 7. It can be seen that the computing difference of two constitutive models is more obvious as the compression displacement increases. In actual structures such as offset printing and textile machines, it is often composed of a large amount of steel–rubber rollers, so this difference should be recognized and considered in the design if the contact problem is a key concern.
Contact pressure of the same node during passing the contact zone.
Discrepancy in contact pressure in H-VEL and HEL models.

H-VEL: hyperelastic–viscoelastic; HEL = hyperelastic.
Another significant difference between the two models is the “low peak” phenomenon. Under the HEL model, the contact pressure is stable and there is no low peak, while in the H-VEL model, a low peak appears. For the H-VEL model, longer run-time transient simulations were performed in the Workbench with compression displacement of 0.4 mm and rolling speed of 240 r/min. The results of contact pressure and the von Mises stress are shown in Figure 13: with the increasing number of times of rolling, the deformation of the rubber layer corresponding to the “low peak” gradually recovers and the contact pressure and von Mises stress become closer to the value of steady-state running.

Low peaks of contact pressure and the von Mises stress.
The time of static compression is also one of the influencing factors. Set a control group that static compression time is 2s, keeping the compression displacement 0.4 mm and rotation speed 240 r/min, the result was shown in Figure 14. Two groups experienced same acceleration time (0.2 s) and steady rolling time (1 s) while the only difference was static compression time. In order to easily present the difference, the x-axis in Figure 14 was set as the steady-state running time of 1 s instead of the time in time domain. Longer compression time causes the lower peaks more significant, which means longer time to return to the steady-state operating. Note that this is a case where the compression displacement is small. When the compression displacement becomes larger, the low peak should be more evident, so in the large-sized machinery containing rubber-covered rollers, a special attention should be paid to the low peak phenomenon caused by viscoelasticity.

Low peak of different static compression time.
As shown in Figure 15, the fact that the increase in contact pressure is not obvious with the increase in rolling speed may have the potential relation with the low friction coefficient. A low friction coefficient does not cause significant change in tangential contact state. In addition, since the roller is under dynamic rolling, the rolling friction coefficient may change. Jiménez et al. 20 studied this relationship and gave a mathematical method to calculate the dynamic friction coefficient.

Contact pressure at different rolling speeds.
Influence of working conditions and viscoelasticity
Different working conditions affect the properties of the rubber, which influences the mechanical and contact characteristics of the structure. The hyperelasticity of rubber determines its ability to resist elastic deformation. The increase in compression displacement means the increase in the applied loading. It is easy to understand the von Mises stress, the contact width and contact pressure become larger as the applied loading increases. Viscoelasticity is closely related to frequency, temperature, and time of loading action; in order to explain the effect of viscoelasticity, they are discussed separately.
Frequency: the increase in frequency makes the viscoelasticity to become more significant within the test frequency range of this article. It can be derived from the loss factor of experiment and the area of hysteresis loop in simulation. It is worth noting that viscoelasticity becomes only obvious at a certain range of excitation frequencies.
Time for loading: the von Mises stress and contact pressure increase as the time for loading decreases. The faster rolling speed shortens the residence time in the contact zone. The maximum of relaxation time is the time for loading, that is, the contact time. If it gets shorter, the attenuation of shear modulus gets more inconspicuous. When the rolling speed is large, the attenuation becomes small and the Young’s modulus is larger than that at a low rolling speed. The von Mises stress and contact pressure are related to the Young’s modulus. It can be derived from the contact theory that the increase in rolling speed causes the increase of them.
Temperature: the increase in temperature causes the equivalent Young’s modulus to decrease and the relaxation to accelerate, which have the opposite effect on the area of hysteresis loop, that is, the expression of viscoelasticity. A significant heat generation caused by rubber viscoelasticity occurs because of the long-term working. In general, the rise of temperature causes the decrease of relaxation modulus and the rubber becomes more “soft.” We know from WLF equation that if the frequency is same, the temperature rise would accelerate the relaxation of rubber. The decrease of modulus causes the hysteresis loop to reduce while the relaxation to increase. The rubber viscoelasticity during rolling needs to be reconsidered instead of relying solely on viscoelastic data given by DMA experiments.
Although the differences in materials, loads, and structure dimensions exist, in fact, the results obtained in this work can be used for other rolling contact situations, such as contact problems of tire-orbit, textile, and offset printing.
Conclusions
The main objective of this article is to research the rolling of steel and rubber-covered rollers in different working conditions, which are used in printing, sheet making, and packaging machine. The analysis of two-dimensional steel and rubber-covered rollers using viscoelasticity is presented by accurately defining materials, experimental verification, and analyzing data. The final conclusions are as follows:
For rubber-covered rollers, the viscoelasticity of nitrile rubber is affected by working conditions (compression displacement and rolling speed) and ultimately cause the changes in the mechanical characteristics of the structure. The increase in rolling speed and compression displacement causes the area of hysteresis loop enlarging, that is, the viscoelasticity of rubber becomes more pronounced.
The von Mises stress shows an increasing trend with increasing compression displacement and rolling speed. Different working conditions determine the change of relaxation time for rubber rollers in the contact zone and the recovery of deformation in the zero loading zone. Both of them are also related to the rubber viscoelasticity. The changes in material further affect the values of the von Mises stress and area of hysteresis loop.
The contact pressure increases with the increasing rolling speed and compression displacement while the contact width is mainly related to the compression displacement. After considering the viscoelasticity, the contact pressure and displacement showed different degrees of decline. Low peaks of contact pressure and the von Mises stress due to relaxation of rubber occur at the beginning of rolling, which is directly related to static compression time. The contact pressure gradually approaches the stable working value as the rolling time increases.
It is worth noting that the rise of temperature leads to changes in the properties of rubber, and the deformation and stress of the structure also change. This problem becomes a complex problem that requires consideration of temperature, material, and contact. The heat generation of rubber and change in friction coefficient were not considered in this work and the friction coefficient was set to a lower value. The related work will be further studied in the future.
Footnotes
Handling Editor: Michal Kuciej
Declaration of conflicting interests
The author(s) declared no potential conflicts of interest with respect to the research, authorship, and/or publication of this article.
Funding
The author(s) disclosed receipt of the following financial support for the research, authorship, and/or publication of this article: This work is financially supported by the National Natural Science Foundation of China (No. 51675010) and Science and Technology Project of Beijing Municipal Education Commission (No. KM201710005015).