
Abstract
Railway managers must have accurate assessments of railway track health to optimize maintenance and replacement scheduling and allocate resources reasonably. A model for railway track health evaluation, in which a continuous track line is divided into adjacent segments of the same length, referred to as track grids, is proposed in this study. A condition-evaluation index system for track grids was established, and deep autoencoder networks were used to reduce the dimensions of data on multiple condition measures. The set of all possible health features of the track grids was obtained using the hybrid hierarchical k-means clustering method. The tree-augmented naïve Bayes algorithm was employed to obtain the track grid health index and evaluate the overall health of the track grids. The proposed model was verified using measurement data from the Lanxin Railway in China. The proposed model was found to be superior to conventional health evaluation methods used in railway management in China. These results will enhance railway management knowledge and enable accurate determination of track health on a smaller spatial scale.
Introduction
A railway track is a structure composed of multiple components and is classified into two types: ballasted track and ballastless track. 1 Ballasted track consists of rails, sleepers, fasteners, and ballast. Slab ballastless tracks and double-block ballastless tracks are mainly used in China’s high-speed railways. Slab ballastless track consists of rails, fasteners, slab tracks, cement-emulsified asphalt mortar, and baseplates. 2
An important criterion for the scheduling of track maintenance and replacement (M&R) is the good-health status of the railway track. Inadequate evaluations of track health can lead to unreasonable scheduling of M&R activities. Scientific and comprehensive evaluation of track health based on multiple measurements is critical to M&R optimization.
For Chinese railways, the track quality index (TQI) is primarily used to evaluate track condition.3,4 The TQI is the total of the standard deviations of the following geometric defects over a 200-m-long section: gauge, cross-level, longitudinal level, alignment, and twist. In addition, the track quality rank (TQR) is currently employed by the China Railway Lanzhou Group Co, Ltd, to quantify track health. The TQR is defined based on the TQI and the numbers of local track geometry defects. In many European countries, the standard deviation of the number of longitudinal-level defects (in the short-wavelength range of 3–25 m) is the crucial factor considered in planning maintenance decisions.5–7 American railway managers usually use a track roughness index (TRI) to quantify track condition and also consider the traced lengths of curves in space and the theoretical lengths of track segments. Indian railway managers 8 employ a track geometry index (TGI) and also consider the standard deviations of unevenness, twist, alignment, and gauge.
Many researchers have proposed models to evaluate railway track health. El-Sibaie and Zhang 9 proposed a set of TQIs calculated over track segments for use in evaluating track condition. Track segments are classified into different classes, and the TQI thresholds are computed over each track class. Li and Xu 10 proposed an integral maintenance index (IMI) to evaluate track condition, and the maintenance history is considered in calculating this index. Li and Xiao 11 proposed a generalized energy index (GEI) that considers the influences of different-wavelength components of track irregularity on the vehicle dynamic response. Xu et al. 12 proposed an approach to track quality assessment based on the TQI and local track geometry defects. Shen et al. 13 proposed a comprehensive TGI for use in evaluating the track geometry condition as a function of the TQI, the rate of change of TQI, and local track geometry defects. Sadeghi et al. 14 proposed an improved track geometry index (ITGI) that is based on the standard deviations of track gauge, alignment, profile, track twist, and rail cant. Sadeghi 8 proposed an overall track geometry index (OTGI) that considers both the mean values and the standard deviations of various measures, as well as the track classification. Sadeghi and Askarinejad15,16 proposed a track structure index (TSI) based on measurements of defects of track components (such as rails, fasteners, and sleepers). Sadeghi et al. 17 proposed a geometry index based on ride comfort (RCTGI) to describe the condition of high-speed railway tracks in a way that passenger ride comfort was taken into account. Lasisi and Attoh-Okine 18 used principal component analysis (PCA) to combine track geometry parameters into a low-dimensional form without much loss of variability in the data.
In addition, many researchers have proposed models to estimate transportation infrastructure health. The American Association of State Highway Officials 19 proposed the present serviceability index (PSI) to express pavement serviceability (ride quality) as a function of the following four condition measures: slope variance, rutting, cracking, and patching. The pavement condition index (PCI), originally proposed by the US Army Corps of Engineers and later standardized by the American Society for Testing and Materials (ASTM), 20 is calculated as a function of the quantities and severities of various types of distress, such as various types of cracking and potholes. Haas et al. 21 employed the Delphi technique to evaluate pavement condition. Koduru et al. 22 employed fuzzy logic and expert system techniques to assess flexible pavement distress using measurements of transverse cracking, longitudinal cracking, reflection cracking, and rutting. Sun and Gu 23 proposed an approach that uses an analytic hierarchy process (AHP) and fuzzy logic theory to evaluate pavement condition. The international roughness index, deflection index, deterioration ratio, rut depth, and friction coefficient have all been used as condition indexes. The maximum grade principle and defuzzified weighted cumulative index have also been developed for use in pavement condition evaluation. Bianchini 24 proposed a fuzzy inference model to evaluate pavement condition using four condition measures—transverse cracking, non-wheel path cracking, wheel path cracking, and rutting—to calculate a pavement condition ratio. Liang et al. 25 proposed a fuzzy synthetic evaluation model to assess the conditions of existing reinforced concrete bridges. They employed the relative compressive strength ratio, relative carbonation depth, chloride ion content of concrete, and corrosion potential of steel in concrete as condition measures. Zhang et al. 26 proposed a fuzzy AHP-based synthetic model to evaluate the health of shield tunnels using three types of condition measures—environmental effects, structural responses, and degrees of corrosion—to obtain fuzzy synthetic evaluation indexes.
Previous studies related to the comprehensive evaluation of track health have been limited in one or more ways. Most experts and scholars have substituted a certain partial measurement of track health (such as the track geometry condition or track structural condition) for the comprehensive track health. In addition, most of the track condition indexes that have been developed have been used to evaluate track condition at a certain time. Research using condition indexes to evaluate track condition trends over time has been rare and has rarely used multi-perspective condition indexes for comprehensive evaluation of track health. Furthermore, scoring methods based on conventional assessment practices have been used for comprehensive evaluation of transportation infrastructure health. In these approaches, the relative weights of attributes are obtained by means of different methodologies, such as the Delphi technique, the AHP method, fuzzy logic, and expert systems. These methodologies are mainly based on engineering experience and expert judgments and thus may be subjectively influenced by biased assessments. The relative weights of attributes thus cannot be guaranteed to be objective. The rationality of the relative weights of attributes is directly related to the reliability of comprehensive track health evaluation.
In the method described in this article, a railway track line is divided into adjacent segments that are equal in length. Each segment is termed a track grid. A condition-evaluation index system for track grids is described and a data-driven model for health evaluation of track grids (DDM-HETGs) is proposed. The analytical mathematical model requires no predefinition. Machine learning models are employed to mine data on multiple condition measures deeply. Track health is thereby comprehensively evaluated, and a track grid health index (TGHI) value is obtained.
The main innovative contributions of the research described in this article are as follows. (1) a track condition–evaluation index system and TGHI are proposed to improve on existing condition index–based approaches to railway track health evaluation. (2) Track grids of the same length are used as the basic evaluation unit, and all condition index calculations are performed over this consistent track grid length. This is an improvement over other condition index calculation methods in which the length of track evaluated may be inconsistent. (3) By employing machine learning algorithms, data on multiple condition measures for track grids are deeply mined to obtain a TGHI for track grids. Track grids with similar health features are classified as being in the same cluster and have the same TGHI value. Different clusters of track grids have different health features and different TGHI values. The effect of subjectivity in the assessments of engineers and experts in evaluating track grid health is thereby effectively avoided.
The remainder of this article is structured as follows. The concept of track grids is explained in section “Condition indexes for track grids.” A data-driven model for evaluation of track grid health is presented in section “DDM-HETGs.” A validation of the proposed model conducted using actual measurement data is presented in section “Empirical analysis.” Our conclusions are presented in section “Conclusion.”
Condition indexes for track grids
Condition-evaluation index systems for track grids
A continuous railway track line is divided into adjacent segments, termed track grids, of the same specified length. 27 Each track grid consists of the rail, sleepers, fasteners, ballast, and so on. The length of a track grid was defined as 200 m in this study. The condition of a track grid depends on the condition of each of the track components in the track grid. A condition-evaluation index system for track grids should be designed from the perspective of evaluating the overall performance of all track components in the track grid. The corresponding condition-evaluation index system may differ for different types of railway lines.
In conventional Chinese practice, track regularity indexes are substituted for track health evaluations. However, these indexes are only partial measurement of track health. Condition-evaluation index systems for track grids have been proposed from four perspectives: functional performance, structural fitness/integrity, safety, and aesthetics. Various indexes and measures used in evaluating track grid condition from each of these perspectives are listed below.
Functional performance: extreme values and standard deviations of geometric features (such as the surface, alignment, gauge, cross-level, and twist),
28
TQI,3,4 rate of change of TQI,
Structural fitness/integrity: total number of rail defects, total number of ballast defects, total number of sleeper and fastener defects, TSI, 15 and so on.
Safety: hazard rate, 32 actual service life, 33 average failure rate, rate of change of failure, mean time between failures, concentration rate of failure, repetition rate of failure, mean time between M&R, and so on.
Aesthetics: cleanliness rate of rail surface, contamination rate of ballast, contamination rate of sleepers and fasteners, and so on.
Condition indexes based on these four perspectives can be used to evaluate not only multiple aspects of track condition at a certain time but also trends in those aspects of track condition over time. The calculation methods for these condition indexes were redesigned in this study. All of the condition indexes are calculated over a 200-m track grid length. All of these condition indexes can be calculated using measurement data and M&R data.
TGHI
The TGHI is proposed for use in comprehensive evaluation of track grid health, as shown in equation (1). TGHI

where
DDM-HETG
Algorithm flow of the DDM-HETG model
The DDM-HETG model is composed of two parts: a health features identification sub-model for track grids and a health features classification sub-model for track grids. The algorithm flow of the DDM-HETG model is outlined as follows and illustrated in Figure 1.
Step 1: Identify the health features of the track grids. Deep autoencoder networks (DANs) are employed to reduce the dimensions of multiple condition indexes of track grids and construct low-dimensional new condition indexes. The hybrid hierarchical k-means clustering (HHKMC) method is used to identify the TGHI domain. The TGHI values of the track grid samples are obtained.
Step 2: Create a health features classifier for the track grids. Using the calculated results obtained in Step 1, the tree-augmented naïve Bayes (TAN) algorithm is employed to identify possible underlying relationships between multiple condition indexes and the corresponding TGHI of the track grids.
Step 3: Evaluate the TGHI of the track grids. Based on Step 2, the updated TGHI values of the track grids can be obtained quickly and directly when updated measurement data are obtained.
Steps 1 and 2 are parts of the learning phase of the DDM-HETG model. Step 3 belongs to the classification phase of that model.

Algorithm flowchart of the DDM-HETG model.
Health features identification sub-model for track grids
DANs
Section “TGHI” presents the multiple condition indexes of track grids. These different condition index data items may exhibit high correlations. The reasons for this are as follows. First, different condition indexes may repeatedly measure the same aspect of health features. Second, the measurement data from different inspection methods may repetitively describe the same track defects.
In the DDM-HETG model, DANs 34 are employed to reduce the dimensions of the data for multiple condition indexes, compress the information associated with multiple condition indexes, and construct new condition index data. Figure 2 is a structure map of a certain DAN. The DAN in the figure consists of seven layers. The squared columns in the layers represent neurons. The dashed line represents the connection between the neurons in the different layers. An adaptive multilayer encoder network is used to encode high-dimensional data to low-dimensional code. The low-dimensional code is reconstructed and recovered by a similar decoder network. These two networks are initialized with random weights, and these weights are trained by minimizing the differences between the original data and the corresponding reconstructed data. A chain rule is used to calculate the gradients and update the weights of the networks. The dimensionality-reduction performance of the DAN is better than that of the PCA method.

Structure map of a certain deep autoencoder network.
HHKMC method
Health evaluation of track grids must consider multiple condition indexes comprehensively. In conventional practice, the relative weights of different condition indexes are determined based on engineering experience and expert judgment. As a result, they are easily affected by bias in the judgments of engineers and experts.
In the DDM-HETG model, the HHKMC method is used to classify the track grids based on health feature similarities using the new multiple condition indexes resulting from the previously described DAN method. Track grids with similar health features, such as a high number of defects, are classified as being in the same cluster. Track grids with rapidly changing defect trends are also classified as being in the same cluster. Track grids in the same cluster have the same TGHI value. The silhouette method 35 is used to ascertain the number of clusters of track grids and the TGHI domain. The silhouette coefficients, which correspond to different numbers of clusters, are calculated. The number of clusters that maximizes the silhouette coefficient is selected as the final number of clusters.
The HHKMC model has two main procedures. First, initial track grid clustering is performed using the hierarchical clustering method. Then, the initial clustering of the track grids is improved using the k-means clustering method. 36 The result obtained is the final track grid clustering solution. The optimal number of track grid clusters will vary for different railway lines. The optimal number of clusters is determined by the number of track grids researched and the multiple condition indexes data of the track grids. Factors such as railway line length and line type affect the optimal number of clusters. The length of the railway line directly affects the number of track grids researched. Due to the influence of many heterogeneous factors, large differences exist with regard to the health condition of track grids at different mileage locations. The number of track grids researched affects the optimal cluster number. The type of railway line directly affects the selection of the corresponding condition-evaluation system for the track grids as well as the values of these condition indexes.
Health features classification sub-model for track grids
Track health changes as the time in service increases. After each railway track inspection activity, managers must re-evaluate the track health as soon as possible, based on the updated measurement data. Track degradation is generally characterized by memorability,37,38 which means that track segments located in the same locations along the railway line have similar degradation rules after each maintenance activity. Using historical multiple condition indexes data on track grids, the set of all possible health features of the track grids can be obtained. The set obtained contains the future track grid health features, owing to memorability.
In the DDM-HETG model, the TAN algorithm is employed to deeply mine the historical multiple condition index data on track grids, whose TGHI values are known as an output of the previous steps. Possible underlying relationships between condition indexes and the corresponding TGHI values of the track grids are identified. Thus, the updated TGHI values of the track grids can be obtained quickly and directly on the basis of on the underlying relationships that are identified when updated measurement data are obtained.
The variable denotations in the TAN model are outlined below.

TGHI: track grid health index.
If M condition indexes

where
Based on the Bayesian criterion of maximizing the posterior probability,

The probability distribution of TGHI being
In the SuperParent algorithm, orphan
Step 1: Initialize the naïve Bayes model for health evaluation of track grids.
Step 2: Estimate the classification accuracy of the current model.
Step 3: Strive to make each node
Step 4: Add the arcs from

Assume that
If

If

Empirical analysis
Overview
The Lanxin Railway line runs between Lanzhou and Urumqi in China. It is a railway servicing mixed traffic (passengers and cargo) and is an important part of the New Eurasian Land Bridge. The portion of the Lanxin Railway from kilometer markers 548 to 985.6 consists of 60 kg/m rails, concrete sleepers, and ballast beds. Inspection data for this section of the railway tracks were gathered in March 2016. In this study, 893 track grids were considered. The TGHIs of these track grids were examined to verify the proposed evaluation model. Because of limitations of the data gathered, eight condition indexes and measures
Selected condition indexes and measures for track grids.
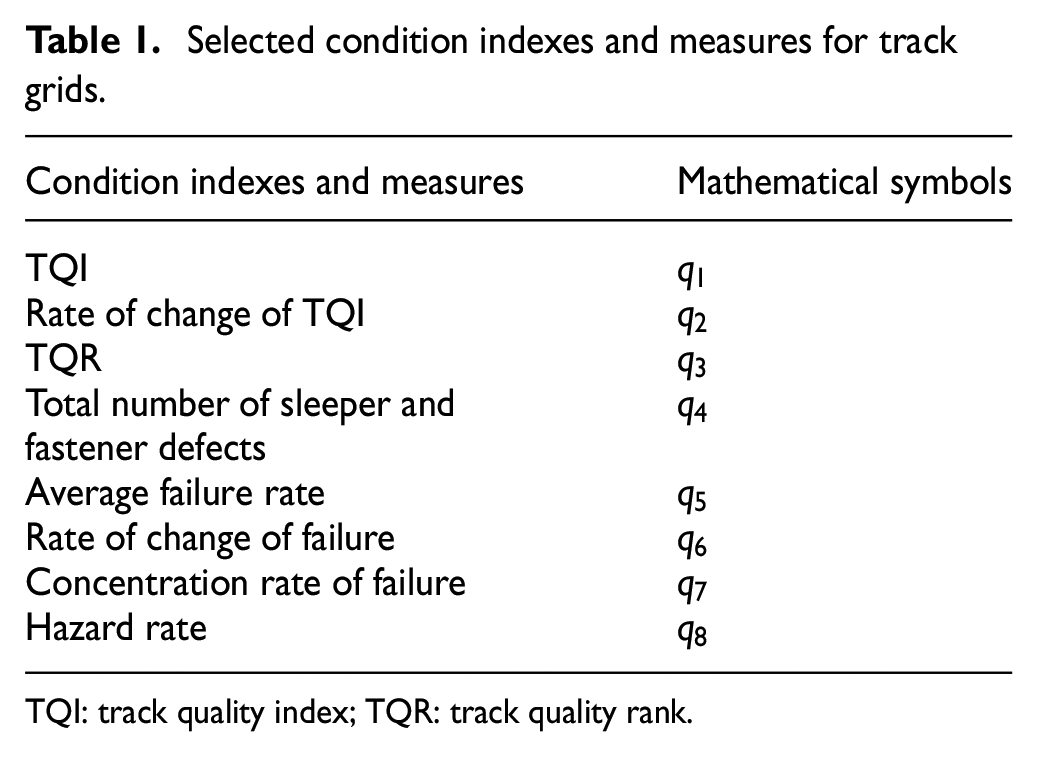
TQI: track quality index; TQR: track quality rank.
Analysis of results
Health features identification
The DDM-HETG model was implemented using the R software.40–42 For the condition indexes,

Structure of the deep autoencoder network in the empirical analysis.
The relationship between the number of clusters and the silhouette coefficients is shown in Figure 4. The silhouette coefficients, which correspond to different numbers of clusters, are compared. The silhouette coefficient is the largest, and the clustering result is the best, when the number of clusters is five. Therefore, the health features of 893 track grids, between 548 and 985.6 km on the Lanxin Railway were classified into five clusters, with
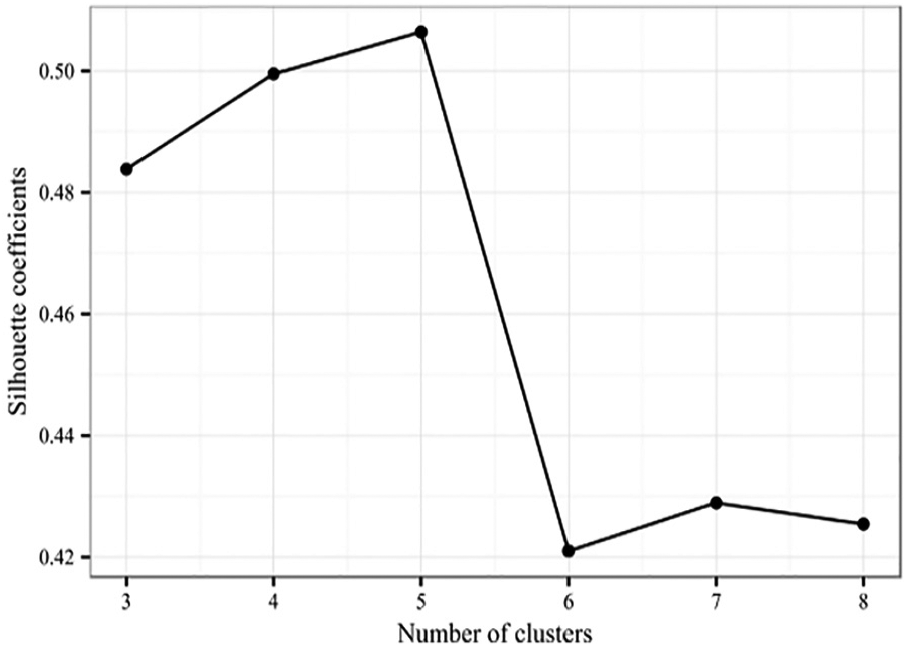
Relationship between silhouette coefficients and number of clusters.
Based on the new condition indexes

Clustering maps for health features of track grids in Lanxin Railway using different methods: (a) DAN-based clustering map for health features of track grids in Lanxin Railway and (b) PCA-based clustering map for health features of track grids in Lanxin Railway.
The new condition indexes
The PCA-based clustering map for health features of the track grids along the study portion of the Lanxin Railway is shown in Figure 5(b). A comparison of Figure 5(a) and (b) shows that better clustering performance is illustrated in Figure 5(a). The boundaries between different health features are clearer, and track grids with different health features are more separate in Figure 5(a). These observations indicate that the dimensionality-reduction performance of the DAN-based method is better than that of the PCA-based method.
The TQR is currently employed by the China Railway Lanzhou Group Co, Ltd, to evaluate track health. Standards and definitions for the TQR are shown in Table 2. The TQR is defined based on the TQI and the numbers of local track geometry defects. The TQR is divided into four condition ranks. The higher the condition rank, the worse the track quality.
Standards and definitions for TQR.
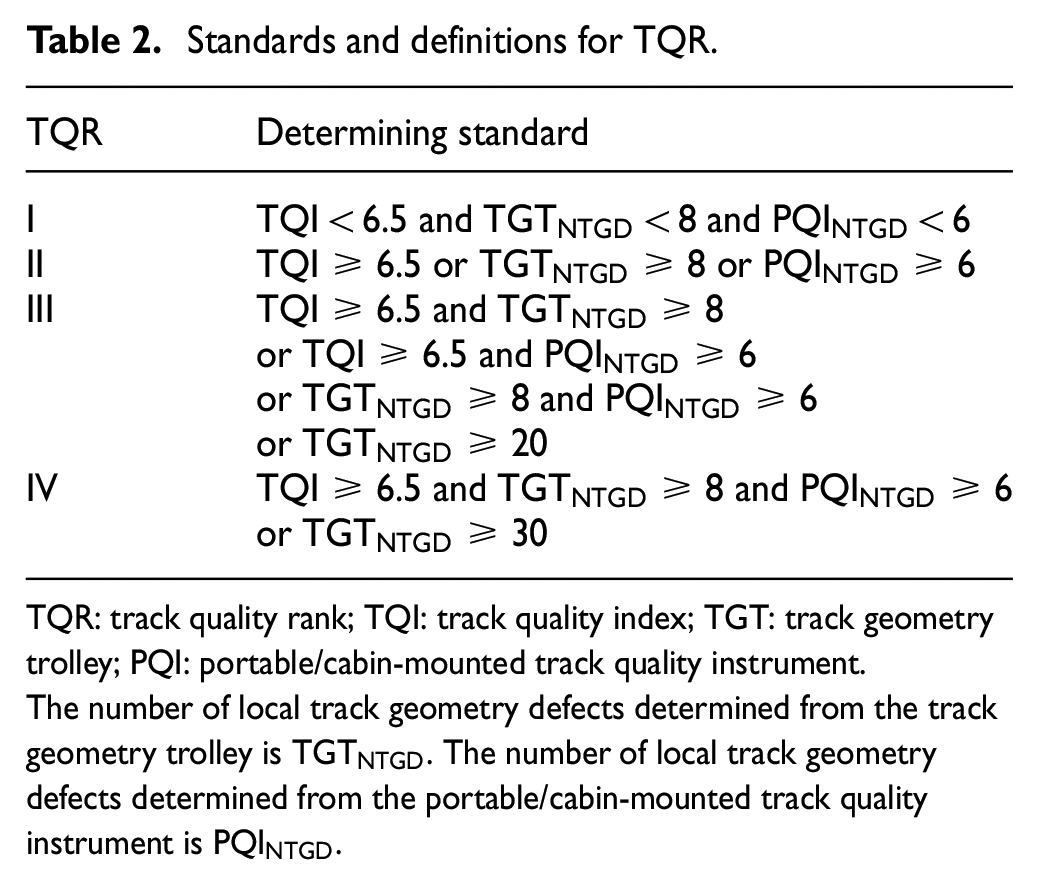
TQR: track quality rank; TQI: track quality index; TGT: track geometry trolley; PQI: portable/cabin-mounted track quality instrument.
The number of local track geometry defects determined from the track geometry trolley is
To validate the proposed model, the TGHI of the track grids and the TQR were compared. The confusion matrix used to compare the TQR and the TGHI of the track grids is shown in Table 3. The elements in the matrix represent the number of track grids, where the TQR is the row and TGHI is the column. The main diagonal elements represent the number of track grids for which the TQR equals the TGHI.
Confusion matrix for the TQR and TGHI of track grids.
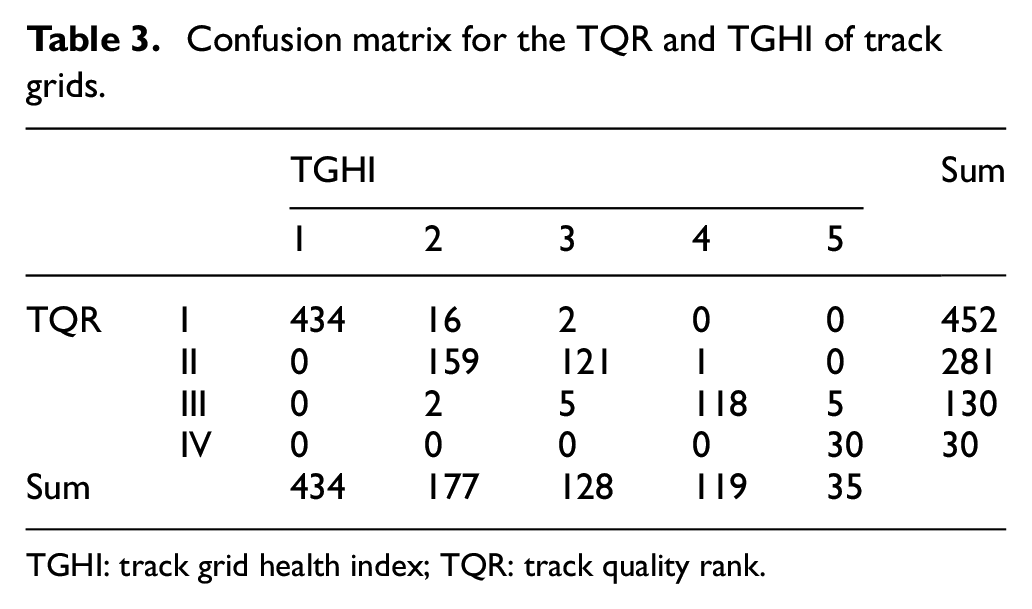
TGHI: track grid health index; TQR: track quality rank.
The scatter plot of the TQR and TGHI of the track grids is shown in Figure 6. The horizontal axis represents condition variable

Scatter plot of the TQR and TGHI of track grids.
The following conclusions can be drawn from the results presented in Table 3 and Figure 6. When the TQR of the track grids is I, the corresponding TGHI of the track grids is mainly 1. When the TQR of the track grids is II, the corresponding TGHI of the track grids is mainly 2 or 3. When the TQR of the track grids is III, the corresponding TGHI of the track grids is mainly 4. When the TQR of the track grids is IV, the corresponding TGHI of the track grids is mainly 5.
Thus, the health evaluation results for the track grids using the TQR and TGHI are basically in agreement. When the TGHI of the track grids is five, the health of the track grids is the poorest. When the TGHI of the track grids is one, the health of the track grids is the best. The main difference is that the track grids having a TQR of II mainly correspond to the track grids having a TGHI of 2 or 3. Based on the TGHI, the health features of the track grids having a TQR of II were further subdivided into two classes.
This indicates the following: (1) based on the analysis of the actual data from the Lanxin Railway, the currently used TQR can be further improved. (2) The proposed TGHI is used to categorize the health condition of track grids, which could help improve railway management. Limited maintenance resources could be allocated properly. Maintenance decisions would become more targeted. Excess maintenance or insufficient maintenance would be reduced. Thus, the proposed technique allows the TGHI to better describe the health of track grids.
Health features classification
Possible underlying relationships between the
Ten-fold cross-validation was performed to verify the DDM-HETG model. The true-positive rate with the DDM-HETG model was 0.932. The false-positive rate was 0.017. The precision was 0.933, and the recall was 0.932. The kappa statistic 43 was 0.901. These results indicate that the DDM-HETG model performed well in the TGHI evaluation of the track grids. The confusion matrix used to compare the evaluated and actual TGHI values is shown in Table 4. The elements in the matrix represent the number of track grids, where the actual TGHI is the row and the evaluated TGHI is the column. The main diagonal elements represent the number of correctly evaluated track grids.
Confusion matrix for the evaluated and actual TGHI of track grids.

TGHI: track grid health index.
A scatter plot of the evaluated and actual TGHI values is shown in Figure 7. The horizontal axis represents the actual TGHI, and the vertical axis represents the evaluated TGHI. Points in different colors represent the track grids that have different actual TGHI values. Points of different shapes represent the track grids that have different evaluated TGHI values.
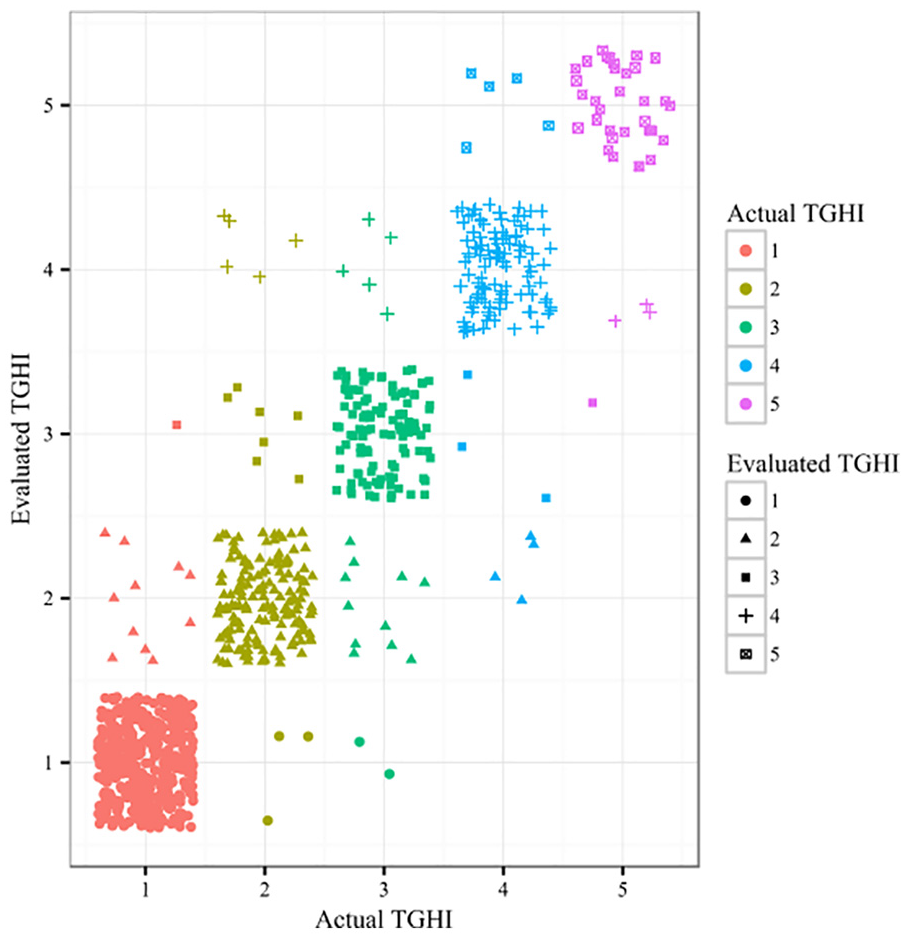
Scatter plot of the evaluated and actual TGHI of track grids.
The following conclusions can be drawn from the results presented in Figure 7 and Table 4. The main diagonal elements are large numbers, and the majority of the track grids are correctly evaluated. This indicates that the DDM-HETG model can accurately evaluate the TGHI of track grids. In addition, the number of false positives for different TGHI evaluations with the DDM-HETG model is known. For example, the number of false positives for the evaluation of the actual TGHI = 1, are, in descending order, TGHI = 2 and TGHI = 3.
Receiver operating characteristic (ROC) curves 44 for the DDM-HETG model are shown in Figure 8. The horizontal axis represents the false-positive rate. The vertical axis represents the true-positive rate. Different colors of the ROC curves represent different TGHI values. The red, brown, green, blue, and purple lines represents the ROC curves for TGHI values of 1, 2, 3, 4, and 5, respectively. The area under the receiver operating characteristic curve (AUC) for different TGHI values is shown in Table 5. The ROC curve peak is higher, and the AUC is larger at the upper left, which indicates superior classification performance. Table 5 and Figure 8 indicate that the performance is the best among the five cases when evaluating a TGHI value of 1. The performance is the worst among the five cases when evaluating a TGHI value of 2.

ROC curves obtained with the DDM-HETG model.
AUC obtained with the DDM-HETG model.

TGHI: track grid health index; AUC: area under the receiver operating characteristic curve.
In summary, the main advantages of the DDM-HETG model are as follows: (1) compared to the TQR used by the China Railway Lanzhou Group Co, Ltd, the TGHI performs better at comprehensively evaluating track grid health. (2) Using the DDM-HETG model, the updated TGHI of track grids can be obtained quickly and directly using updated measurement data. The success rate obtained for this case study was 93.2%.
Conclusion
In the railway track health condition–assessment approach proposed in this study, a railway track line is considered to be split into adjacent track grids of uniform length, and the track grid is used as the track health–evaluation unit. The proposed condition-evaluation index system for track grids reflects four perspectives in a multi-perspective evaluation: functional performance, structural fitness/integrity, safety, and aesthetics. Redesigned calculation methods for these condition indexes are used to calculate the values of these indexes over the length of track grids. On this basis, a DDM-HETG is proposed. Using DANs and an HHKMC method, a health features identification sub-model for track grids was established to obtain the set of all possible health features of track grids. Using the TAN algorithm, a health features classification sub-model for track grids was established to quickly determine the TGHI of track grids. This approach yields a quick and comprehensive evaluation of the health of track grids.
The proposed model enables accurate assessment of track health on a small spatial scale by railway managers. The results can help managers determine the maintenance priority of track grids in the future and provide decision-making support for optimal scheduling of comprehensive and centralized maintenance. If a certain partial measurement of track health is substituted for the comprehensive track health, managers may misjudge the poor track segments, resulting in inappropriate selection or scheduling of maintenance activities, such as excess maintenance or insufficient maintenance. The consequences of these may be improper allocation of limited maintenance resources. Track health changes over time in service. Using measurement data that are updated after inspection activities, the proposed model can quickly re-evaluate the track health to better meet the information needs of managers.
The proposed model was verified using actual measurement data collected over a length of more than 400 km (kilometer markers 548 to 985.6) along the Lanxin Railway. The results show that the model performed well in the track health evaluation and facilitated a quick re-evaluation of the TGHI based on the latest measurement data. An accuracy rate of 93.2% was achieved.
The proposed model has some applicability to other linear assets, such as roads and pipelines. However, the TGHI does not have a physical meaning and does not describe the relationship between track health condition and corresponding maintenance activities. The proposed model does not address the scheduling of maintenance activities. For a certain track grid, it is necessary to analyze the data of each condition index of that grid in order to facilitate detailed maintenance scheduling. This aspect will be studied and incorporated in a future paper. Based on the research results, the authors will attempt to use more measurement data to further validate the TGHI model. The TGHI model will be compared with other models proposed by other researchers to further improve the TGHI model. Taking safety and cost into consideration, the thresholds for railway track health management activities will be studied to optimize track M&R planning.
Footnotes
Appendix 1 Acronyms
The expansions for the acronyms used in the paper appear below.
AHP Analytic hierarchy process
AUC Area under the ROC curve
DAN Deep autoencoder networks
DDM-HETG Data-driven model for health evaluation of track grids
GEI Generalized energy index
HHKMC Hybrid hierarchical k-means clustering
IMI Integral maintenance index
ITGI Improved track geometry index
M&R Maintenance and replacement
OTGI Overall track geometry index
PCA Principal component analysis
PCI Pavement condition index
PSI Present serviceability index
RCTGI Geometry index based on ride comfort
ROC Receiver operating characteristic
TAN Tree-augmented naïve Bayes
TGHI Track grid health index
TGI Track geometry index
TQI Track quality index
TQR Track quality rank
TRI Track roughness index
TSI Track structure index
Handling Editor: James Baldwin
Declaration of conflicting interests
The author(s) declared no potential conflicts of interest with respect to the research, authorship, and/or publication of this article.
Funding
The author(s) disclosed receipt of the following financial support for the research, authorship, and/or publication of this article: This work was supported by the National Key R&D Program of China (grant no. 2017YFB1200700), the National Natural Science Foundation of China (grant no. 51578057), and the Beijing Postdoctoral Research Foundation (grant no. ZZ2019-116).