
Abstract
The aim of this work is to develop thermal modeling of the olive mill wastewater drying process in a greenhouse solar dryer. A configuration was thus proposed and simulated using the commercial software COMSOL Multiphysics in order to solve the conservation equations governing our problem. The resulting simulations are used to evaluate the temperature, velocity, and vapor mass fraction distributions after hours of sunshine and to provide a quantification of the drying process. The influence of the greenhouse effect on the drying kinetics is highlighted by comparing to open sun-drying results. The effect of some greenhouse geometric characteristics and external meteorological conditions are studied.
Introduction
Olive oil production is widespread throughout the Mediterranean region and in the Middle East. Over the last few years, Tunisia has become the world’s second-largest producer 1 and exporter2,3 of olive oil after Spain. Thus, the olive oil industry plays a key factor in its economic, environment, and social life. However, olive oil extraction processes, either traditional press extraction or continuous three-phase decanter ones, generate a large quantity of an aqueous waste called “olive mill wastewater” (OMWW). This effluent includes used water in different stages of the oil extraction process, olive juice (or olive vegetation water), and small amounts of unrecoverable oil and fine olive pulp particles.
OMWW can be applied to soil as an organic fertilizer thanks to its high nutrients concentration mainly potassium, magnesium, and phosphate salts.4,5 Whereas, negative effects are related to its high acidity and its large supply of organic contents, mainly phytotoxic polyphenolic compounds,6,7 with a high chemical oxygen demand (COD; up to 220 g/L) and biochemical oxygen demand (BOD; up to 100 g/L) values. 8 Many authors9–11 have studied its discharge without pretreatment. They showed that it may cause severe environmental problems such as surface and groundwater contamination and can affect the whole ecosystem. Therefore, the pretreatment of this hazardous waste is considered as a key stage to produce a manageable end product.
Several treatment processes using physical (centrifugation, ultrafiltration, 12 etc.), chemical (flocculation, 13 chemical oxidation, 14 etc.), thermal (evaporation, 15 distillation, 16 etc.), biological (aerobic, 17 anaerobic degradation, 18 etc.), and combined technologies have been suggested.19,20 However, most of these techniques present some technical and financial limitations that make their implementation, in favorable conditions, difficult. A particular interest is given to thermal treatment due to OMWW’s high moisture, which decreases its calorific value and affects its valorization. 21 Currently, evaporation is the most common treatment process where OMWWs are evacuated in storage ponds and evaporated under the open air.15,22 Despite its low-cost investment and favorable climatic conditions in Tunisia and other olive-growing countries, this method leads to many problems such as bad odor, insect proliferation, and infiltration.
Solar drying seems to be an effective technique as it uses the clean and free sun’s energy.23–25 Only a few studies have focused on the solar drying of OMWW at low temperature. Potoglou et al. 16 showed the applicability of a solar distiller, at laboratory scale, for the drying of OMWW and the removal of COD and other chemicals from it.
The experimental results were employed as inputs in a mathematical model for the same purpose. Sklavos et al. 26 studied the simultaneous OMWW solar drying and the recovery of selected phenolic compounds. Two experiments were carried out to show the role of thermal insulation on increasing the performance of the solar distillation unit. The qualitative and quantitative characteristics of the distillate were investigated. Chakir et al. 27 compared the drying performance of the open sun and greenhouse drying (for natural and forced convection) of OMWW. Greenhouse drying showed its efficiency to make this waste ready for valorization and utilization as a fuel. Recently, Galliou et al. 28 examined a novel treatment for OMWW combining greenhouse solar drying and composting. During solar drying, swine manure was used to avoid crusting on the sludge surface and to provide sufficient porosity. The resulted OMWW sludge was rich in nutrients and organic matter but still contained an important quantity of phenols. To detoxify it, grape marc was used as a bulking agent during composting in order to obtain a valuable product for agriculture use.
Modeling a solar drying process is a complex problem including simultaneous heat and mass transfer. Several studies trying to model this process have been developed.29–32 Because of its potential efficiency in process optimization, the development of adapted numerical simulations plays a significant role. 33
This article presents a numerical investigation of a simple and low-cost technique for the treatment of OMWW which consists in the use of greenhouse solar drying. A model was formulated to simulate temperature, velocity, vapor mass fraction, and consequently the evaporated liquid quantity. Then, different configurations were proposed and simulated to optimize the drying process.
The geometry of the computational area
Figure 1 presents the considered system which consists of a horizontal greenhouse dryer where the upper wall is transparent to the solar radiation.
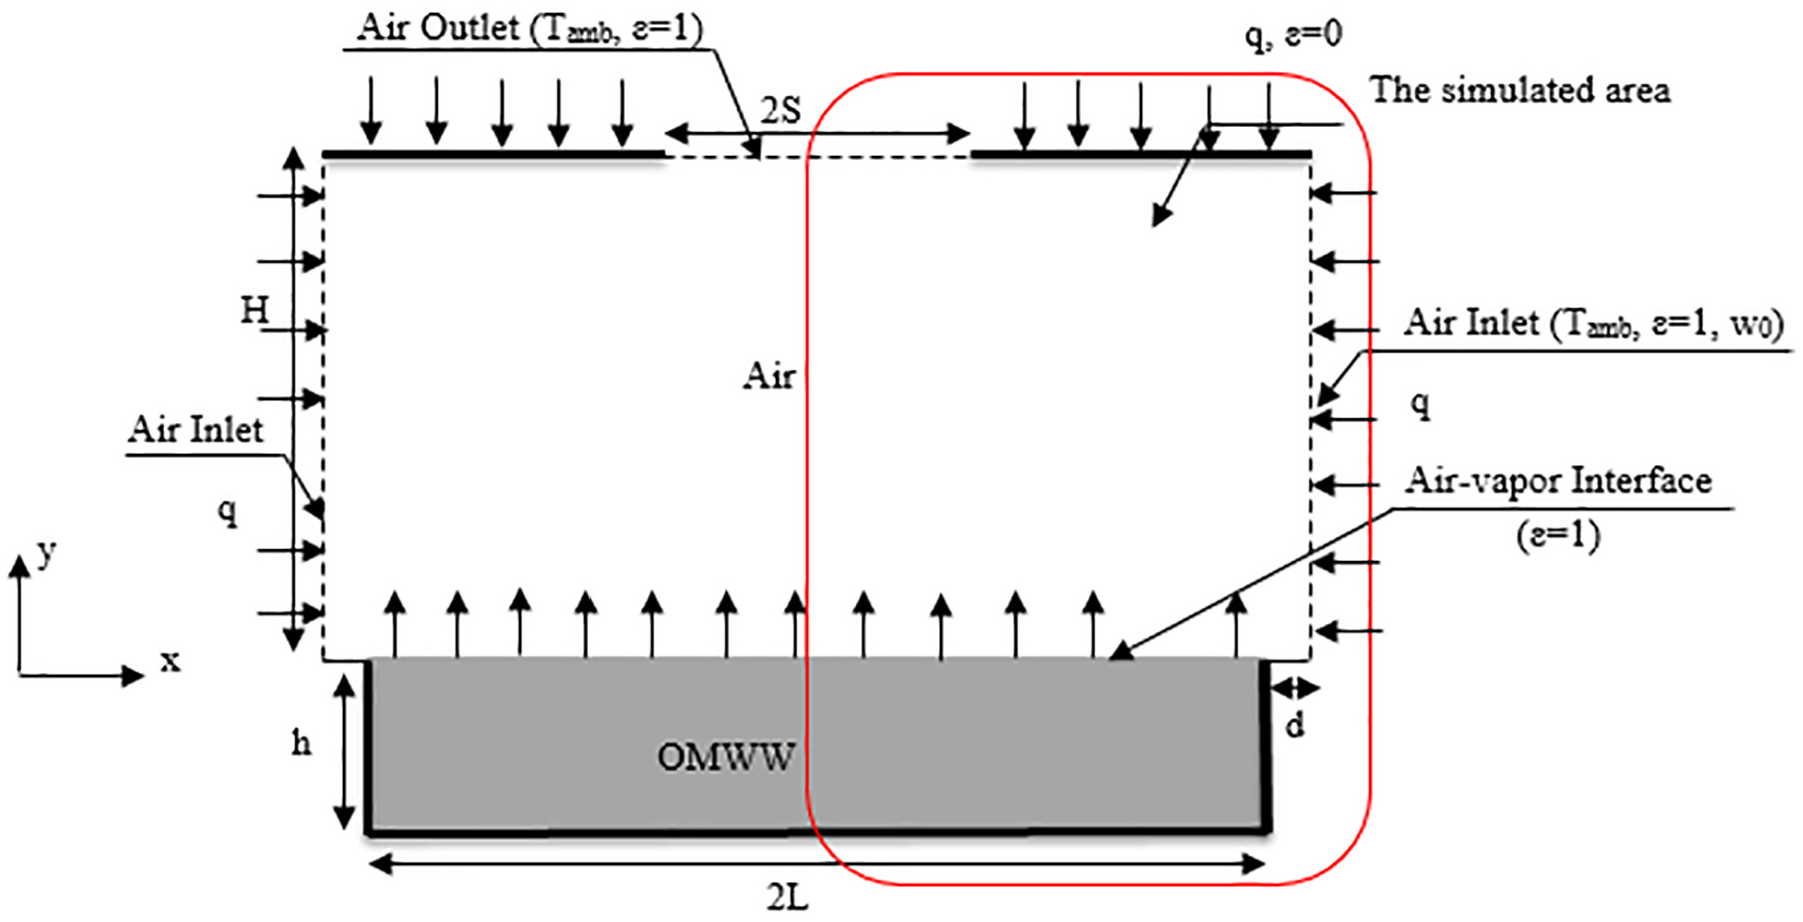
The geometry of the simulated area.
Coupled heat and mass transfer problems require important calculation time. Therefore, the modeled geometry is simplified as far as possible using physical justification. The proposed geometry is assumed to be two-dimensional (2D) and symmetric to the axis projecting from the center of the curve and perpendicular to the liquid surface. In this way, the computational process is considerably accelerated allowing studying a higher number of cases.
Mesh
The problem equations were numerically solved by means of a finite element method used in the commercial software COMSOL Multiphysics. An unstructured triangular mesh was generated. High grid densities are applied in the regions where most of the heat and mass transfer phenomena are expected to occur. Hence, the mesh is locally refined in the air-OMWW interface so that the evaporated liquid mass and the different transferred heat flux are predicted more accurately.
Sensitivity tests were performed and computations were repeated with four mesh grids having different element densities (Table 1). The total evaporated mass obtained with the tested mesh grids, represented in Figure 2, show that the mesh no. 3, illustrated in Figure 3, gives good accuracy.
The different tested meshes with their domain and boundary for L = 0.6 m, H = 0.4 m, h = 0.2 m, d = 0.01 m, and S = 0.05 m.

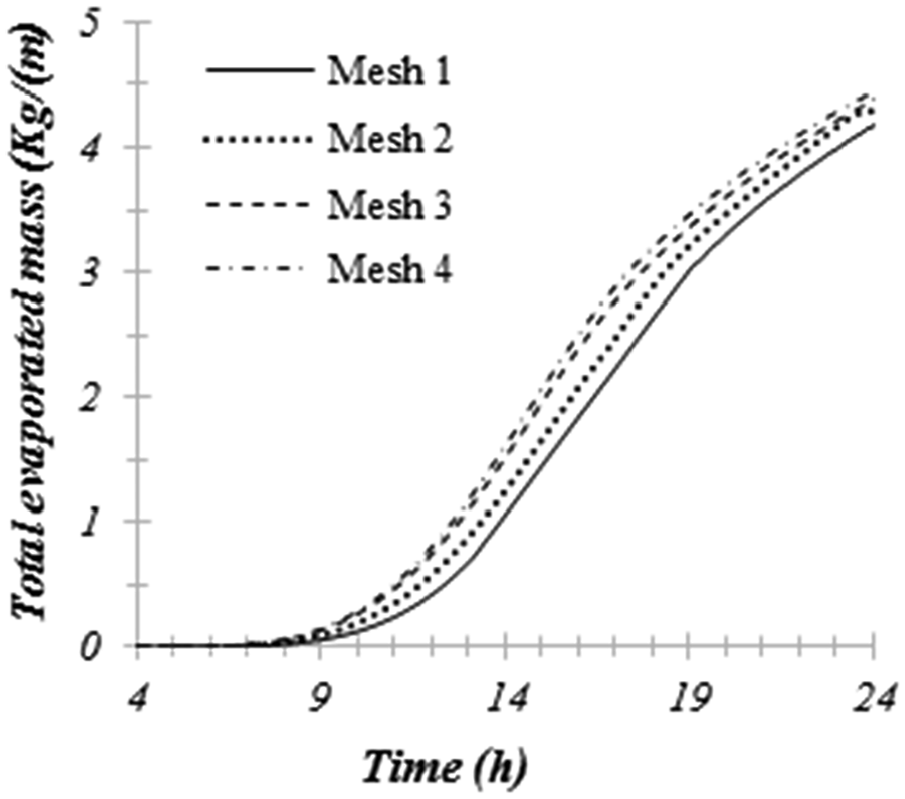
Total evaporated mass obtained with the tested mesh grids.

COMSOL computational mesh.
Method
The heat and mass transfer were coupled using the Dumped Newton Method. The Backward Differentiation Formula (BDF) solver was chosen for the time stepping.
In the first part of this study, the proposed dryer pond was fulfilled with OMWW. A typical hot day was considered for the month of July with an average temperature of 304 K and a solar radiation reaching 850 W/m2 as shown in Figure 4. The temperature, the velocity, the vapor mass fraction, and the evaporated liquid mass are simulated. In the second part, a parametric study was introduced. All the parameters are fixed and one of the input parameters, either a greenhouse geometric characteristic or an external meteorological condition, is varied. The simulations were run and the evaporated liquid mass was plotted as a function of each parameter to emphasize its effect on the thermal performance of the solar and sun drying.
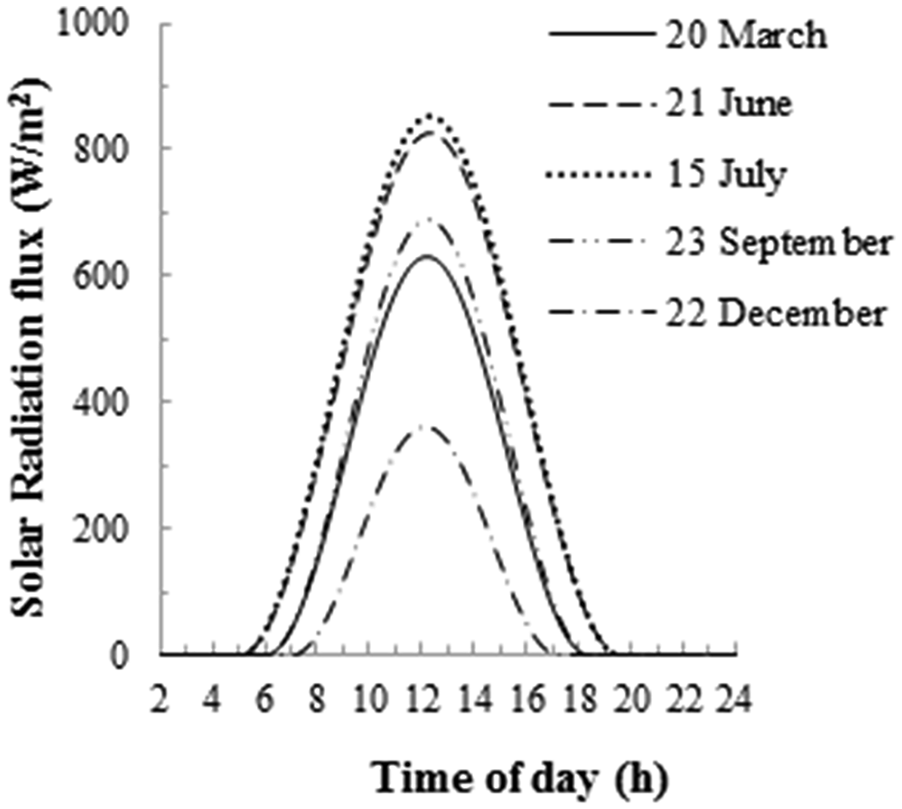
Monthly average variation of solar radiation for the city of Sfax.
The meteorological data were collected and calculated using data related to Tunisian meteorological conditions, exactly of the city of Sfax, which is considered as one of the largest olive production areas (latitude: 34.44° N, longitude: 10.46° E)34,35 (Figure 4).
Material
Some OMWW properties (viscosity, thermal conductivity, heat capacity, etc.) are not available in the literature due to the wide variety of OMWW composition which depends on the extraction process and on the agricultural specificities. Since previous studies 36 have indicated that OMWW has about 95% moisture content, the water properties will be considered. Physical properties of humid air are regarded as dependent on temperature and composition. 37
Mathematical modeling
Conservation equations
The drying process involves coupled heat and mass transfer. For its modeling, it is necessary to solve the conservation equations for both air and OMWW. In order to simplify the problem, some assumptions are made:
The dried product (OMWW) is Newtonian and incompressible.
The humid air is an ideal gas.
The air-OMWW interface is a black surface at local thermodynamic equilibrium.
All the solar radiations are transmitted to OMWW. 38
The air inlet and outlet are black and diffuse surfaces.
In the OMWW equations, the Boussinesq approximation was adopted.
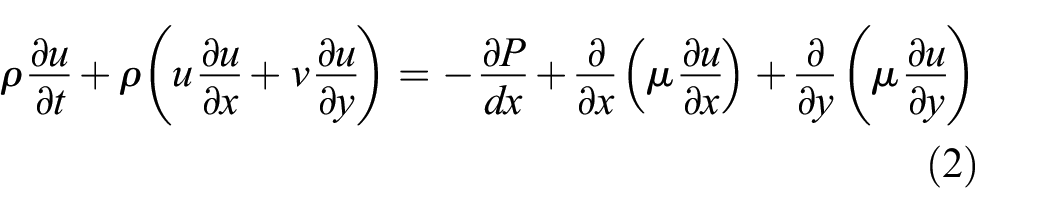
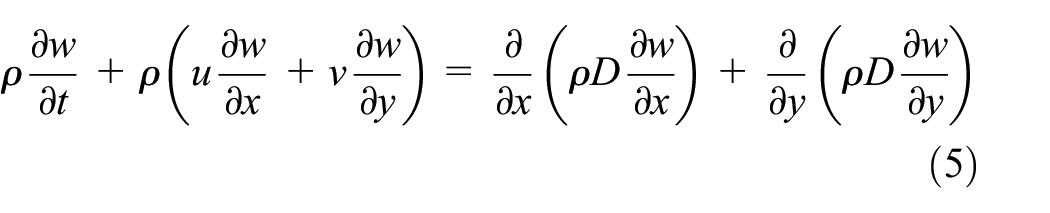
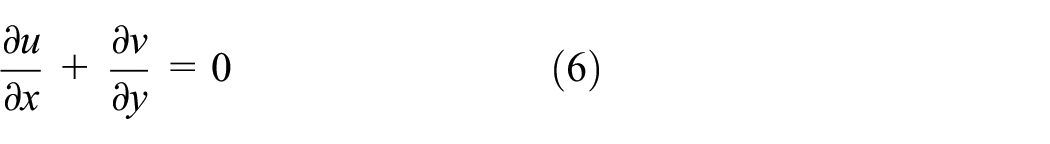
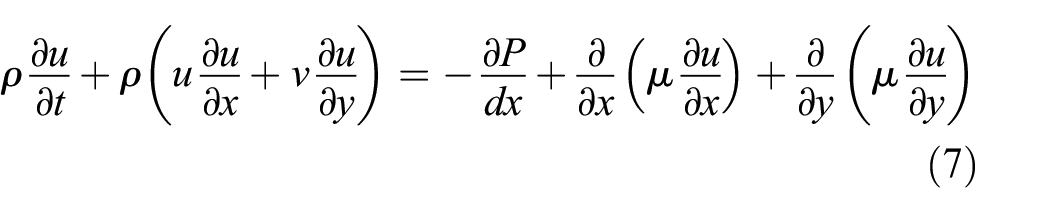
Hence, the mass, momentum, energy, and species diffusion conservation equations are written in 2D configuration as follows:
For the air

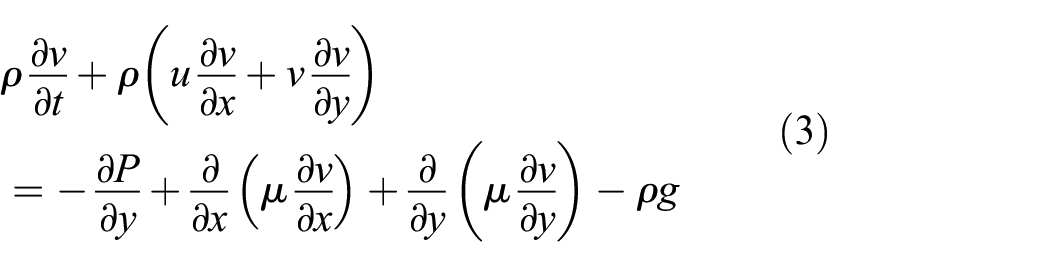

For the OMWW


The mass transfer can be considered as controlled by the diffusion. Therefore, the interfacial evaporating mass flux is assessed by Fick’s law as expressed in the following equation

The Charles Edwards and Acock model for the solar radiation flux density Qsol for the Nth day and at a certain day time is adopted. 39
The evaporative flux can be expressed as

The radiative flux Qrad is calculated using the surface to surface radiation model of COMSOL Multiphysics, taking into account the radiative assumptions given in Figure 1. The view factor is automatically determined for each of the geometry facets using a “hemicube” approach.
Initial and boundary conditions
The initial hydrodynamic, thermal, and mass transfer boundary conditions can be written as follows

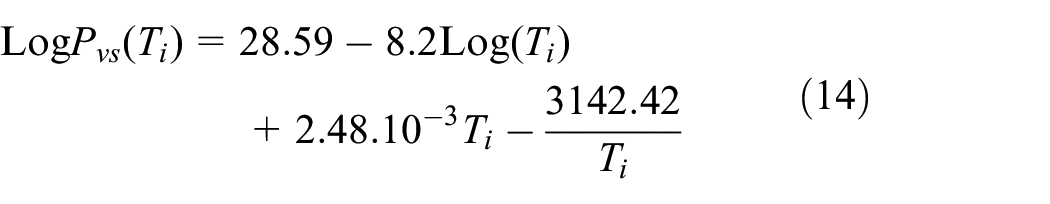
Initially, the humid air is supposed to be saturated. In fact, several small evaporation ponds were superimposed next to each other. The air absorbs moisture from this pond and becomes saturated at the beginning of the day. Once this air is heated by solar radiations, the level of its saturation decreases and air requires additional moisture. Therefore, the humid air mass fraction can be expressed as
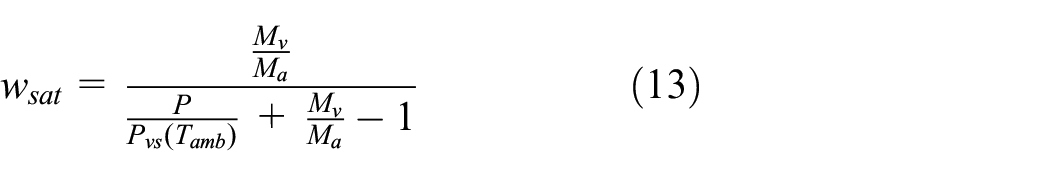
where P and Pvs present, respectively, the reference pressure and the equilibrium vapor pressure at the interfacial temperature Ti, which is given by Vachon et al. 40
The relevant boundary conditions associated with the present problem are as follows:
At the inlet

At the outlet

At the greenhouse upper surface

At the pond walls

At the OMWW-air interface

Validation of the numerical model
In order to validate our numerical model, a Rayleigh–Bénard square cavity with an “L” side was considered. The vertical walls were insulated and the horizontal ones were isothermal. The upper vertical wall was kept at a lower temperature (Tc) whereas the bottom one was at a higher temperature (Th). The presented profile of the local Nusselt number Nu, calculated at the hot wall for a proposed Rayleigh number of 105 (Figure 5), show that our results are in a good agreement with those published by Ouertatani et al. 41

The convective model validation.
To validate our radiative model, a rectangular enclosure (0.2 m × 0.1 m), filled with a non-scattering media and having black walls and presented in Figure 6, was examined. The bottom wall was at a constant higher temperature (Th). The other walls were maintained isothermally at a lower temperature (Tc).

The configuration used for the analytical calculations.
Figure 7 illustrates the view factor of the different surfaces, determined by the analytical calculation using equation (20), which were in a good agreement with those obtained by the numerical code

where


The radiative model validation.
Results and discussions
Drying kinetics inside the greenhouse dryer
The geometry dimensions used in this part are given in Table 2.
The model dimensions.

Temperature
The variation of the average OMWW and air-OMWW interface temperatures under the open sun and inside the greenhouse solar dryer as a function of time are shown in Figure 8.

The average OMWW and air-OMWW interface temperatures under the open sun and inside a greenhouse solar dryer versus drying time.
The solar radiation was trapped and stored in the greenhouse dryer. Thus, the average OMWW temperature and the air-OMWW interface temperatures there, which reached 320.5 and 323.7 K, respectively, were higher compared to those during open sun drying which reached 319 and 322 K, respectively.
The average OMWW and air-OMWW interface temperatures increased for the 16 and 14 h, respectively, due to the increase of solar radiation and thus the stored energy in form of sensible heat and decreased for the rest of the day due to their decrease. By the way, the phase shift between the two temperature maximums can be explained by the fact that the OMWW has higher thermal inertia than the air which allows it to store heat and restore it gradually owing to its low thermal diffusivity.
From Figures 8 and 9, it can be noticed that for both drying processes and before 14 h, the interfacial temperature was higher than the average OMWW temperature, but after 14 h, the situation was reversed and the average OMWW temperature became higher than the average interfacial temperature owing to the decrease of solar radiation. Thus, the cooling of OMWW surface increases its density and forces it to sink to be replaced by the warmer OMWW coming from lower levels. That is why a natural convection movement appeared as depicted in Figures 9(c) and 11(c).

Local distribution of the air and OMWW temperatures (K) at (a) 8 h, (b) 12 h, and (c) 20 h.
During greenhouse solar drying, all the temperatures were close to 304 K, at the beginning of the day. Then, as it is shown in Figure 9(a) and (b), the OMWW temperature progressively warmed up following the principle of thermal stratification. The interfacial surface had the highest temperature, as it was the most exposed to solar radiation. As the latter dipped from noon, the OMWW temperature also dipped as illustrated in Figure 9(c).
Figure 9 shows that there is a significant difference between the temperatures of the incoming and exhaust air of the dryer. The latter still has a high temperature and thus sufficient drying potential, suggesting its recirculation for more efficient utilization of the solar dryer.
Velocity
The rise and fall of solar radiation and air temperature affected the natural convection during the evaporation process. Therefore, air velocity follows the solar radiation and air temperature profiles as shown in Figures 4, 8, and 10. In the greenhouse, the average air velocity was higher than under open sun and reached its maximum at 14 h 30 min with 0.037 m/s compared to 0.022 m/s under the open sun.

OMWW and air average velocities under the open sun and inside a greenhouse solar dryer versus drying time.
For the average OMWW velocity, stagnation can be noticed until 16 h 30 min. But once the solar radiation, as well as the interfacial OMWW temperature, decreased; the OMWW velocity increased as seen in Figure 11(c). In fact, the increase of the OMWW temperature compared to the interfacial temperature, noted in the previous section, led to a drop of its density and thus of the relative buoyancy.

Local distribution of the air and OMWW velocities (m/s) at (a) 8 h, (b) 12 h, and (c) 20 h.
As a result, a bulk movement induced by the buoyant forces appeared as the hotter liquid floated above the colder one while this last fell in the pond bottom.
The air velocity distributions and the streamlines are presented in Figure 11 for different hours of the day. The air entered from the greenhouse inlet, moved horizontally following the pond width and then vertically upward and exited. It is evident that the high velocity regions were close to the greenhouse outlet where the air leaves, whereas the remaining domain displayed a low velocity magnitude.
Recirculation zone can be seen at the top of the greenhouse due to low-pressure area generated by flow direction toward the outside of the greenhouse.
Vapor mass fraction
The drying process is characterized by a gradual reduction of the product moisture content over time. While the kinetic energy of a molecule is proportional to its temperature, evaporation can proceed more quickly and easily at higher temperatures. Thus, when the liquid molecules located at the surface have enough energy, they escape from the liquid to the air and, therefore, the vapor mass fraction in the air increased during the first half of the day as shown in Figure 12(a) and (b). In the afternoon, the solar radiation diminished; that is why the vapor mass fraction also diminished as indicated in Figure 12(c). As a result, from Figures 8 and 12, it can be confirmed that high OMWW and air temperatures can provide greater saturation deficit which is one of the driving forces in the diffusion process. The most intense vapor mass fraction took place at the OMWW-air interface.

Local distribution of the vapor mass fraction at (a) 8 h, (b) 12 h, and (c) 20 h.
Evaporated liquid mass
The mass of the evaporated liquid was computed from equation (10) for five consecutive typical days and presented in Figure 13. For each day, the overall profile of the evaporated liquid mass has a peak at about 14 h 00 min. This can be explained by the increase of solar radiation until midday and its decrease for the rest of the day. After 48 h, the periodic regime is established.

The evaporated liquid mass versus the drying time.
During the night, the solar energy and thus the dryer thermal efficiency are very low compared to those obtained around 12 h 00 min. In fact, solar drying thermal efficiency is important when energy drying is high. Although the solar radiation disappeared from about 19 h 00 min, the evaporation process continued but with a slower rhythm compared to the diurnal period, since the liquid is still hot.
As expected, the evaporated liquid mass was higher in the case of the greenhouse solar drying compared to the open sun drying.
Radiative flux and evaporative flux at the liquid-vapor interface
The evolution of the radiative and evaporative flux close to the liquid surface are presented in Figures 14 and 15. It can be seen that the radiative and evaporative flux are attenuated by the solar radiation which is absorbed by the liquid surface. They were more important at the greenhouse inlet. This is due to the fact that, at this zone, the temperature is low which allows a reduction in the radiative heat losses and the concentration gradient is important which promotes the evaporation process.

The radiative flux at the liquid-vapor interface at 12 h.

The evaporative liquid flux at the liquid-vapor interface at 12 h.
However, further investigations are required to determine design parameters and optimum conditions allowing better performance of the solar drying process.
Parametric study
The total evaporated liquid mass is an important parameter to describe the drying kinetics of the evaporation process. That is why it will be used in this parametric study.
Effect of the pond depth
To determine the optimum OMWW depth, at which the drying process achieves its maximum performance, six simulations with six pond depths were carried out during July for both drying processes.
As illustrated in Figure 16, there is a significant difference between the different cases and the maximum total evaporated liquid mass was at 0.1 m pond depth.

The effect of the pond depth with L = 0.4 m, H = 0.4 m, d = 0.01 m, and S = 0.05 m.
Consequently, the pond depth plays a key role in the liquid ability to store energy. In fact, a shallow liquid surface is more sensitive to climatic variations than a deep one. It follows that, during the typical summer day, the shallow liquid surface warmed up rapidly due to its thermal inertia and the smaller liquid volume. Hence, the concentration gradient increased and the evaporation process was promoted.
Effect of the pond width
In this section, the effect of using one or separated ponds for the same quantity of OMWW is discussed. From Figure 17, it is clear that for both drying processes, a significant increase of the total evaporated liquid quantity can be achieved by using two ponds with a width equal to 0.2 m instead of a pond with a width equal to 0.4 m. the same thing is noticed by using three ponds with a width equal to 0.2 m instead of a pond with a width equal to 0.6 m. Accordingly, using separated ponds can enhance the evaporation process.

The effect of the pond width with H = 0.4 m, h = 0.2 m, d = 0.01 m, and S = 0.05 m.
Effect of the greenhouse height
The greenhouse height also can be an important parameter in the solar dryer. That is why, different models with different outlet and fixed dimension were simulated. From Figure 18, it can be noted that the lowest height (0.1 m) gave the highest evaporated liquid mass. With a low height, the hot air can be easily exit and fresh air with lower moisture is renewed. Therefore, a low height can optimize the drying process.

The effect of the greenhouse height with L = 0.4 m, h = 0.2 m, d = 0.01 m, and S = 0.05 m.
Another point is that the greenhouse height decrease is accompanied by the greenhouse liquid surface view factor increase. In that way, the radiation losses are reduced and the temperature, as well as the concentration gradient, increases. Consequently, the evaporation process can be greatly helped by optimizing the greenhouse height.
Effect of the greenhouse outlet
The greenhouse outlet effect was also studied after being varied. Figure 19 illustrates the total evaporated liquid mass variation during the day for various outlets. It can be noted that there is only a slight difference between the different cases which is caused by the radiation view factor. Hence, using a small air outlet can derive very little advantage.

The effect of the greenhouse outlet with L = 0.4 m, H = 0.4 m, h = 0.2 m, and d = 0.01 m.
Effect of the d distance
The last geometrical parameter studied is the parameter d (Figure 1). From Figure 20, the slight difference between the different cases can be explained by the dependence of the radiation view factor on the d distance. The maximum total evaporated liquid quantity was obtained using a value of d = 0.03 m. Therefore, using the optimum d distance can have some benefit on the performance of the dryer.

The effect of the d distance of the greenhouse with L = 0.4 m, H = 0.4 m, h = 0.2 m, and S = 0.05 m.
Effect of the drying season
The numerical simulation has been carried out on four typical days of the year, using dimensions of Table 2. The equinoxes of spring (20 March) and autumn (23 September) and the days of the summer (21 June) and winter (22 December) solstices are considered in the simulation. The solar radiation and the average temperature corresponding to each day are given, respectively, in Figures 4 and 22.
As shown in Figure 21, the great evaporation appeared for the day during the month of July as it had the best absorbed solar energy during the longest day with the highest ambient temperature. Hence, the drying period plays an incontestable effect on the kinetics.

The effect of the drying season.
To be objective in this study, the greenhouse drying, as well as the open sun drying efficiencies were studied for each month of the year.
For clear sky conditions, the monthly average ambient air temperature and the maximum solar radiation along the year are shown in Figure 22. The variation of the total evaporated liquid mass obtained from January to December under the greenhouse drying and under the open sun are presented in Figure 23. The evaporation effect appeared to be tightly dependent on seasonal variations. The total evaporated liquid mass progress was globally comparable to that of the average ambient air temperature and the maximum solar radiation. After the 24 h of drying, it increased from 0.4 and 0.5 kg/m in January, respectively, under open sun and within the greenhouse dryer up to 4.4 and 5.05 kg/m in July due to the increase of ambient air temperature and solar radiation, then dwindled to 0.43 and 0.51 kg/m, respectively, under open sun and within the greenhouse dryer in December. Indeed, the highest total evaporated liquid mass values were recorded in the month of July while the lowest values were recorded in the month of January. In addition, significant values of evaporated liquid mass were registered during hot weather suggesting a better performance of the OMWW solar drying during this period. Accordingly, the water quantity that can be evaporated from the liquid surface depends on the amount of solar energy. The higher this energy with its latent heat, the more water molecules can overcome the OMWW intermolecular forces and thus be potentially able to escape to the air.

The monthly evolution of the maximum solar radiation and average ambient temperature.

Comparison of the total evaporated liquid mass evolution from January to December inside the dryer and under natural sun drying.
Furthermore, this energy varies not only from one season to another but also from one place to another depending on the geographical location.
Conclusion
The developed model emphasizes the important physical phenomena in the solar greenhouse drying process and its efficiency compared to open sun drying. The main results can be summarized as follows:
The predicted temperature, velocity, vapor mass fraction, and evaporated liquid mass are in good agreement with previous researches and showed the advantage of using a greenhouse solar dryer.
The current model is used to study the effect of design changes and the external climatic conditions on the dryer performance.
Shallower separated ponds with a low height greenhouse during a summer day can enhance the performance of a greenhouse dryer.
With optimum parameters, solar greenhouse drying can be satisfactory and competitive to open sun drying with an important capacity of drying and low-cost investment.
Footnotes
Appendix 1
Acknowledgements
The authors are particularly grateful to Mr Gérald Debenest (University of Toulouse) for his valuable views and encouragements.
Handling Editor: James Baldwin
Declaration of conflicting interests
The author(s) declared no potential conflicts of interest with respect to the research, authorship, and/or publication of this article.
Funding
The author(s) received no financial support for the research, authorship, and/or publication of this article.