
Abstract
Molecular dynamics simulation is used to investigate the flow characteristics of Cu–Ar nanofluids considering the influence of nanoparticle size and nanoparticle aggregation. Nanofluids viscosity is calculated by equilibrium molecular dynamics based on Green–Kubo equation. Results demonstrate that the viscosity of nanofluids decreases with the increase of nanoparticle size. In addition, nanoparticle aggregation results in the increase of the nanofluids viscosity. Compared with nanoparticle size, nanoparticle aggregation has a larger impact on viscosity. Nanofluids flowing in parallel-plate nanochannels are simulated. The velocity profiles are studied through three nanoparticle sizes (11.55, 14.55, and 18.33 Å) and four nanoparticle aggregate configurations. Results show that the velocity profile of 14.55 Å nanoparticle size is larger than that of other two nanoparticle sizes. As for four nanoparticles, the nanoparticles clustering as a line leads to the maximum velocity profile, while the nanoparticles clustering as a cube causes the minimum velocity profile. Compared with viscosity, nanoparticle aggregation has a greater effect on the velocity profile. When the nanoparticles are evenly distributed, the influence of viscosity on velocity profiles is dominant. Otherwise, the aggregation, aggregate configuration, and distribution of nanoparticles have a dominant impact on the flow characteristics of nanofluids.
Keywords
Introduction
Convective heat transfer has attracted many concerns in engineering fields. The new technology of enhancing heat transfer using the nanofluids instead of traditional heat transferring fluids has received considerable attentions.1,2 Nanofluids are produced by a mixture of base fluid and suspending solid metal or fibers with length on the order of 1–100 nm. 3 Due to their unique thermal properties, nanofluids play an important role in many applications which include heat exchange devices, solar heating equipment, thermal storage systems, and cooling systems. 4 Accordingly, a great deal of experiments and simulations have been performed to study the mechanism for thermal conductivity enhancement of nanofluids.5–10 The thermal conductivity of four kinds of nanofluids (i.e. A12O3–water, CuO–water, A12O3–ethylene glycol, and CuO–ethylene glycol) was studied experimentally in Lee et al. 5 It was believed that both nanoparticle shape and size were the main factors affecting the thermal conductivity. In Choi et al., 6 oil-based nanofluids were produced and its thermal conductivity was measured. It was found that the thermal conductivities of the measured nanofluids were greater than the predicted value. Patel et al. 7 measured the thermal conductivity of naked and monolayer-protected Au nanoparticles in water or toluene media and analyzed the effect of the type coating on effective heat transfer. In Xie et al., 8 the thermal conductivity of three nanofluids (i.e. A12O3–ethylene glycol, A12O3–pump oil, and A12O3–deionized water) was investigated by experimental research. It was found that the Brownian motion, nonlocal heat transport, nanoparticles clustering, and liquid layer at the surface of solid nanoparticles all had certain effects on the thermal conductivity. Wang et al. 9 developed a fractal model which based on the effective medium theory to predict the thermal conductivity of nanofluids. Li et al. 10 conducted equilibrium molecular dynamics (EMD) simulation to investigate the effect of molecular stratification on the thermal conductivity of nanofluids. Fluid flow is often involved in many applications. Thus, similar to the thermal conductivity of nanofluids, the flow characteristics of nanofluids are also very important. Actually, they have excellent properties of heat transfer, but more energy is consumed when the viscosity of nanofluids is high. Inversely, low viscosity causes low flow resistance and low heat dissipation. Viscosity affects pumping power, pressure drop, and flowing velocity during the circulation of working medium. A proper viscosity can improve the performance of heat transfer systems. A thorough investigation of the influence of nanoparticle size and nanoparticle aggregation on the flow characteristics of nanofluids is of great significance for the development of nanofluids with excellent thermophysical performances.
Great efforts have been made to investigate the enhancement of viscosity of nanofluids. As shown in recent comprehensive reviews,11–13 shape and size of nanoparticles, volume concentration, temperature, and so on, are the factors which influence the viscosity of nanofluids. In general, most researchers agreed with the conclusion that viscosity increased with decrease of temperature or increase of concentration.14–18 However, few people studied the influence of nanoparticle size and nanoparticle aggregation on viscosity. Nkurikiyimfura et al. 19 suggested that nanoparticle aggregation might result in the thermal conductivity enhancement of nanofluids. Xuan et al. 20 observed the transmission electron micrograph photo of Cu–water nanofluids in experiments. They also carried out a simulation of nanoparticle aggregates. They considered the irregular movement of nanoparticles was caused by Brownian motion, which might result in the nanoparticle aggregation. Murshed et al. 21 prepared nanofluids with different volume fractions of TiO2 nanoparticles and utilized the transmission electron micrograph and nanoparticle size analyzer to observe the morphology of nanoparticles. Song et al. 22 developed a model which was based on modified population balance model of rheological law to study the hydrodynamics properties of magnetic nanofluids. According to their results, they considered that the viscosity decreased with the decrease of aggregates size. Duan et al. 23 investigated the viscosity and microstructure of Al2O3–water nanofluids. The measurement results showed that the viscosity was higher than that of nanofluids after re-ultrasonication. They inferred it might be the result of aggregation. Nanoparticle size is another important factor that should be taken into account when studying viscosity. Most researchers24–28 concluded that the viscosity increased with the decrease of nanoparticle size. However, He et al. 29 measured the viscosity of TiO2–water nanofluids with different nanoparticle sizes (95, 145, and 210 nm) and found a contradictory result. They found that the viscosity of nanofluids increased obviously with the increase of nanoparticle size. The role of nanoparticle size on the viscosity of nanofluids is still under debate.
Great efforts have been made to investigate the flow of nanofluids. Rajabi et al. 30 used a single-phase and mixed-phase models to numerically simulate flowing turbulent nanofluids in narrow channels with heated walls and spherical pits. They believed that the velocity distribution became more limited with the increase of depth of the cavity. Toghraie et al. 31 simulated Couette and Poiseuille Cu–water nanofluids flowing in rough and smooth nanochannels. They found that the velocity distributions of the upper and lower walls were basically the same. Moreover, the flow rate of the nanofluids decreased with the increase of the channel width. Derakhshan et al. 32 investigated the process of heat and mass transfer when nanofluids flowing in nanochannels. Results showed that viscosity increased with the increase of thermophoretic and Brownian parameters. The concentration of nanofluids decreased with the increase of Brownian motion. Hayat et al. 33 simulated and analyzed the Ag–water nanofluids flow which induced by nonlinear curved stretching surface. They found that velocity decreased with the increase of volume fraction of Ag nanoparticles. Kataria and Mittal 34 performed the mathematical model of electrically conducting nanofluids flowing through a vibrating vertical plate. They also concluded nanofluids velocity increased with the decrease of volume fraction. Moreover, the velocity was related to mass Grashof number, Prandtl number, Schmidt number, and magnetic parameter.
Due to the addition of nanoparticles and molecular interaction, nanofluids cannot be regarded as continuous medium which is the basic assumption of macroscopic flow heat transfer theory. 35 Therefore, the physical properties of nanofluids at nanoscale can be studied using molecular dynamics simulation (MDS), which facilitates the application of nanofluids. So far, there are limited studies on the impact of nanoparticle size and nanoparticle aggregation on the flow characteristics of nanofluids. Zhang et al. 36 used MDS to investigate the flow behaviors of the Cu–Ar nanofluids. They concluded that the dispersed Cu nanoparticles (Cu NPs)within nanofluids could increase the overall viscosity while the accumulated Cu NPs-cluster only changed the local flow characteristics. Kang et al. 37 simulated different configurations of nanoparticle aggregates clustering in Cu–Ar nanofluids by MDS and the viscosity was calculated with Green–Kubo (G–K) method. The results showed that nanoparticle aggregation could induce a slight enhancement of viscosity. Compared with the viscosity of pure fluid, different configurations of nanoparticle aggregates resulted in different viscosity enhancements in nanofluids. But their results about the variation of viscosity with nanoparticle size did not show regularity. However, Lu and Fan 38 used MDS to calculate the shear viscosity of Al2O3 nanoparticles with different sizes in water and ethylene glycol. Numerical results showed that the shear viscosity decreased with the increase of nanoparticle size. Rudyak and Krasnolutskii 39 got the same conclusion by performing a MDS of the viscosity of nanofluids which consisted of aluminum and lithium nanoparticles and liquid Ar. They suggested that the raise of the total surface area with the decrease of nanoparticle size was the main reason for the increase in viscosity of nanofluids. Lou and Yang 40 utilized G–K formula to calculate the viscosity of Al2O3–water nanofluids. They concluded that the viscosity increased with the decrease of nanoparticle size and the effect of nanoparticle size on viscosity became more obvious at a lower temperature. Therefore, it can be seen that, studying the influence of nanoparticle size and nanoparticle aggregation on the flow characteristics of nanofluids with MDS is quite necessary.
The importance and novelty of the present work are as follows:
In experiments or applications, it is difficult to precisely control the particle size and configuration of nanoparticle aggregates. The flow characteristics of the nanoparticles during the flow process are also difficult to be studied. The influence of above factors on the flow characteristics of nanofluids can be studied using MDS. In addition, MDS can be used to clearly describe the dynamic configuration of nanoparticles, which is of great significance for the research of nanofluids.
MDS is used to calculate the viscosity of nanofluids with different nanoparticle sizes and aggregation configurations. The viscosity of nanofluids related to different nanoparticle aggregation configurations in three directions is also calculated. The effect of nanoparticle aggregation on the viscosity of nanofluids is studied from microscale persoective.
The flow models of nanofluids with different nanoparticle sizes and aggregation configurations are simulated using MDS. The effect of above factors on the velocity of nanofluids is studied. Also, the dynamic configuration of nanoparticles during the flow process is demonstrated.
In this work, the simulations based on the G–K theorem were first performed to calculate the viscosity of different nanoparticle sizes and several specific configurations of nanoparticle aggregates in Cu–Ar nanofluids. Furthermore, the flow heat transfer model of the fluid in pipe can be simplified to simple geometrical configurations. Thus, the model of flowing Cu–Ar nanofluids between two Cu parallel-plate was simulated by MDS to investigate the effect of nanoparticle aggregates and nanoparticle size on the velocity profile. The velocity profile variations can reflect the resistance of nanofluids and volumetric flow rate in the flow process. Thus, the effect of above factors on the flow characteristics in Poiseuille flow was studied by comparing the results of velocity profile and viscosity associated with the dynamic configurations of the nanofluids. This work may make contribution to further facilitate the application of nanofluids.
Model and method
Interatomic potentials
In this work, Lennard–Jones (L–J) potential 41 is utilized as the interatomic potential to describe the interactions between Ar–Ar, Cu–Cu, and Cu–Ar. The mathematical expression of the L–J potential is defined as follows

where


L–J potential parameters describing the interaction between Cu and Ar atoms.

The cross potential parameters
The model and method of calculating viscosity
Stress tensor and viscosity
In the models, EMD method is used to compute the shear viscosity of the nanofluids. EMD is a multi-property method. Extra adjustments are not needed when using EMD. Also, the poor convergence of the correlation function can be avoided. All thermodynamic properties can be computed at one state point during a simulation process. The EMD is based on the G–K equation which is widely used in the calculation of viscosity. In addition, no driving force is applied to the simulation system with G–K approach. Thus, the system always maintains a linear response state. The G–K approach utilizes flux fluctuations to calculate shear viscosity, which is on the basis of the fluctuation–dissipation theorem. 44 Viscosity is computed in term of time-autocorrelation functions of the off-diagonal components of the stress tensor P. The shear viscosity using G–K method is obtained from 45

where

where k denotes the kind of atom,
MDS methodology of calculating viscosity
The viscosity of nanofluids was calculated by the model of disperse Cu nanoparticles in the liquid Ar. The atom Ar has simple potential function, which avoids dealing with needless complex interactions and reduces the computing time. The simulation box was 10 nm × 10 nm × 10 nm with periodic boundary conditions applied in all directions. Nanoparticles of Cu atoms were arranged in Face-Center-Cubic (FCC) structure. Nanofluids were constructed by 21,097 Ar atoms with nanoparticles dispersed within it. In the simulations, the time step was selected to be Δt = 2 fs. The temperature of nanofluids remained at 94 K during the simulation process. To make the system equilibrate at 94 K and obtain an equilibrium state, an initial 200,000 time steps were performed with atom velocities rescaled and canonical ensemble until its energy fluctuations became stable. After the equilibrium, the data were collected to calculate the shear viscosity according to the G–K formula for 1,000,000–2,000,000 time steps.
The model and method of fluid flow
Temperature control and fluid flow
The geometric models of the Cu–Ar nanofluids confined in two parallel plates are built in order to investigate the effect of nanoparticle size and nanoparticle aggregation on the flow characteristics. In MDS, the temperature was controlled by altering the velocity of atoms. For a group of atoms, the temperature is calculated by the following formula 47
where
MDS methodology of fluid flow
The simulation box was 20 nm × 10 nm × 11.6 nm and the distance between two plates was 10 nm. Periodic boundary conditions were applied in x and y directions while fixed boundary conditions were applied in z direction. The plates and nanoparticles were arranged as FCC lattice and the thickness of each plate was 0.73 nm (four layers Cu atoms). Since the atomic distribution was artificial, the initial model needed to be relaxed to reach an equilibrium state. The canonical ensemble was applied in equilibrium process for 600,000 time steps with each time step length of 2 fs. The spring force command was applied to the Cu atom in the solid plates, which made Cu atoms vibrate near its lattice points. When its energy distribution became uniform, the flow process was carried out in micro-canonical ensemble for 1,000,000 MDS time steps. Large-scale atomic/molecular massively parallel simulator (LAMMPS) 48 molecular dynamics simulator software was used to simulate all models.
Results and discussions
Viscosities of nanofluids
To validate the application of the interatomic potential and the G–K method to MDS, the viscosity of nanofluids with pure Ar was calculated. In the simulations, the viscosity of pure Ar was found to be 2.78 × 10⁻⁴ Pa s, which was in agreement with Zerouala et al. 46 This proves the reliability of the numerical methods. To investigate the effect of nanoparticle size on the viscosity of nanofluids, three different nanoparticle sizes (9.17, 11.55 and 14.55 Å) were chosen in simulations at the particle volume concentration of 1.29%. For different nanoparticle size, it was necessary to ensure that they had the same volume fraction in nanofluids, which meant that the amount of nanoparticles increased with the decrease of nanoparticle size. Thus, there was only one 14.55-Å nanoparticle in the first simulation box while the second simulation box had two 11.55-Å nanoparticles for the particle size of 11.55 Å to keep the particle volume fraction at 1.29%. Similarly, the third simulation box contained four 9.17-Å nanoparticles to keep the same particle volume fraction. In MDS, the Cu atoms in the nanoparticles were arranged according to the FCC lattice structure, and this arrangement ensured that the nanoparticles had the stability of metal. In the simulation, the nanoparticles did not break or deform in fluid regardless of whether nanofluids was in static or flowing state. Therefore, the increase of nanoparticle size in the simulations did not affect the stability of the nanoparticles. Figure 1 shows the viscosity of nanofluids and total surface area of nanoparticles as a function of the nanoparticle size. It can be observed from Figure 1 that shear viscosity obtained from the simulations decreases with the increase of nanoparticle size. Moreover, the above trend is more obvious for small nanoparticle size. This is consistent with that in the literature.38–40 It can also be seen from Figure 1 that total surface area of nanoparticles increase with the decrease of the nanoparticle size. Therefore, viscosity enhancement of nanofluids with the decrease of nanoparticle size is strongly dependent on the surface area of nanoparticles. The total surface area of nanoparticles is related to the volume of solid-like liquid layer at the interface of liquid and nanoparticles. 39 The effective volume of nanoparticles increases with the increase of the surface area of nanoparticles, which results in the enhancement of viscosity.

The viscosity and surface area for three nanoparticle sizes.
According to Kang et al., 37 it takes a long time to use regular to simulate the appearance of nanoparticle collision and aggregation. To make nanoparticles stuck together within a short time, the nanoparticles were initially placed very close. The initial configurations of above MDS models were shown in Figure 2. One aggregate configuration was simulated for the two nanoparticles case (11.55 Å for each nanoparticle) while three aggregate configurations were simulated for the four nanoparticles case (9.17 Å for each nanoparticle). The viscosities of different nanoparticle aggregates are shown in Figure 3. Although the volume fraction of the configurations of one nanoparticle, one nanoparticle pair, and four nanoparticles 37 is the same, the viscosities of the above configurations are different. The viscosity for the case of two non-aggregated nanoparticles is 2.85 ×10⁻⁴ Pa s while the viscosity for the case of two nanoparticle pairs which contain four nanoparticles is 3.06 × 10⁻⁴ Pa s. The viscosity is influenced by the configurations of aggregates when the amount of single aggregates is same. In addition, the viscosity for the case of two aggregated nanoparticles is 2.95 × 10⁻⁴ Pa s which was higher than that for the case of two non-aggregated nanoparticles. For the case of four nanoparticles, the viscosities of nanoparticle aggregates are higher than those without aggregation. Highest viscosity can be obtained when four nanoparticles cluster as a line. The result clearly shows that nanoparticle aggregation causes the enhancement of viscosity. Compared with the effect of nanoparticle size, the effect of nanoparticle aggregation on the viscosity is more remarkable.

The initial configurations of nanoparticle aggregates. (a) Two aggregated nanoparticles (one nanoparticle pair), (b) two nanoparticle pairs, (c) four nanoparticles clustering as a cube, and (d) four nanoparticles clustering as a line.

The viscosity for different nanoparticle aggregates.
Flow of nanofluids
Validation of Newton fluid
The flows of nanofluids in nanochannels were simulated to study the effect of nanoparticle size and nanoparticle aggregation on the flow characteristics. Figure 4 shows the configurations of all nanofluids whose nanoparticle volume fraction is 1.29%. However, it is necessary to examine whether the flow of nanofluids in the nanochannels with the channel width of 10 nm is the Newtonian flow before simulating Poiseuille flow. Therefore, to simulate Couette flow by MDS, the upper Cu solid wall moved at velocity of 70, 90, and 110 m/s along x direction while the bottom wall was fixed. In the models of nanofluids flowing in nanochannels, the simulation box was divided into 69 layers along z direction. When the nanofluids reached steady flow, the atom velocities along x direction of every layer were averaged to obtain the velocity profile across the nanochannels. Figure 5 shows the velocity profiles of nanofluids with different nanoparticle sizes and different configurations of nanoparticle aggregation. The velocity described in Figure 5 is similar with that in Zhang et al. 49 It can be seen in Figure 5 that all velocity profiles are approximately linear along z direction, which is similar with that of pure Ar. Therefore, the nanofluids flowing in the nanochannels can be approximated as viscous Newton fluid.

The initial configurations of Cu–Ar nanofluids in the parallel-plate nanochannel. (a) One nanoparticle, (b) two non-aggregated nanoparticles distributing along x-axis, (c) two non-aggregated nanoparticles distributing along z-axis, (d) four non-aggregated nanoparticles, (e) two aggregated nanoparticles (one nanoparticle pair) distributing along z-axis, (f) two aggregated nanoparticles (one nanoparticle pair) distributing along x-axis, (g) two nanoparticle pairs distributing along x-axis, (h) four nanoparticles clustering as a line, and (i) four nanoparticles clustering as a cube.
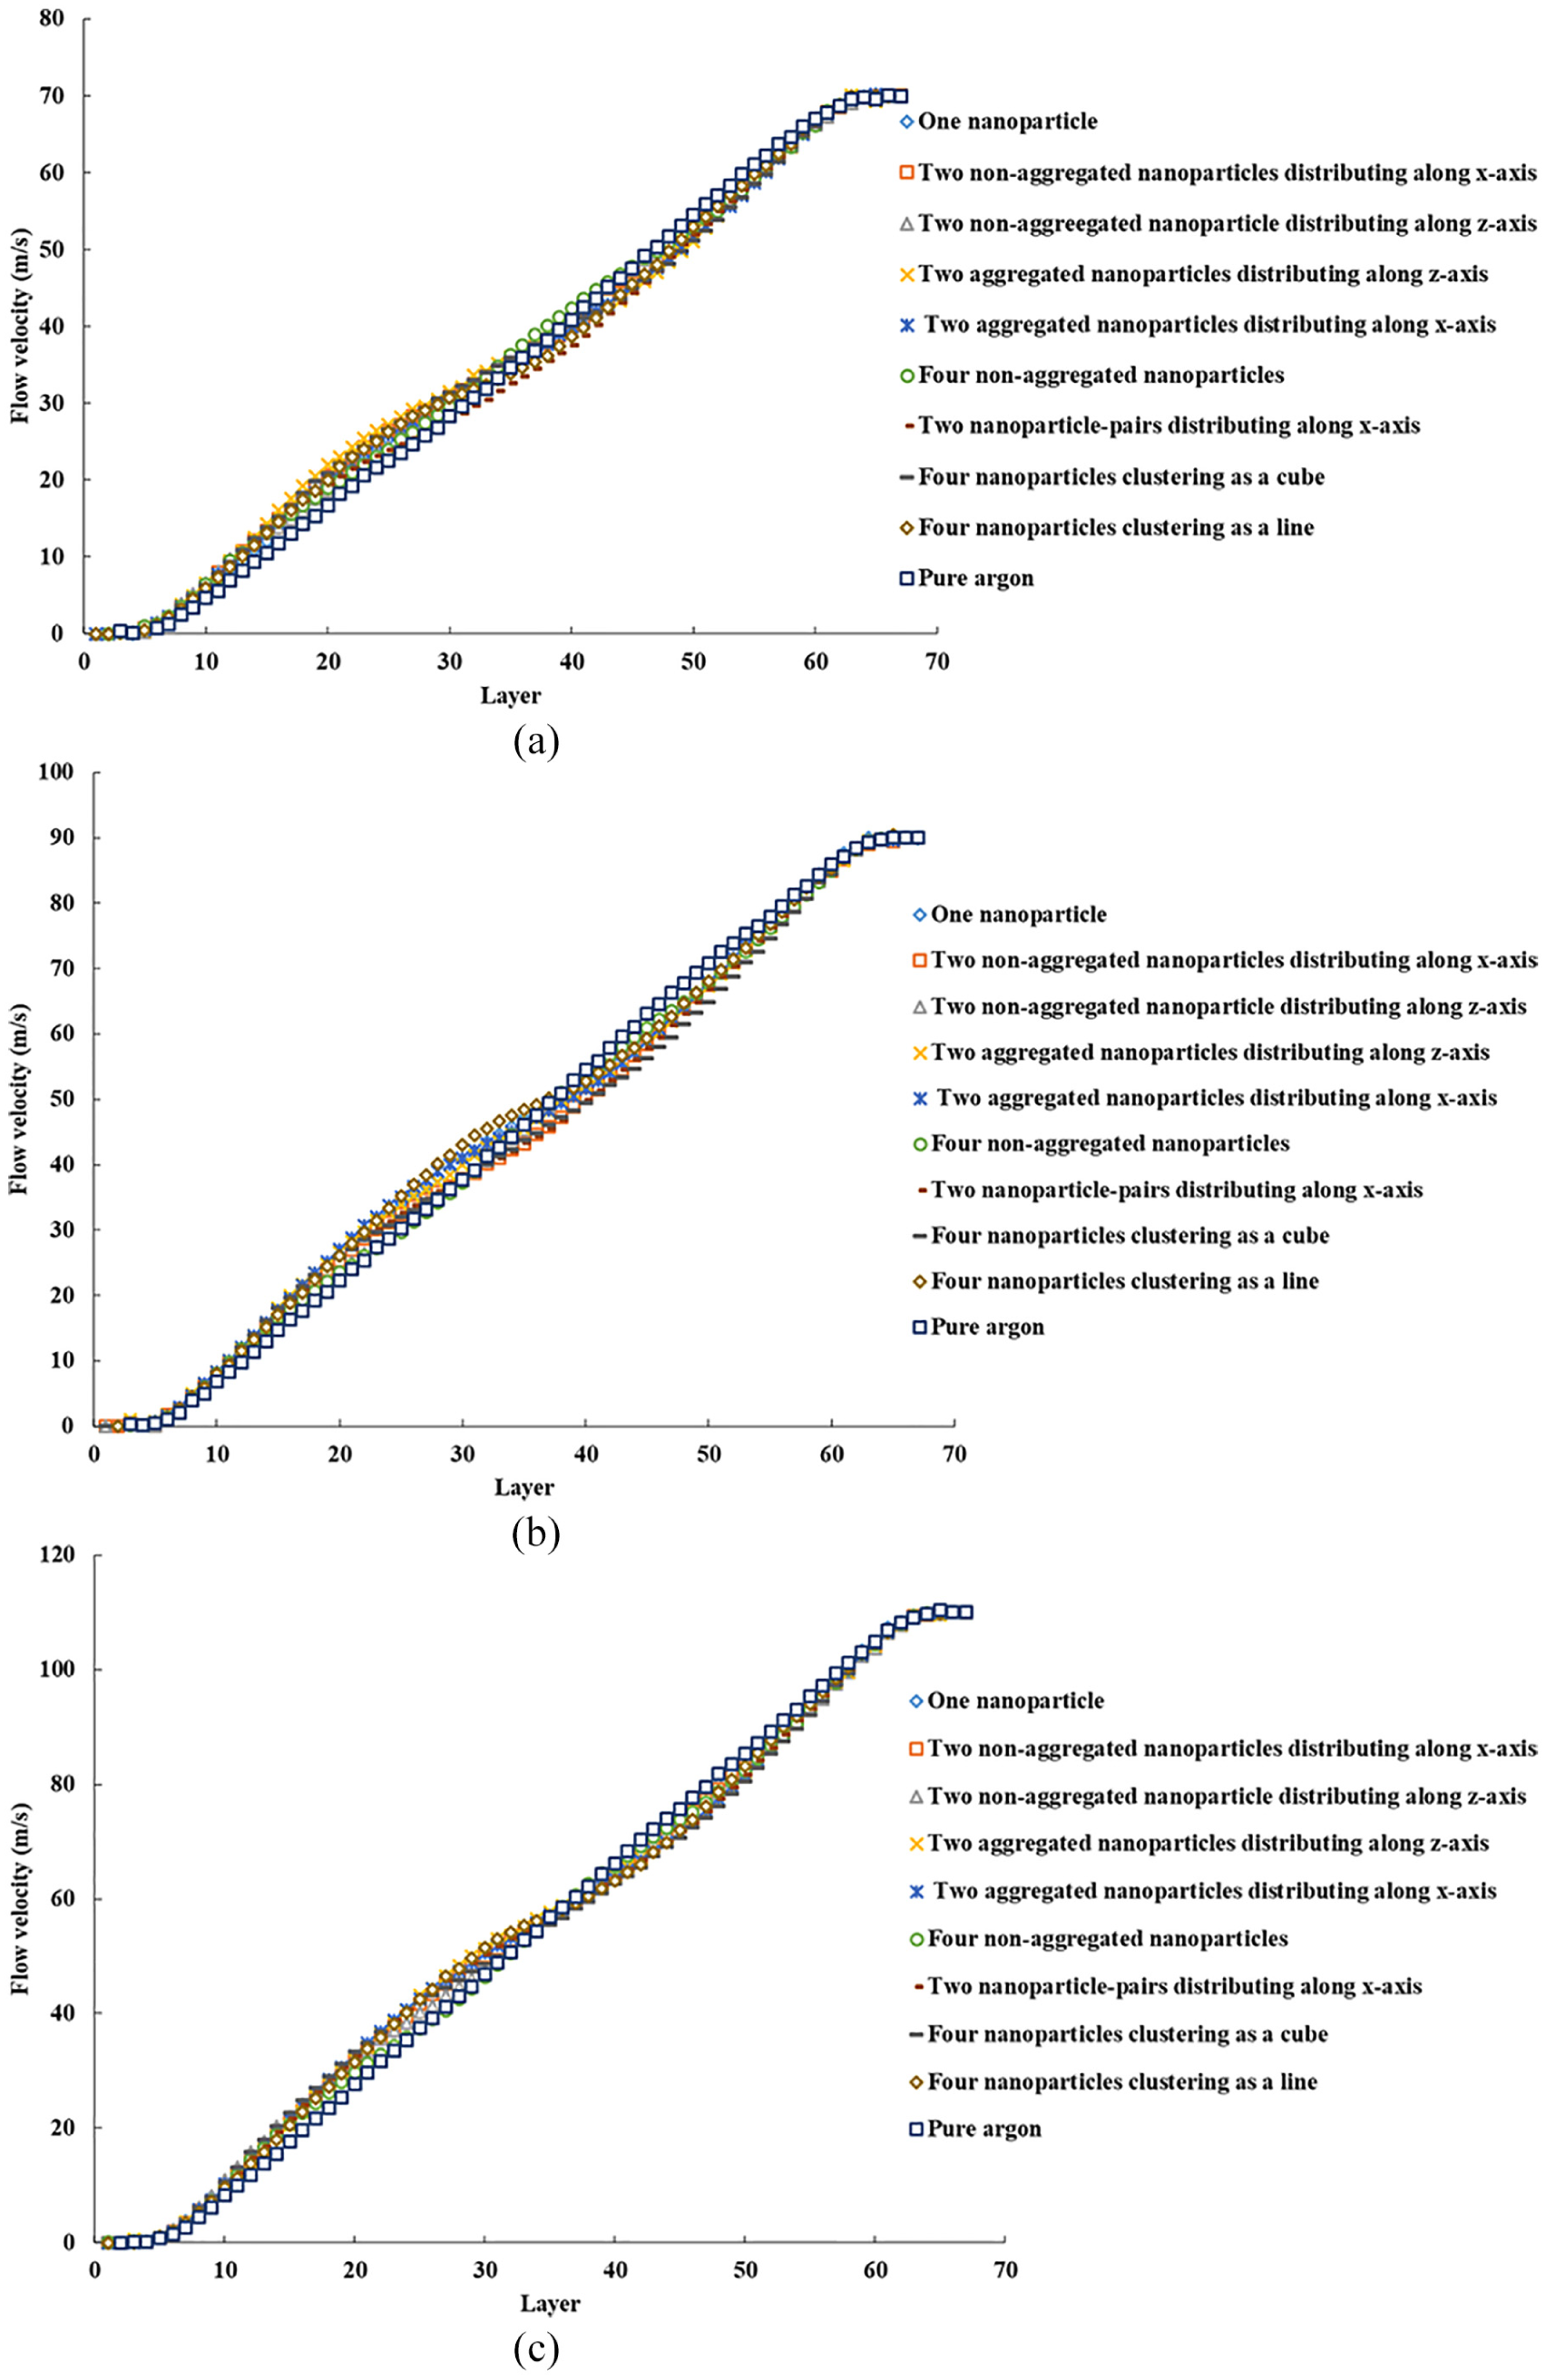
The velocity profiles of different nanoparticle sizes and different configurations of nanoparticle aggregates in Couette flow with the upper Cu solid wall velocity of 70, 90, and 110 m/s. (a) The velocity profiles with the upper Cu solid wall velocity of 70 m/s, (b) the velocity profiles with the upper Cu solid wall velocity of 90 m/s, and (c) the velocity profiles with the upper Cu solid wall velocity of 110 m/s.
Velocity profile and dynamic configurations of nanofluids
The Poiseuille flows of nanofluids caused by a driving force were performed by MDS to study the effect of nanoparticle size on the velocity profile of Cu nanofluids in nanochannels. The geometries of Cu–Ar nanofluids flowing in the parallel-plate nanochannels are shown in Figure 6. Figure 6 clearly shows three-dimensional (3D) view of the flow of nanofluids. The nanofluids contain nanoparticles with different sizes or configurations of nanoparticle aggregation. Moreover, the characteristics of microflow can be investigated by analyzing the velocity profile. The flow characteristics of nanofluids can be clearly studied by increasing the volume of the simulation box. Thus, nanoparticle size was increased to keep the volume fraction of nanoparticles and the amount of nanoparticles unchanged. The nanoparticle size in the flow model was set to be 11.55, 14.55, and 18.33 Å, respectively. The amount of nanoparticles corresponding to the above nanoparticle size was 4, 2, and 1, respectively. Although the nanoparticle size increased during simulation, the nanoparticles also remained stable. The initial configurations of simulations are shown in Figure 4. Figure 7 shows the velocity profiles with different nanoparticle sizes. As can be seen in Figure 7, the velocity profiles at both ends of curves are basically the same. On the contrary, the difference of velocity profile in the middle zone is relatively obvious. Moreover, the velocity profile for the nanoparticle size of 18.33 Å is larger than that for nanoparticle size of 11.55 Å. However, the velocity profile for the nanoparticle size of 14.55 Å is larger than that for other nanoparticle size. Thus, the volumetric flow rate does not always increase with the decrease of nanoparticle size. The volumetric flow rate of nanofluids is influenced by the amount and size of nanoparticles. When the volume concentration is fixed, the decrease of nanoparticle size leads to an increase of the amount of nanoparticles. Excessive nanoparticle causes the increase of the viscosity of the nanofluids, resulting in the decrease of volumetric flow rate.

The geometries of Cu–Ar nanofluids flowing in the parallel-plate nanochannel. (a) One nanoparticle, (b) two non-aggregated nanoparticles distributing along x-axis, (c) two non-aggregated nanoparticles distributing along z-axis, (d) four non-aggregated nanoparticles, (e) two aggregated nanoparticles (one nanoparticle pair) distributing along z-axis, (f) two aggregated nanoparticles (one nanoparticle pair) distributing along x-axis, (g) two nanoparticle pairs distributing along x-axis, (h) four nanoparticles clustering as a line, and (i) four nanoparticles clustering as a cube.

Velocity profile with different particle sizes.
To study the effect of nanoparticle aggregation on velocity profile of nanofluids, different configurations of nanoparticle aggregates flowing in nanochannels were simulated by MDS. For the case of two nanoparticles, the velocity profiles, the equilibrium configurations of nanofluids and the dynamic configurations of nanofluids at stable flow are presented in Figure 8. As can be seen in Figure 8(a), the aggregation of two nanoparticles causes the decrease of the volumetric flow rate. Moreover, the volumetric flow rate for the initial configuration of the two non-aggregated nanoparticles distributing along the x direction is the maximum. This is because two nanoparticles flow in the middle of the nanochannels (see Figure 8(b)), which results in the minimum flow resistance. As can be seen Figure 8(c), the two nanoparticles are easily attracted to each other. Then they flow together. This is related to the size of the nanoparticles and velocity gradient. Therefore, different initial distributions result in different velocity profiles. However, the velocity profiles are the same whether the nanoparticle pair was distributing along x direction or z direction. This is because they have the similar dynamic configurations (see Figure 8(d) and (e)). As can be seen in Figure 8(d) and (e), the nanoparticle pair oscillated in the x direction, which results in the increase of the flow resistance.

The velocity profiles, the equilibrium configurations of nanofluids and the dynamic configurations of nanofluids at stable flow for the case of two nanoparticles. (a) The velocity profiles of nanofluids for the case of two nanoparticles, (b) the dynamic configurations for the case of the two non-aggregated nanoparticles distributing along the x-axis, (c) the dynamic configurations for the case of the two non-aggregated nanoparticles distributing along the z-axis, (d) the dynamic configurations for the case of the two aggregated nanoparticles (one nanoparticle pair) distributing along the x-axis, and (e) the dynamic configurations for the case of the two aggregated nanoparticles (one nanoparticle pair) distributing along the z-axis.
For the case of four nanoparticles, the velocity profiles, the equilibrium configurations of nanofluids, and the dynamic configurations of nanofluids at stable flow are shown in Figure 9. As can be seen in Figure 9(a), the velocity profile of nanofluids which contain the configuration of four nanoparticles clustering as a line is larger than that of other configurations. This is because the configuration of four nanoparticles clustering as a line causes the decrease of flow resistance (see Figure 9(b)), resulting in the increase of the overall volumetric flow rate. On the contrary, the configuration of four nanoparticles clustering as a cube causes the increase of flow resistance (see Figure 9(c)), resulting in the decrease of the volumetric flow rate. In addition, the configuration of two nanoparticle pairs distributing along x direction also causes high velocity profile. This is because the velocity gradient along the z direction causes the vibration and rotation of the two nanoparticle pairs (Figure 9(d)), which results in the increase of the overall volumetric flow rate. The conclusion is consistent with that in Cui et al. 50 The irregular motions of nanoparticles enhances flow rate of nanofluids. 50 It can also be seen from Figure 9(a) that the velocity profiles for the cases of four nanoparticles clustering as a cube are similar with those for the case of four non-aggregated nanoparticles. As for the case of four nanoparticles clustering as a cube, the aggregation of nanoparticles causes the decrease of volumetric flow rate. However, as for the case of four non-aggregated nanoparticles, the nanoparticles are evenly dispersed in the base fluid, which results in the increase of the overall viscosity of nanofluids. The above can be illustrated in Figure 10 which shows the shear viscosity of three configurations (i.e. four non-aggregated nanoparticles, four nanoparticles clustering as a cube, and four nanoparticles clustering as a line) in xy plan, xz plan, and yz plan. The above configurations are consistent with those described in Figure 2(b)–(d). As can be seen in Figure 10(a), the viscosities of all plans are neraly the same when the system reaches equilibrium. It means that the configuration of four non-aggregated nanoparticles enhances the overall viscosity. However, it can be seen from Figure 10(b) and (c) that the viscosity of xz plan is higher than that of xy plan and yz plan for the other two configurations (i.e. four nanoparticles clustering as a line and four nanoparticles clustering as a cube). In the above two configurations, the local viscosity of nanofluids rather than the overall viscosity increases, which is consistent with that in Zhang et al. 36 The local viscosity and flow behavior are influenced by the aggregation of nanoparticles. 36 When the nanoparticles are evenly distributed, the influence of viscosity on volumetric flow rate is dominant. Otherwise, the effects of aggregation, aggregate configuration, and distribution of nanoparticles on the flow of nanofluids in the nanochannels are not negligible.

The velocity profiles, the equilibrium configurations of nanofluids and the dynamic configurations of nanofluids at stable flow for the case of four nanoparticles. (a) The velocity profiles of nanofluids for the case of four nanoparticles, (b) the dynamic configurations for the case of the four nanoparticles clustering as a line, (c) the dynamic configurations for the case of the four nanoparticles clustering as a cube, and (d) the dynamic configurations for the case of the two nanoparticle pairs distributing along x-axis.

The viscosity of four non-aggregated nanoparticles, four nanoparticles clustering as a cube, and four nanoparticles clustering as a line in different plans. (a) The viscosity of four non-aggregated nanoparticles in xy plan, xz plan, and yz plan, (b) the viscosity of four nanoparticles clustering as a cube in xy plan, xz plan, and yz plan, and (c) the viscosity of four nanoparticles clustering as a line in xy plan, xz plan, and yz plan.
Figure 11 shows the velocity distribution of nanofluids with different configurations of nanoparticle aggregation on the upper and lower microchannel skin. Figure 11 can be used to examine the effects of nanoparticle aggregation on the microchannel skin friction. As can be seen in Figure 11, the velocity distributions of nanofluids are larger than that of pure Ar, which is similar with that in Zhang et al. 36 The reason relates to the fact that the density of nanofluids is larger than that of pure Ar. Thus, nanoparticle aggregation results in the decrease of the friction between fluid and microchannel skin. However, the velocity distributions for different configurations of nanoparticle aggregation with same density are nearly the same. This means the configurations of nanoparticle aggregation has little effect on the microchannel skin friction.

The velocity distribution of nanofluids with different configurations of nanoparticles aggregation on the upper and lower microchannel skin. (a) The velocity distribution of nanofluids on upper microchannel skin and (b) the velocity distribution of nanofluids on lower microchannel skin.
Conclusion
The impact of nanoparticle size and nanoparticle aggregation on the flow characteristics of nanofluids was investigated using MDS. The viscosity of nanofluids suspending Cu nanoparticles was calculated by EMD based on G–K formula. In addition, the Poiseuille flow was simulated by the models of nanofluids flowing between two Cu plates to investigate the velocity profile of nanofuilds. The flow characteristics of nanoparticles and the dynamic configuration of nanoparticles in the flow process were revealed, which was of great significance to the investigation of nanofluids. This facilitates the application and preparation of nanofluids in engineering field. The following conclusions were drawn:
The viscosity of nanofluids decreases with the increase of nanoparticle size, which is dependent on the surface area of nanoparticles. Moreover, the above variation trend for smaller nanoparticle size is more obvious than that of larger nanoparticle size.
The existence of the nanoparticle aggregation causes the increase of viscosity of nanofluids. Different configurations of the nanoparticle aggregation result in different viscosities. The highest viscosity can be obtained when four nanoparticles clustering as a line. Compared with the effect of nanoparticle size on viscosity, the effect of nanoparticle aggregation is more obvious.
According to the velocity profiles of Couette flow, nanofluids with different nanoparticle sizes and different configurations of nanoparticle aggregation flowing in the nanochannels can be approximated regarded as viscous Newton fluid.
The volumetric flow rate does not always increase with the decrease of nanoparticle size. The volumetric flow rate of nanofluids is influenced by the amount and size of nanoparticles. The decrease in the size of nanoparticles leads to an increase in the amount of nanoparticles. Excessive nanoparticles cause the increase of the viscosity of nanofluids, resulting in the decrease of volumetric flow rate.
The size and configuration of nanoparticle aggregation influence the flow characteristics of nanoparticle aggregates, which can greatly affect the velocity profiles of nanofluids. Larger nanoparticle aggregates oscillate slightly, which increases the flow resistance of nanofluids. On the contrary, irregular rotation of smaller aggregates increases the volumetric flow rate. Moreover, the resistance of nanofluids depends on the configuration of the nanoparticle aggregation.
The nanoparticle aggregation leads to the increase the local viscosity of nanofluids rather than the overall viscosity. When the nanoparticles are evenly distributed, the overall viscosity of nanofluids increases by the nanoparticle aggregation. Moreover, the influence of viscosity on velocity profiles is dominant. When the nanoparticles are unevenly distributed, the aggregation, aggregate configuration and distribution of nanoparticles have a great impact on the flow of nanofluids in the nanochannels.
Footnotes
Appendix 1
Handling Editor: James Baldwin
Declaration of conflicting interests
The author(s) declared no potential conflicts of interest with respect to the research, authorship, and/or publication of this article.
Funding
The author(s) disclosed receipt of the following financial support for the research, authorship, and/or publication of this article: This work presented in this paper was supported by Scientific Research Project of Beijing Municipal Education Commission, China (KM201810017004). The work was also supported by “Engineering and Technology R&D center of Clean Air Conditioning in Colleges of Shandong (Shandong Huayu University of Technology),” which is hereby greatly acknowledged.