
Abstract
The piped vehicle hydraulic transportation is a new energy-saving and environmental-friendly technique for transporting materials. To optimize the technical parameters of the piped vehicle hydraulic transportation, the transporting energy consumption of the technique was studied by a combination of theoretical analysis and experiments. Experiments were conducted at six piped vehicles with the diameter–length ratios of 0.4, 0.6, 0.47, 0.7, 0.53, and 0.8, seven flow Reynolds numbers of 102,140, 132,413, 167,014, 200,534, 234,037, 267,556, and 299,993, two transporting loads of 1200 and 1500 g, and three pipe layout forms of straight pipe, flat bend pipe, and inclined bend pipe. The results showed that the total energy consumption of the piped vehicle hydraulic transportation increased with increasing flow Reynolds numbers and increasing mass of transporting materials. The total transporting energy consumption of a piped vehicle with the diameter–length ratio of 0.53 was the highest, and that of a piped vehicle with the diameter–length ratio of 0.47 was the lowest. The unit transporting energy consumption of a bend pipe was higher than that of a straight pipe. Meanwhile, the total energy consumption of the piped vehicle hydraulic transportation was analyzed by hydrodynamic theory. The calculation formula for the total energy consumption of the piped vehicle hydraulic transportation was obtained and validated experimentally. The maximum relative error did not exceed 8.07%, proving that the total energy consumption calculation formula of the piped vehicle hydraulic transportation was rational. By analyzing the transporting efficiency of piped vehicle hydraulic transportation under different influencing factors, the optimal transporting combination was the piped vehicle with the diameter–length ratio of z = 0.47 and the flow Reynolds number of Re = 200,534. The results of this study can provide a theoretical basis for optimizing the technical parameters of the piped vehicle hydraulic transportation.
Introduction
With the rapid development of China’s economy and society, the transportation industry is playing an increasingly important role in the development of the national economy. However, as a basic service industry closely related to people’s production and life, the total amount of energy consumed by transportation and its pollution to the environment cannot be ignored. Traditional transportation modes such as highway, railway, aviation, and shipping are basically based on the consumption of gasoline, diesel, and other fossil energy. According to statistics, the fuel consumption of China’s transportation industry accounts for about 40% of the total social fuel consumption.1,2 Such high demand and the annual growth rate caused by the rapid development of the logistics industry put great pressure on oil reserves. Meanwhile, CO, NO, SO2, and other atmospheric pollutants produced by burning gasoline and diesel 3 are not only the crux of global warming, but also the accompanying smoke and dust as well as the dust in the transportation process are all the source of PM2.5 that everyone is worried about. The haze weather formed has caused great harm to people’s health. Therefore, to achieve the sustainable development of the transportation industry, developing clean, energy-saving, low-carbon, green, and safe transportation modes and related technologies has become an important research topic in the field of transportation at present and in the future. The piped vehicle hydraulic transportation is one of energy-saving and environment-friendly transporting technologies based on this concept. In this technique, raw materials are first put into a cylindrical piped vehicle and sealed. Then the piped vehicle is placed into the pipe and transported by the action of the flow.4,5 In the piped vehicle hydraulic transportation technology, the piped vehicle is one of the core components. The piped vehicle is mainly composed of a hollow cylindrical barrel, six small cylindrical braces, and six universal balls. The structural sketch map of the piped vehicle is shown in Figure 1.

Structural sketch map of the piped vehicle: (a) schematic diagram and (b) physical diagram.
The piped vehicle hydraulic transportation was developed based on the molding product pipeline hydraulic transportation. In the molding product pipeline hydraulic transportation technique, the bulk material was first compacted into the cylindrical molding product, followed by transporting the coal logs by pipe over great distances.6,7 The molding product pipeline hydraulic transportation was proposed by H Liu 8 at the University of Missouri-Columbia, resulting in a US patent. Following that, researchers have investigated the hydrodynamics,9,10 design of transportation pipelines,11,12 molding product manufacturing, 13 pressure characteristics of the molding product,14,15 motion characteristics of the molding product,16,17 wear of coal logs, 18 and the drag reduction of the molding product transported. 19 However, in the molding product pipeline hydraulic transportation, the bulk material needs to be molded or extruded into a water- and wear-resistant cylindrical molding product before being transported and the molding product needs to be processed into bulk material after being transported, thus increasing the transportation cost. In addition, the molding product pipeline hydraulic transportation has a narrow range of materials and can only transport single solid powder materials. In addition, the movement of the molding product in pipeline transportation is unstable, colliding the pipe and affecting the safety and service life of the pipe.
Based on this, the piped vehicle hydraulic transportation technology was proposed by S Xihuan et al. 4 Much basic research work was conducted by S Xihuan and his coworkers to study hydraulic characteristics of the piped vehicle hydraulic transportation. S Xihuan and L Yongye. 20 carried out a sensitivity analysis on the main influencing factors of hydraulic characteristics of piped vehicle hydraulic transportation through the standard regression coefficient method and found that water discharge had the greatest influence on it, while the length of the piped vehicle had the least influence. T Xuewei, 21 L Yongye et al.,22,23 and L Dan 24 studied the negative correlation between the average speed of the piped vehicle and the transporting load, and analyzed the influence of the size of the piped vehicle and transporting load on the pressure and velocity characteristics of water flow in the pipe. X Xianan 25 and J Yuanhao et al. 26 studied the hydraulic characteristics of motional boundary concentric annular slit flow under different Reynolds numbers and found that the average velocity of annular slit flow, piped vehicle velocity, and flow velocity were positively correlated with Reynolds numbers. The criterion of the optimum Reynolds number was determined by comparing the flow velocity in the turbulent concentration region with the annular slit flow velocity. Z Xuelan et al. 27 studied the pressure characteristics of the motional boundary annular slit flow under different water discharges and observed that the flow pressure of the pipe section was positively correlated with water discharge. However, for the same pipe section, the pressure from the pipe wall to the wall of the barrel decreased first, then increased, and again decreased. L Xiaoniu 28 studied the hydraulic characteristics of slit flow under static piped vehicles of different structures and found that the larger the diameter of the piped vehicle was, the greater the slit flow velocity was and the greater the pressure variation around the piped vehicle was. Z Xuelan et al., 29 L Yifan et al., 30 and D Xianlun 31 studied the pressure and velocity distribution of annular slit flow with different slit widths in the process of piped vehicle movement and determined the flow pattern in the annular slit. L Fei 32 and S Defang 33 studied the motion characteristics of the piped vehicles and flow velocity characteristics under different diameter–length ratios of the piped vehicles and analyzed the influence of diameter, length of the pipe vehicle, and transporting load on the annular slit flow velocity. Z Chunjin et al. 34 simulated hydraulic characteristics of the annular slit flow with the static boundary based on a 6-degree-of-freedom (DOF) coupling model and found that the pressure of the annular slit flow decreased first, then increased, and again decreased sharply from the inlet to the outlet. There was a positive correlation between annular slit width and the range of low-velocity region of annular slit flow. S Lei et al. 35 simulated the change of the flow field under the cylindrical system formed by the static piped vehicle, divided the flow field within the calculation domain according to the influence strength of the column system, and analyzed the three-dimensional flow velocity characteristics in each region. However, these studies do not provide sufficient information regarding the energy consumption of the piped vehicle hydraulic transportation. The energy consumption characteristics of the piped vehicle hydraulic transportation have not been addressed in order to industrialize the technique of piped vehicle hydraulic transportation. Therefore, in this study, the energy consumption characteristics of the piped vehicle hydraulic transportation were investigated aiming to provide a theoretical basis for optimizing the piped vehicle hydraulic transportation technical parameters.
Experimental procedure
The test device of the piped vehicle hydraulic transportation 36 mainly consisted of the water supply device, test pipe, and delivering and receiving devices for the piped vehicle. At the beginning of each experiment, the pump is turned on to gradually fill the pipe system. After the gas is excluded from the pipe system, the output volume discharge of the pump is set to a predetermined value. After the system stability has been achieved, the photoelectric sensor, the pressure transmitters, and Particle Image Velocimetry (PIV) are powered on, and the braking device is released. The piped vehicle starts running and the experiment begins. During the movement of the piped vehicle, the motional velocity of the piped vehicle is measured using photoelectric sensors, the flow pressure is measured using pressure transmitters and the flow velocity is measured using PIV. When the piped vehicle leaves the test section, the experiment ends. The experimental system is shown in Figure 2.

Experimental system device: (a) schematic diagram and (b) physical diagram.
When the piped vehicle transports the material in the pressure pipe, energy was consumed constantly. The main factors affecting the energy consumption of the piped vehicle hydraulic transportation are flow Reynolds number Re, the diameter–length ratio of the piped vehicle z (the ratio of diameter d (60, 70, and 80 mm) of the piped vehicle to length S (150 and 100 mm) of the piped vehicle), mass of transporting materials M, and the pipe layout form. Flow Reynolds number can be expressed as
Specific experimental parameters.

In this study, the transporting energy consumption of the piped vehicle hydraulic transportation under the above test conditions is analyzed and the relationship between energy consumption and flow Reynolds number, the diameter–length ratio of the piped vehicle, mass of transporting materials, and the pipe layout form is discussed aiming to provide a theoretical basis for optimizing the technical parameters of the piped vehicle hydraulic transportation.
Results and discussion
Total transporting energy consumption analysis under different influencing factors
Taking the piped vehicles with the diameter–length ratios (z) of 0.53, 0.47, and 0.80 as examples, the total transporting energy consumption values were analyzed during transporting materials at the mass of transporting materials (M) of 1200 and 1500 g and flow Reynolds number (Re) values of 132,413 and 234,037. The result is shown in Figure 3, indicating that the following:
The pipe vehicles with three diameter–length ratios had different lengths and diameters. When the water flowed around the piped vehicle, the sharp decrease of the wetted cross section at the entrance and the enlargement of the wetted cross section at the exit end both would inevitably consume some energy. In addition, the distribution of the slit flow field between the pipe and the piped vehicles was certainly different with different diameter–length ratios of the piped vehicles. The diameter of the piped vehicle directly affected the cross-section area while the flow was running around the piped vehicle. The length of the piped vehicle directly affected the length of annular slit flow between the piped vehicle and the pipe. Therefore, the diameter–length ratio of the piped vehicle surely affected the total energy consumption of the piped vehicle hydraulic transportation. As analyzed above, the piped vehicle with the diameter–length ratio of 0.53 consumed the most energy, the piped vehicle with the diameter–length ratio of 0.8 consumed the second most energy, and the piped vehicle with the diameter–length ratio of 0.47 consumed the least energy.
The heavier the mass of the transporting materials was, the more energy the pipeline vehicle consumed. The main reason was that the heavier the mass of transporting materials, the greater the frictional resistance of the piped vehicle, the more energy the work done against friction consumed, and thus the higher the total transporting energy consumption was.
The larger the flow Reynolds number was, the greater the total energy consumption of the piped vehicle hydraulic transportation was. The main reason is that the head loss of the flow in the pipe was proportional to the flow velocity. The larger the flow Reynolds number was, the greater the flow velocity was and thus the greater the total transporting energy consumption was.

Changes of the total energy consumption on the piped vehicle with different diameter–length ratios.
Unit transporting energy consumption under different test pipes
Unit transporting energy consumption was defined as the energy it consumed that the unit load of the material was transported within unit length. Taking the piped vehicles with the diameter–length ratios (z) of 0.53, 0.47, and 0.80 as examples, the unit transportation energy consumption of different test pipes was analyzed. The result is shown in Figure 4, indicating the following:
1. The unit transporting energy consumption of the piped vehicle was different with the different pipe layout forms. The unit transporting energy consumption in the inclined bend pipe was the highest, followed by the flat bend pipe, and the lowest in the straight pipe.

Unit energy consumption of piped vehicles with different diameter–length ratios in different pipe layout forms: (a) M = 1200 g and Re = 132,413; (b) M = 1200 g and Re = 234,037; (c) M = 1500 g and Re = 132,413; and (d) M = 1500 g and Re = 234,037.
For the straight pipe, the transporting energy consumption can be divided into two parts: one part was used to overcome the frictional water head loss along the pipe; the other part was used to overcome the additional energy consumption generated by the flow around the piped vehicle.
For the flat bend pipe, one part of the transporting energy consumption was used to overcome the frictional water head loss along the pipe and the local water loss at the inlet and outlet of the bend pipe, and the other part was used to overcome the additional energy consumption generated by the water flow around the piped vehicle. When the piped vehicle went through the bend pipe, due to eccentric exercise in the bend pipe, the friction force between the pipe wall and the piped vehicle increased so that the transporting energy consumption increased. Therefore, the unit transporting energy consumption was higher.
Similarly, for the inclined bend pipe, the conveying energy consumption is also composed of the above two parts. However, in the inclined bend pipe, the pressure on the piped vehicle in the vertical direction was greater than that in the flat bend pipe so that the friction force was greater than that in the flat bend pipe. As a result, its transportation energy consumption was also greater than that in the flat bend pipe. Thus, unit transporting energy consumption in the inclined bend pipe was the highest.
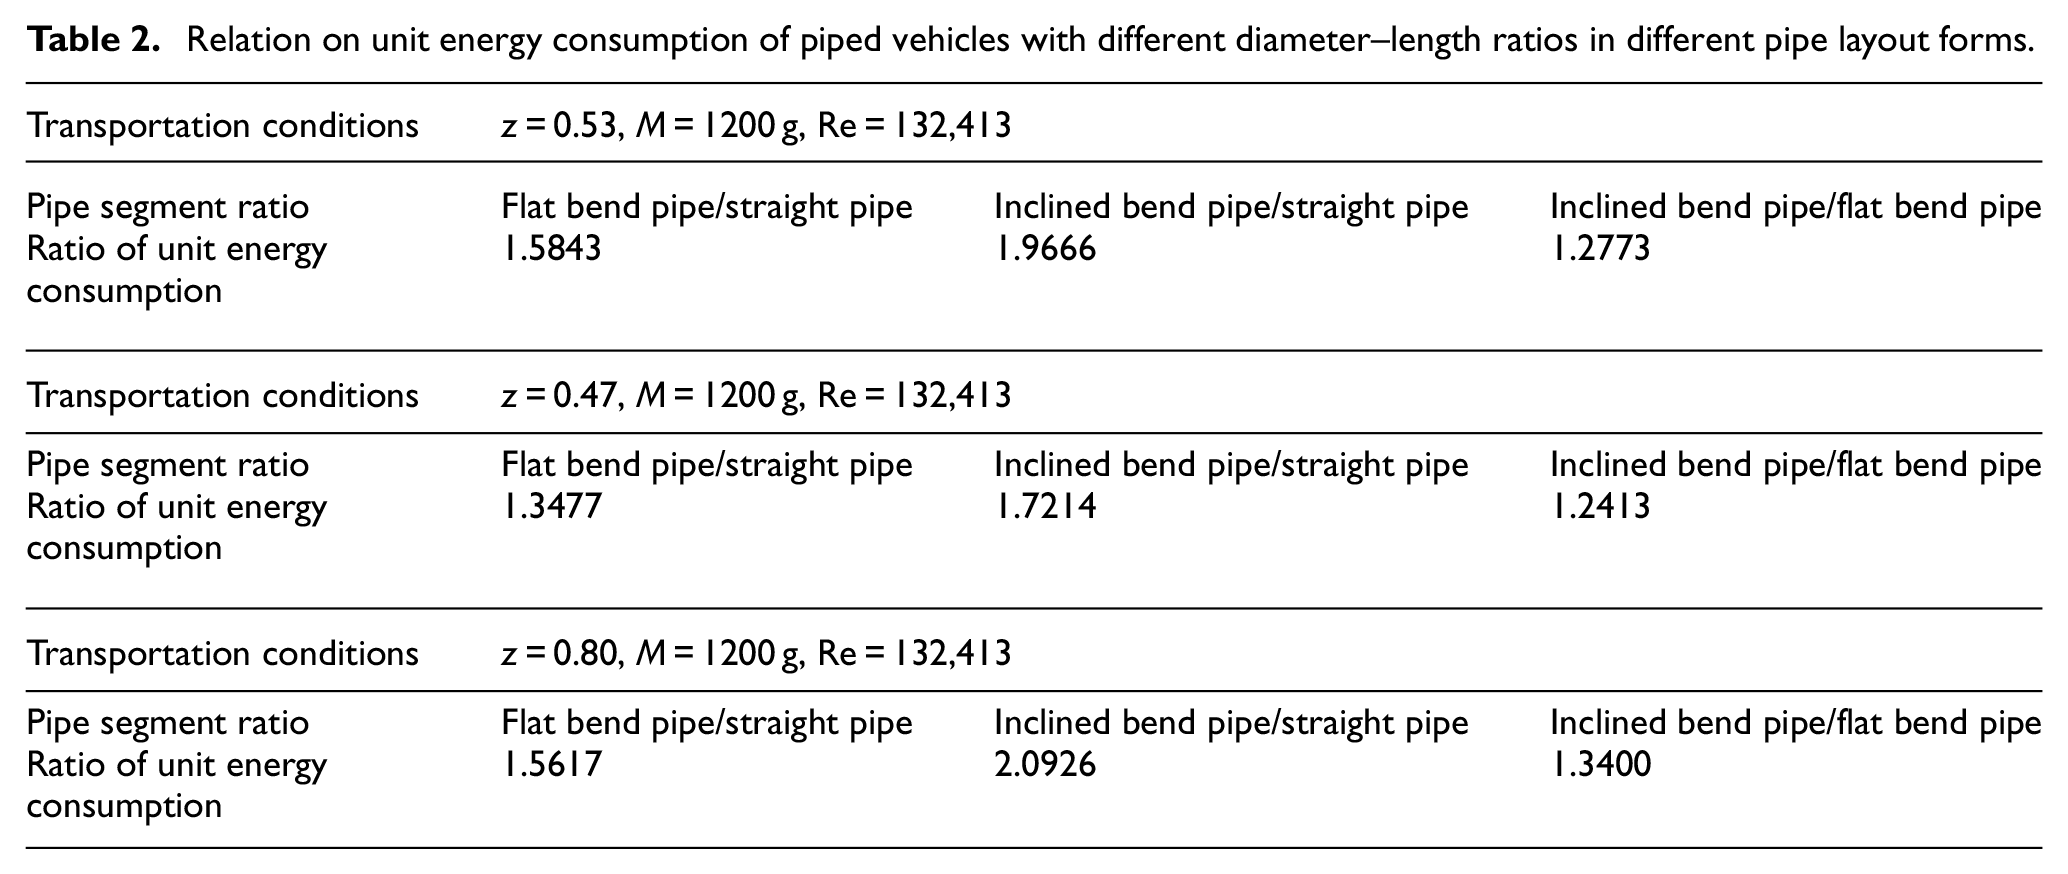
2. Table 2 shows the relationship between unit transporting energy consumption of piped vehicles with different diameter–length ratios in three pipe layout forms under such transporting conditions as shown in Figure 4(a). It can be seen from Table 2 that the unit transporting energy consumption of the bend pipe was much higher than that of the straight pipe. When the piped vehicle hydraulic transportation was put into use, the transportation of the straight pipe should be the first choice, and the transportation of the bend and climbing pipes should be reduced as much as possible or avoided, so as to reduce energy consumption during the transportation.
Relation on unit energy consumption of piped vehicles with different diameter–length ratios in different pipe layout forms.
Total energy consumption analysis of the piped vehicle hydraulic transportation
The total energy consumption was an important parameter in the design of the piped vehicle hydraulic transportation. The total energy consumption of piped vehicle hydraulic transportation Hw was composed of the energy consumption of flow in the pipe hw and the additional energy consumption of flow around the piped vehicle Δhw. It can be expressed as follows

Energy consumption of flow in the pipe hw
The energy consumption of flow in the pipe hw mainly included the frictional water head loss along the pipe

where

Frictional resistance coefficient

where
Additional energy consumption of flow around the piped vehicle
When the piped vehicle moved steadily in the pipeline at an average speed v, the coordinate system was established on the piped vehicle. According to Galileo’s relativity principle, the uniform flow in the pipe bypassed the piped vehicle at the velocity of v1 – v. For the coordinate system established on the piped vehicle, the energy equation of the flow bypassing the front and rear sections of the piped vehicle can be expressed as
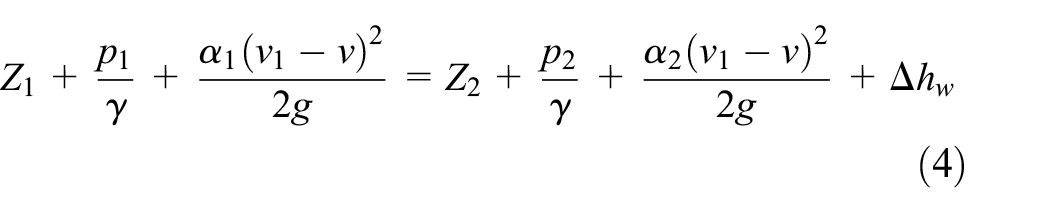
where Z1 and Z2 are the position heads of the front and rear sections of the piped vehicle, respectively; p1/γ and p2/γ are the pressure heads of the front and rear sections of the piped vehicle, respectively;
In this test, since the pipe diameter remains unchanged and
Equation (4) can be expressed as

It can be observed from equation (5) that when the piped vehicle moved in the pipe and the flow passed by the piped vehicle, the additional energy consumption of the flow around the piped vehicle was the difference between the piezometric heads of the front and rear sections of the piped vehicle.
The additional energy consumption of the flow around the piped vehicle mainly comprised three parts: the additional energy consumption at the annular slit entrance of the piped vehicle

Additional energy consumption at the annular slit entrance of the piped vehicle
The additional energy consumption at the annular slit entrance of the piped vehicle was mainly caused by the sudden reduction of the piped wetted area. According to the analysis of head loss caused by the sudden reduction of flow wetted area, the additional energy consumption at the annular slit entrance of the piped vehicle is calculated by the concentric pipe annular slit entrance loss formula and can be expressed as

where

where
Local head loss coefficient

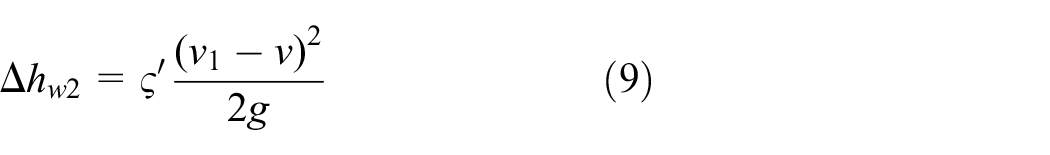
Additional energy consumption at the annular slit exit of the piped vehicle
The additional energy consumption at the annular slit exit of the piped vehicle was mainly caused by the sudden expansion of the pipe wetted area. According to the analysis of head loss caused by the sudden expansion of the flow wetted area, the additional energy consumption at the annular slit exit of the piped vehicle was calculated by the concentric pipe annular slit exit loss formula. The calculation principle was the same as that of the energy consumption at the annular slit entrance of the piped vehicle. The form of the formula was the same as equation (8) and can be expressed as
where

By comparing equations (8) and (10), it can be found that
Additional energy consumption of the concentric annular slit flow segment between the piped vehicle and the pipe
According to the Darcy formula, the additional energy consumption of the concentric annular slit flow segment between the piped vehicle and the pipe can be expressed as

where v2 is the average velocity of the concentric annular slit flow, v2 – v is the difference between the average speed of annular slit flow and the average speed of the piped vehicle. According to the law of conservation of mass, v2 – v can be expressed as

where ρ is the water density and Δt is the motion period.
Therefore
where
For the concentric annular slit flow, Reynolds number can be defined as

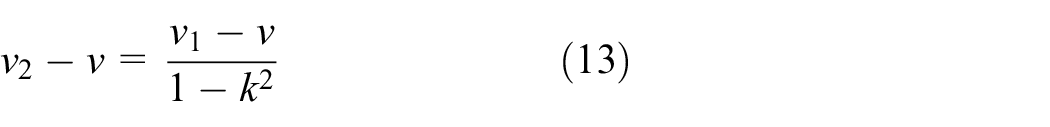
In this test, according to the analysis of the movement characteristics of the piped vehicle in the pressurized pipeline, it can be known that
Substituting equation (13) into equation (11) yielded the following

Substituting equations (7), (9), and (15) into equation (6), the additional energy consumption of flow around the piped vehicle Δhw can be expressed as
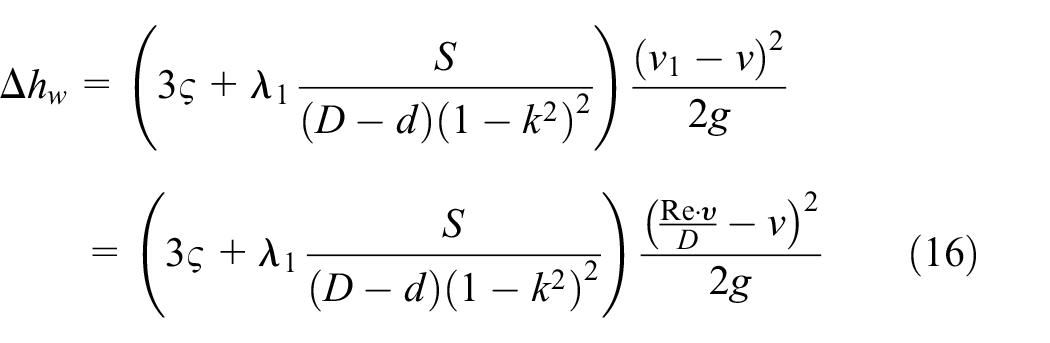
Taking the piped vehicle with the diameter–length ratios of z = 0.47 and z = 0.80 as an example, the additional energy consumption of the water flow around the piped vehicle can be calculated by formula (16) at the mass of transporting materials of M = 1200 g and M = 1500 g and flow Reynolds numbers of 102,140, 132,413, 167,014, 200,534, 234,037, 267,556, and 299,993, and the value was compared with the experimental results, as shown in Figure 5.

Additional energy consumptions of the piped vehicles passed by water for different Reynolds numbers: (a) M = 1200 g and (b) M = 1500 g.
As shown in Figure 5, the calculated additional energy consumption value of the flow around the piped vehicle was in good agreement with the experimental results, which showed a trend of increase first and then decrease. The reason was that the additional energy consumption of the flow around the piped vehicle was mainly related to the difference between the average speed of annular slit flow and the average speed of the piped vehicle. Figure 6 shows the change of the difference between the average speed of annular slit flow and the average speed of the piped vehicle with the flow Reynolds number. As shown in Figure 6, the difference between the average speed of annular slit flow and the average speed of the piped vehicle also tended to increase first and then decrease with the increase of flow Reynolds number. Therefore, the relationship between the average speed of annular slit flow and the average speed of the piped vehicle with the flow Reynolds number basically reflected the change trend of the additional energy consumption of the flow around the piped vehicle with the flow Reynolds number. That is to say, the change trend of the additional energy consumption of the flow around the piped vehicle was consistent with that of the difference between the average speed of annular slit flow and the average speed of the piped vehicle. Meanwhile, it can be seen from Figure 5 that the calculated value of the additional energy consumption of the flow around the piped vehicle was in good agreement with the experimental results, and the maximum relative error did not exceed 4.10%, confirming that the calculated formula of the additional energy consumption of the flow around the piped vehicle was feasible. Therefore, the additional energy consumption of flow around the piped vehicle calculated by equation (16) can be used to replace the experimental value in practical application.

Changed curves of speed differences on pipe flow average speeds and average speeds of the piped vehicle for different Reynolds numbers: (a) M = 1200 g and (b) M = 1500 g.
Total energy consumption formula of the piped vehicle hydraulic transportation
Substituting equations (2) and (16) into equation (1), the total transporting energy consumption of the piped vehicle hydraulic transportation Hw can be expressed as

The comparison between the total energy consumption of the piped vehicle hydraulic transportation calculated according to equation (17) and the total energy consumption of the piped vehicle hydraulic transportation obtained from the test listed in Table 5 indicated a good agreement between the calculated value of the total energy consumption of the piped vehicle hydraulic transportation and the experimental value, and the maximum relative error did not exceed 8.07%, confirming that the formula of the total energy consumption of the piped vehicle hydraulic transportation was feasible.
Comparison of the calculated and experimental values of the total energy consumption of the piped vehicle hydraulic transportation.

Transporting efficiency of the piped vehicle hydraulic transportation
The transporting efficiency of the piped vehicle hydraulic transportation was directly related to its energy consumption and the piped vehicle speed. Therefore, in order to improve the transporting efficiency, it was necessary to optimize the piped vehicle speed and energy consumption and strive to transport more materials in the shortest time the least energy consumption, so as to achieve the purpose of economic transportation. However, the transporting efficiency was positively correlated with the unit transportation capacity, so the unit transportation capacity was introduced to study the transport efficiency.
The unit transportation capacity is defined as the ratio of the mass of the transporting material to the transporting time and total energy consumption at the same transporting distance. It can be expressed as
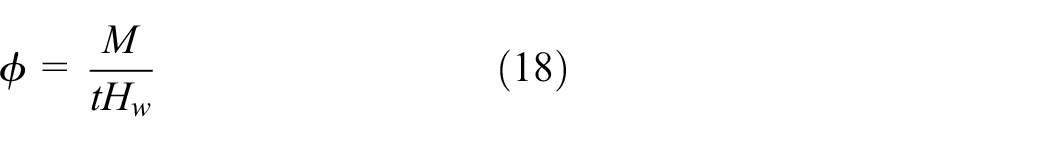
where
Using equation (18), the unit transportation capacity of the piped vehicle hydraulic transportation was calculated. The result is shown in Figure 7, indicating the following:
The change trend of unit transportation capacity of the piped vehicle with flow Reynolds number first increased and then decreased. This indicated that there was an optimal transporting flow Reynolds number. When the piped vehicle transported materials at the flow Reynolds number, its unit transportation capacity was the maximum, that is, its transporting efficiency was the highest.
Unit transportation capacity was related to the diameter–length ratio of the piped vehicle. From the perspective of the changes in the unit transportation capacity of the piped vehicles with different diameter–length ratios, it can be seen that there was an optimal diameter–length ratio of the piped vehicles, which maximizes the unit transportation capacity and hence its transporting efficiency.

Unit transport capacity under different Reynolds numbers.
In summary, it can be seen that there was an optimal transporting combination for the piped vehicle hydraulic transportation. From Figure 7, it can be seen that the optimal transporting combination was the piped vehicle with the diameter–length ratio of z = 0.47 and the flow Reynolds number of Re = 200,534.
Conclusion
The total energy consumption of piped vehicle hydraulic transportation was composed of the energy consumption of flow in the pipeline and the additional energy consumption of flow around the piped vehicle. The calculation formula for the total energy consumption of the piped vehicle hydraulic transportation was obtained by hydrodynamic theory and validated experimentally. The maximum relative error did not exceed 8.07%, proving that the total transportation energy consumption calculation formula was feasible.
The total energy consumption of the piped vehicle hydraulic transportation is related to the mass of the transporting material, flow Reynolds number, diameter–length ratio of the piped vehicle, and the pipe layout form. The total energy consumption of the piped vehicle hydraulic transportation decreased with decreasing Reynolds number and decreasing mass of transporting materials. The unit transporting energy consumption of the bend pipe was higher than that of the straight pipe. The total transporting energy consumption of the piped vehicle with the diameter–length ratio of 0.53 was the highest, and that of the piped vehicle with the diameter–length ratio of 0.47 was the lowest.
Through analyzing the transporting efficiency of piped vehicle hydraulic transportation under different influencing factors, the optimal transporting combination was obtained, that is, the piped vehicle with the diameter–length ratio of z = 0.47 and flow Reynolds number of Re = 200,534.
Footnotes
Handling Editor: James Baldwin
Declaration of conflicting interests
The author(s) declared no potential conflicts of interest with respect to the research, authorship, and/or publication of this article.
Funding
The author(s) disclosed receipt of the following financial support for the research, authorship, and/or publication of this article: The authors acknowledge the financial support from the National Science Foundation of China (No. 51179116) and Shanxi Provincial Natural Science Foundation of China (No. 201701D221137).