
Abstract
Skin deformation caused by contact with an object is transduced into nerve signals by tactile mechanoreceptors, allowing humans to perceive tactile information. Previous research has revealed that the mechanical state associated with finger skin deformation at mechanoreceptor locations in a finite element model is correlated with the experimentally measured responses of slowly adapting type I mechanoreceptors. However, these findings were obtained under static contact conditions. Therefore, in this study, we calculated the von Mises stress at slowly adapting type I and rapidly adapting type I mechanoreceptor locations during dynamic scanning of a textured surface using a finite element model of the human finger. We then estimated the hypothetical responses of the mechanoreceptors and compared the estimated results with the nerve firing of the receptors in previous neurophysiological experiments. These comparisons demonstrated that the temporal history of von Mises stress at mechanoreceptor locations was more strongly correlated with the “number of” impulses (R2 = 0.93 for slowly adapting type I and R2 = 0.90 for rapidly adapting type I) than the impulse “rate” (R2 = 0.58 for slowly adapting type I and R2 = 0.53 for rapidly adapting type I). Our findings suggest that the temporal history of von Mises stress can be used to roughly estimate the number of impulses of mechanoreceptors during scanning of a textured surface.
Introduction
Tactile perception provides us with physical information regarding the external world, especially the shape, material, and motion of objects. Moreover, human beings can perceive shape and roughness by moving their fingers over textured surfaces. Therefore, in order to understand the mechanisms underlying tactile perception, it is important to understand the responses of tactile mechanoreceptors under transient dynamic conditions. Moreover, in order to develop more advanced tactile sensors and robots that can perceive the shapes and roughness of textured surfaces, it is also important to be able to predict the responses of these receptors under transient dynamic conditions.
Previous studies have demonstrated that skin deformation caused by contact between the skin and an object is transduced into nerve signals by tactile receptors (i.e. mechanoreceptors), allowing humans to perceive tactile information. 1 In in-vivo experiments, however, it is difficult to measure the specific mechanical state (e.g. stress or strain) of the skin in order to determine the effect of finger structure on the perception of tactile information. Therefore, several researchers have evaluated the mechanical state associated with mechanical stimuli at typical mechanoreceptor locations using finite element (FE) analysis, providing further insight into the mechanisms underlying tactile perception.2–5 One previous study revealed that the mechanical state (e.g. strain energy density (SED) and maximum principal strain) at mechanoreceptor locations is correlated with the experimentally measured nerve firing rate (impulse rate) in slowly adapting type I (SA-I) afferent nerve fibers. 2 An additional study 6 further revealed that some mechanical states can account for the responses of SA-I and rapidly adapting afferents to indented spatial patterns. These findings suggest that the mechanical state at mechanoreceptor locations can account for the impulse rate of the receptors, which may in turn be an indicator for estimating mechanoreceptor responses using FE models. However, these investigations were based on the results of computational models of static finger contact with objects. Gerling et al. 7 have developed an FE model coupled with a neurophysiological model for accurately predicting the firing pattern and timing of mechanoreceptor responses. However, they did not deal with transient dynamic problems (i.e. problems during scanning of a textured surface). Additional studies have simulated scanning of textured surfaces involving the fingertip.8–10 While some studies8–10 utilized methods similar to ours, they only estimated the mechanical state at mechanoreceptor locations and did not reveal any correlation between the mechanical state and the nerve responses of actual mechanoreceptors. Therefore, this study aimed to investigate the relationship between the transient mechanical state and mechanoreceptor responses under transient dynamic conditions (e.g. scanning of a textured surface).
Prior to our investigation, we hypothesized that the estimated pattern of nerve firing during transient dynamic stimulation differs depending on whether the “temporal history” of the mechanical state is correlated with the impulse “rate” or the “number of” impulses (Figure 1), whereas the previous study 2 only investigated the correlation between the mechanical state and the nerve impulse “rate” under static conditions. For example, the temporal history of the mechanical state at a mechanoreceptor location can be obtained via numerical analysis, as shown in Figure 1(a). Assuming that this temporal history is correlated with (i.e. represents) the temporal change in the number of impulses, the relationship between time and the number of impulses can be described as shown in Figure 1(b). The impulse rate can then be estimated using the gradient of the graph in Figure 1(b), leading to the results shown in Figure 1(c). In this case, the pattern of nerve signals is expressed as shown in Figure 1(d). In contrast, assuming that the mechanical state (Figure 1(a)) is correlated with (i.e. represents) the temporal change in the impulse rate, the relationship between time and the impulse rate is described as shown in Figure 1(e). The number of impulses can then be estimated based on Figure 1(e), as shown in Figure 1(f). In this case, the pattern of nerve signals is expressed as shown in Figure 1(g). Figure 1(d) and (g) show that the estimated pattern of nerve firing changes substantially depending on whether the temporal history of the mechanical state is correlated with the number of impulses or the impulse rate.

The estimated pattern of nerve firing differs depending on the indicator utilized (i.e. whether the mechanical state is regarded as hypothetically representing the “number of” impulses or the impulse “rate”).
In this study, we aimed to investigate the relationship between the transient mechanical state and mechanoreceptor responses under transient dynamic conditions during scanning of a textured surface. We simulated dynamic phenomena during the scanning of textured surfaces using a two-dimensional (2D) FE model representing the cross-section of a human index fingertip. In addition, we estimated the responses of SA-I and rapidly adapting type I (RA-I) mechanoreceptors during texture scanning under the assumption that the temporal history of the mechanical state at mechanoreceptor locations represents the number of impulses or the impulse rate. We then determined the correlation between the estimated results and experimental measurements of mechanoreceptor responses, based on the neurophysiological analyses by Phillips et al. 11 This investigation ascertained which assumption in Figure 1 would be relevant to actual mechanoreceptor responses during the scanning of textured surfaces, and it was expected to suggest the indicator for roughly estimating mechanoreceptor responses during the scanning of textured surfaces.
Methods
Tactile stimulation experiment
This study included data from 17 human volunteers (10 women and 7 men) ranging in age from 20 to 33 years.
11
Figure 2 (top) presents a schematic description of the experimental apparatus. The drum, the surface of which contained embossed dots, contacted the finger pad and was rotated to simulate stimulation to the skin when a finger is scanned across a textured surface. The contact force was 0.6 N, while the scanning velocity was 60 mm/s. Nerve impulses were recorded from a single tactile afferent with tungsten needle electrodes inserted percutaneously, following which the impulse rate was calculated. An example of experimental results is also shown in Figure 2 (bottom). This example shows the relationship between the mean impulse rate measured from an SA-I afferent during surface scanning and the spacing of dots along the textured surface. The data were obtained from the figure
11
using SimpleDigitizer software. In the experiment, dot spacing refers to Dot spacing A in Figure 2. However, we adopted Dot spacing B to align with the computational model mentioned later. Therefore, the y-axis of the graph in Phillips et al.’s
11
study (i.e. Dot spacing A) was converted into Dot spacing B

Experimental apparatus and experimental results for mean impulse rate measured from a slowly adapting type I (SA-I) afferent during scanning of a textured surface for each pattern of dot spacing. 11
FE model
The finger is composed of four tissue layers including the stratum corneum, epidermis, dermis, and subcutaneous tissue. The interface between the epidermis and the dermis contains dermal papillae. There are fingerprints on the outermost surface of the finger skin. The FE model of this study included these four layers, as well as bony tissue and a fingernail. Structures such as dermal papillae and fingerprints were also included in the model because these structures are thought to play an important role in tactile perception. 3 Although these structures should essentially be constructed as three-dimensional (3D) models, this leads to increases in computational cost because the 3D structures of fingerprints and dermal papillae are complex. Therefore, this study adopted a 2D structural model representing the cross-section of the fingertip, as previously described.2,3,9,10 A cross-section in the direction of finger width or in the proximal-to-distal direction (Figure 3) can be chosen to represent the cross-section of a finger as a 2D structural model. In the neurophysiological experiment, 11 the textured surface moved in the proximal-to-distal direction of the finger. Thus, we developed a 2D structural model of the cross-section in the proximal-to-distal direction of the index finger for this study. The cross-section was created from the tip of the finger to the distal interphalangeal joint, as shown in Figure 4. The external shape and the position of distal phalanx correspond to those of the model constructed from computed tomography images by Shimawaki et al. 12 The thicknesses of the stratum corneum, epidermis, dermis, and nail were assumed to be 0.17, 13 0.65,3,9 0.8,3,9 and 0.7 mm, 9 respectively. The widths of fingerprints were assumed to be 0.45 mm (vortex section of fingerprint, Fingerprint-A in Figure 4(b)) and 4 mm (longest part at center of fingerprint, Fingerprint-B in Figure 4(b)), with a height of 0.11 mm. 14 Assuming that the dermal papillae can be represented by a sine wave, the period and amplitude were set to 0.22 and 0.36 mm, respectively. 3 The locations of SA-I and RA-I mechanoreceptors evaluated in this study are also shown in Figure 4(c). This 2D model was divided into FEs, four-node quadratic plane strain elements (including a few constant strain triangle elements). There were approximately 20,000 elements and 40,000 degrees of freedom. The textured surface contained trapezoidal dot structures with a 0.7-mm flat top, a base of 1.0 mm, and a height of 0.5 mm, as utilized in the neurophysiological experiment. 11

A cross-section in the direction of the finger width and the proximal-to-distal direction of the finger.

A two-dimensional finite element model representing the cross-section of human index fingertip: (a) overall view including a textured surface, (b) details of the dermal papillae, fingerprints, and textured surface, and (c) one of the typical locations of slowly adapting type I (SA-I) and rapidly adapting type I (RA-I) mechanoreceptors, at which von Mises stress was evaluated in this study.
Material model
As described later, it is assumed that large deformations in the finger pad occur due to a contact force from the textured surface. In this study, large deformations were handled by adopting a neo-Hookean model. The SED function for a neo-Hookean model
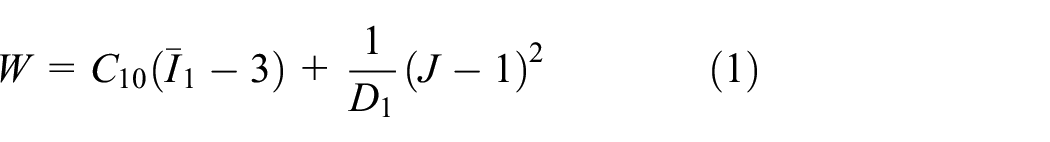
where
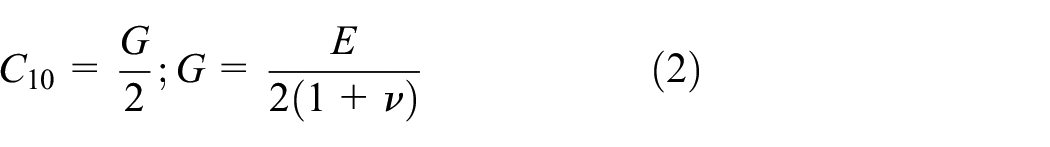

Table 1 shows the identified material coefficients

where
Material properties of the fingertip model.

Simulation
In the neurophysiological experiment, 11 the finger pad was compressed by a force of 0.6 N from the textured surface. In this simulation, compression was applied by enforced displacement to the textured surface in the positive Y-axis direction (Figure 4), and the finger pad of the model contacted the textured surface. In the procedure for the simulation, the iterative method was used to calculate the equilibrium of forces toward the governing equation. In this case, when we treat the interaction problem with force control, the iterative method may not yield a converged solution. To avoid this problem, we converted force control to displacement control, although force control was utilized for experiments. The enforced displacement was 1.72 mm, which corresponds to the displacement calculated by the 3D FE finger model (Figure 5(a)) contacting a textured surface with a dot spacing of 1.41 mm when compressed with a force 0.6 N. Figure 5(b) shows the result calculated for this relationship. In addition, Figure 5(c) shows that the adopted 3D model can account for the relevant reaction force of an actual finger contacting a flat plate. The structural and material parameters of the 3D model were identical to those of the 2D model, although the 3D model did not include dermal papillae and fingerprints. Serina et al. 19 conducted the experiment on 20 human volunteers (12 men and 8 women) ranging in age from 22 to 58 years, while Shao et al. 20 conducted the experiment on 12 human volunteers (6 men and 6 women) ranging in age from 18 to 45 years. Moreover, Figure 5(d) shows the validation of the skin surface deflection for the present FE model. The finger pad was indented by the stimulator with the sharp edge (with a 0.025-mm radius of curvature), and the indented displacement was 1.0 mm. 21 Srinivasan 21 conducted the experiments on three human volunteers (age: 25–30 years). In the 2D model, it took 0.125 s to reach the displacement of 1.72 mm, 18 and the surface of the nail and the end face of the distal phalanx were fixed as boundary conditions. While maintaining the compressing displacement to the finger pad, the textured surface was then translated in the negative X-axis direction at a maximum velocity of 60 mm/s, which took approximately 0.175 s to reach. 18 The maximum velocity corresponds to that observed in the neurophysiological experiment. 11 In these ways, stimuli were imposed from the textured surface to the finger pad. Furthermore, the dot spacing was varied (8, 6, 4, 3, 2, and 1.41 mm) to evaluate changes in the mechanical state at mechanoreceptor locations for each pattern of dot spacing. Simulations were carried out using a commercial FE code in Abaqus (SIMULIA, DASSAULT SYSTEMS, France).
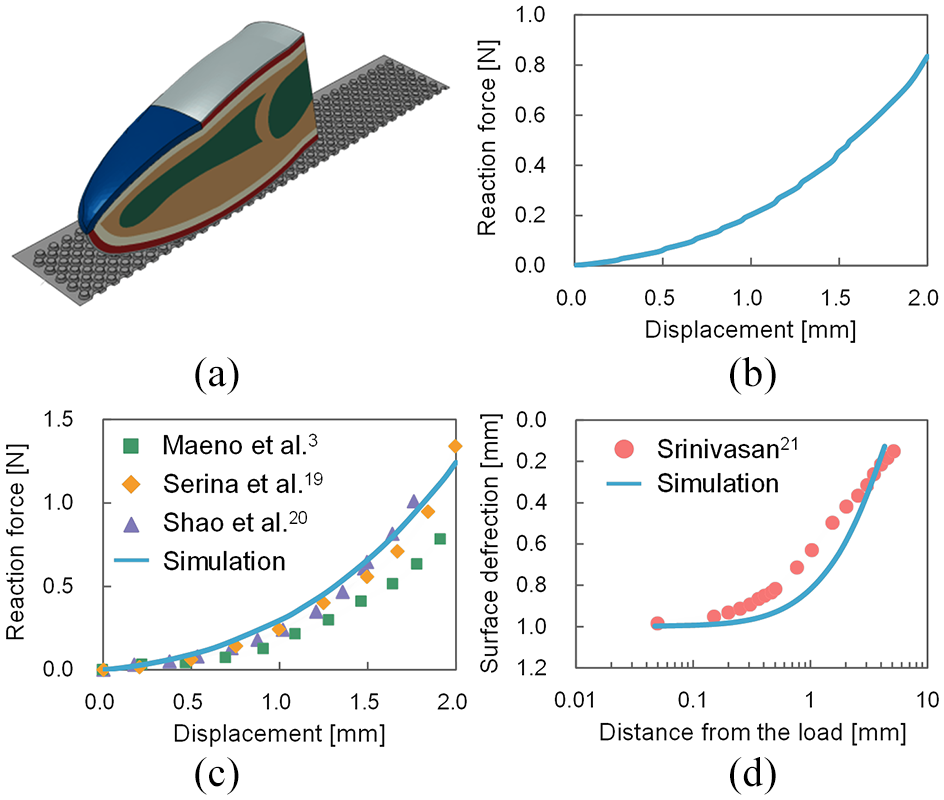
(a) Three-dimensional finite element finger model (half model). The structural and material parameters of this model were identical to those of the two-dimensional model, although the three-dimensional model did not include dermal papillae and fingerprints. (b) Force–displacement relationship calculated by the three-dimensional model contacting the textured surface with a dot spacing of 1.41 mm. The enforced displacement for the two-dimensional model was determined based on this relationship. (c) Validation of the adopted three-dimensional model by comparing with the experimentally measured reaction force3,19,20 of the finger (experimental results are shown as dots in the figure). The model can account for the relevant reaction force of an actual finger contacting a flat plate. (d) Validation of the skin surface deflection for the present finite element model. The finger pad was indented by the stimulator with the sharp edge (with a 0.025-mm radius of curvature), and the indented displacement was 1.0 mm. 21
Analysis
This study evaluated the mechanical state at mechanoreceptor locations stimulated by the contact between the finger pad and a texture surface. We evaluated those values at SA-I and RA-I mechanoreceptor locations because these receptors are considered to play a role in perceiving the shape and spacing of a textured surface. 11 Figure 4(c) shows the typical locations of each receptor evaluated in this study. We chose to evaluate von Mises stress as a measure of mechanical state based on previous analyses.3,5,9,10,22 Srinivasan and DandekaR 2 have indicated that SED is relevant to SA-I mechanoreceptor responses. SED can be converted to von Mises stress when dealing with incompressible materials, as in this study. Therefore, we used von Mises stress (more detailed reasons are presented in the Discussion). For RA-I mechanoreceptors, the values of von Mises stress at each node (Figure 4(c)) were averaged. The temporal history of von Mises stress at mechanoreceptor locations was regarded as hypothetically representing the number of impulses or impulse rate to estimate the responses of mechanoreceptors (refer section “Introduction”). Figure 6(a) shows the outline of the flow from the simulation to the comparison with the experimental results. Figure 6(b) shows the temporal history of von Mises stress obtained via the method described in the previous section. This temporal history represents the mechanical state at SA-I mechanoreceptors for a dot spacing of 3.0 mm.

A schematic description of the method used to analyze the simulation results: (a) the outline of the flow from the simulation to the comparison with the experimental results, (b) the temporal history of von Mises stress obtained from a finite element model at a slowly adapting type I (SA-I) mechanoreceptor location with a dot spacing of 3.0 mm, and (c) image of von Mises stress analysis under the assumption that the stress represents the number of impulses or impulse rate.
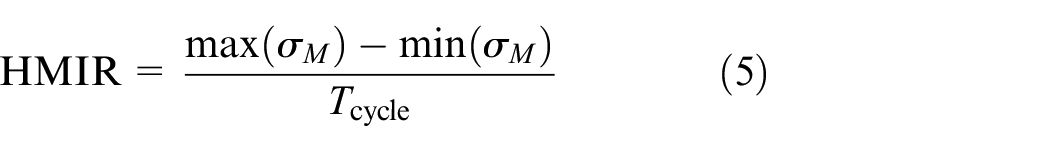
According to previous studies, 23 SA-I and RA-I mechanoreceptors respond more actively under conditions during which the magnitude of the stimulus changes than during the application of a constant stimulus. In the previous neurophysiological experiment, for example, impulse rates were low when textured surfaces with invariable, narrow dot spacing were scanned. 11 Therefore, these findings suggest that steady-state components of the temporal history of von Mises stress exert less influence on nerve firing. Hence, in order to extract characteristic features of the variations in von Mises stress based on the stimuli applied, we analyzed the difference from the minimum value (Figure 6(b)_(A)). In addition, several studies1,24,25 have confirmed that SA-I mechanoreceptors do not respond during the unloading phase of stimulus application. Therefore, these findings suggest that SA-I mechanoreceptors do not respond when von Mises stress begins to decrease. Thus, assuming that the temporal history of von Mises stress represents temporal changes in the number of impulses, the difference (Figure 6(b)_(A)) between the minimum and maximum values of the von Mises stress in one cycle (Figure 6(b)) can be regarded as the total number of impulses evoked in that cycle (Figure 6(c)). By dividing this value by the time required for one cycle as shown in equation (5), the simulation derives the number of impulses per unit time (i.e. the average (mean) impulse rate during scanning of the textured surface), as shown in Figure 2
where

where

where
Results
Figures 7 and 8 show the temporal history of von Mises stress at SA-I and RA-I mechanoreceptor locations (Figure 4(c)) obtained using the present FE model during scanning of a textured surface, respectively. The period from one peak to another peak of the von Mises stress corresponds to the time required for one fingerprint to move from one dot to the next. Thus, the contact between the finger pad and each dot of the textured surface can be said to have caused each peak of the von Mises stress. In addition, the peak decreased along with decreases in dot spacing. This is because, when the dot spacing was narrow, the load was dispersed on the contact surface between the textured surface and the finger pad, such that the force (stress) applied at each mechanoreceptor location was also small. Previous neurophysiological experiments 11 have also reported that the number of impulses from SA-I and RA-I mechanoreceptors caused by each dot decreased along with decreases in dot spacing.
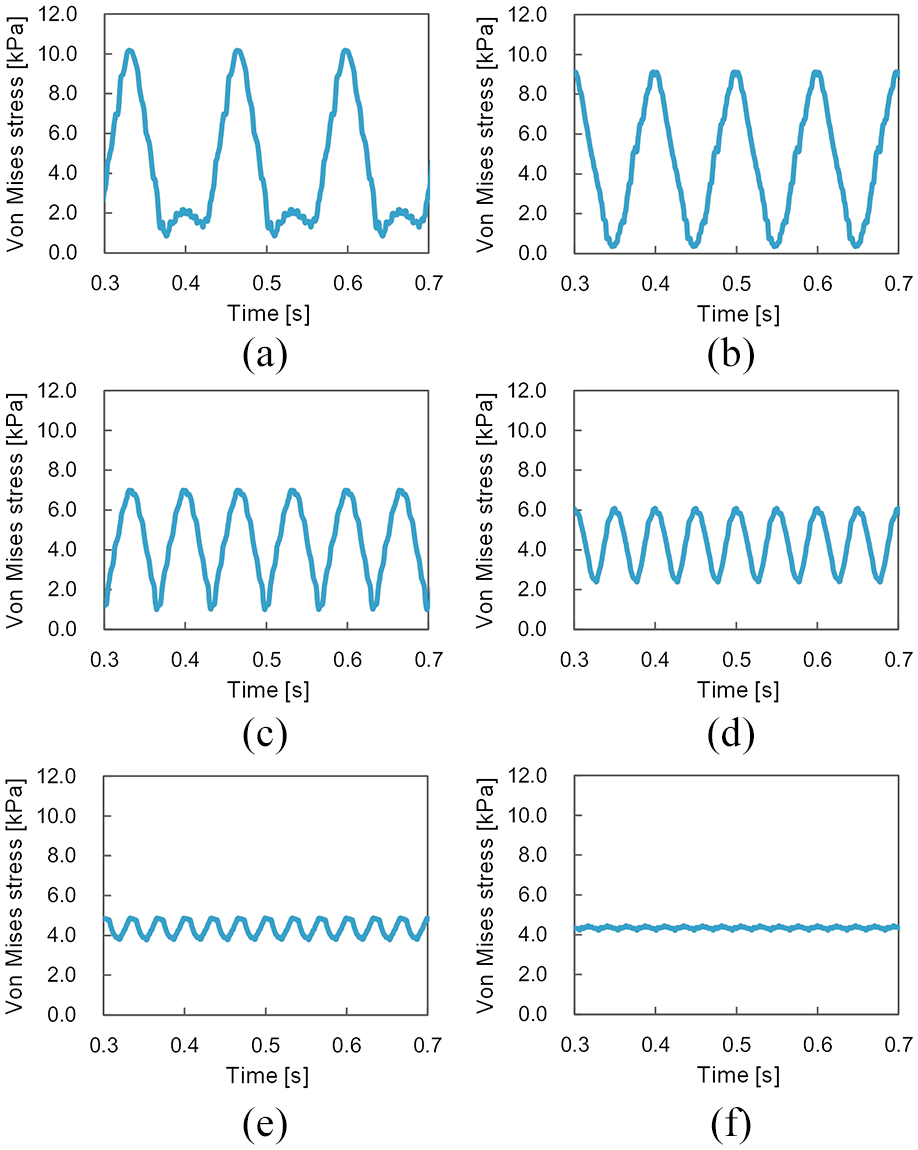
Temporal history of von Mises stress at slowly adapting type I (SA-I) mechanoreceptor locations during simulated scanning of a textured surface: (a), (b), (c), (d), (e), and (f) represent dot spacing patterns of 8, 6, 4, 3, 2, and 1.41 mm, respectively.
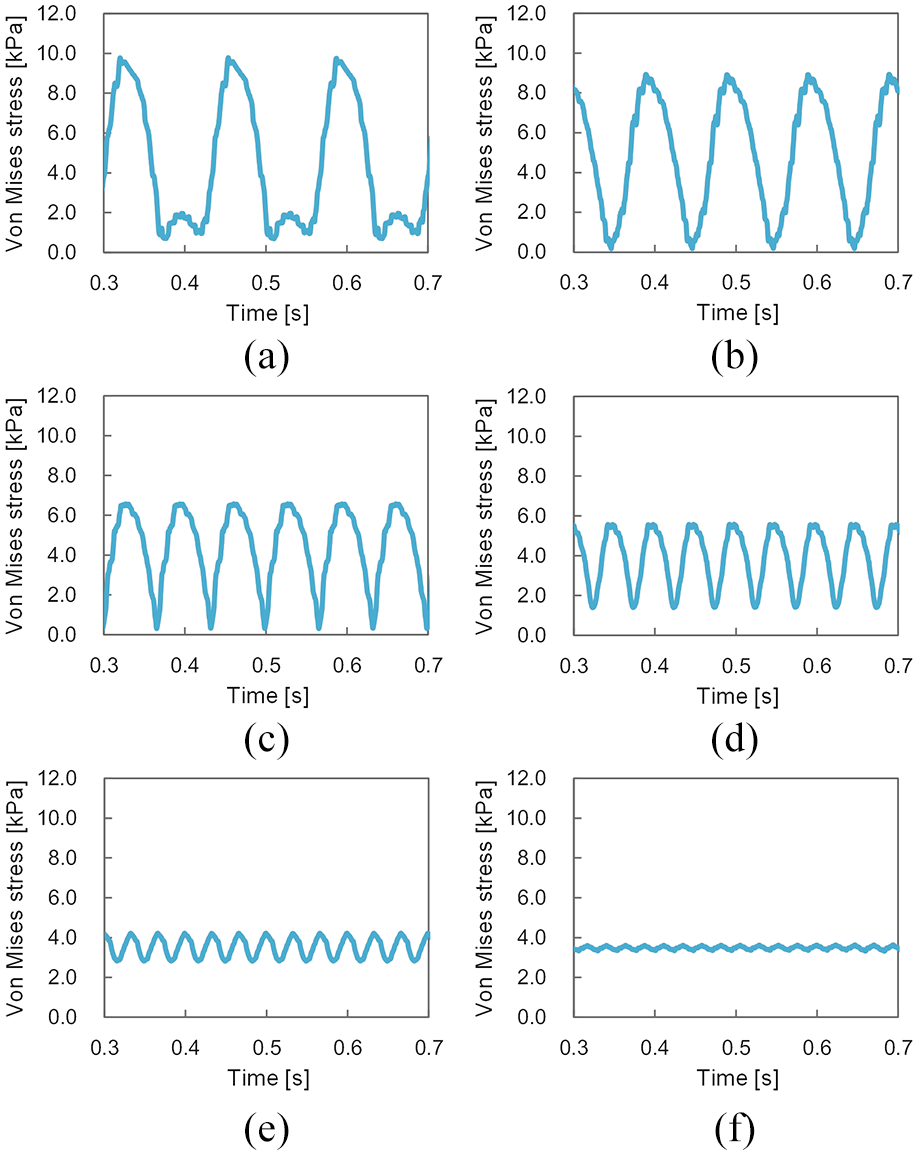
Temporal history of von Mises stress at rapidly adapting type I (RA-I) mechanoreceptor locations during simulated scanning of a textured surface: (a), (b), (c), (d), (e), and (f) represent dot spacing patterns of 8, 6, 4, 3, 2, and 1.41 mm, respectively.
Figures 9 and 10, which show estimated mean impulse rates in scanning of a textured surface toward each dot spacing, include comparisons of computational and experimental results for SA-I and RA-I mechanoreceptors, respectively. These figures were derived via Figures 7 and 8, and via the analysis mentioned in the Methods. Figures 9(a), 9(b), 10(a), and 10(b) show the results obtained by assuming that the temporal history of von Mises stress represents temporal changes in the number of impulses. Figures 9(c), 9(d), 10(c), and 10(d) show the results obtained by assuming that the temporal history of von Mises stress represents temporal changes in the impulse rate. Figures 9(b), 9(d), 10(b) and 10(d) show the correlation between the computational and experimental results. Our analysis indicated that the computational results for both SA-I and RA-I mechanoreceptors were more strongly correlated with the experimental results under the assumption that the temporal history of von Mises stress represents temporal changes in the number of impulses, rather than under the assumption that they represent changes in the impulse rate. Therefore, these findings suggest that the temporal history of von Mises stress at mechanoreceptor locations should be regarded as representing the number of impulses rather than the impulse rate when attempting to estimate the response of mechanoreceptor firing during dynamic scanning of textured surfaces.

Comparisons between experimental results 11 and computational results for normalized mean impulse rates toward each dot spacing at a slowly adapting type I (SA-I) mechanoreceptor location: (a) results derived by assuming that the temporal history of von Mises stress represents temporal changes in the number of impulses, (b) correlation between computational results and experimental results in (a), (c) results derived by assuming that the temporal history of von Mises stress represents temporal changes in the impulse rate, and (d) correlation between computational results and experimental results in (c).

Comparisons between experimental results 11 and computational results for normalized mean impulse rates toward each dot spacing at a rapidly adapting type I (RA-I) mechanoreceptor location: (a) results derived by assuming that the temporal history of von Mises stress represents temporal changes in the number of impulses, (b) correlation between computational results and experimental results in (a), (c) results derived by assuming that the temporal history of von Mises stress represents temporal changes in the impulse rate, and (d) correlation between computational results and experimental results in (c).
Discussion
Models for estimation of mechanoreceptor responses contribute to the advancement of robotics, the development of tactile devices, and enhancements in our understanding of the mechanisms underlying tactile perception. One previous study 2 reported that the mechanical state associated with finger skin deformation at mechanoreceptor locations in FE models is correlated with the experimentally measured responses of SA-I mechanoreceptors. This finding suggests that the mechanical state at mechanoreceptor locations can account for the responses of the mechanoreceptors, which may in turn be useful for estimating mechanoreceptor responses and human tactile perception using FE models. However, these findings were obtained under static contact conditions. In this study, we aimed to investigate the relationship between the transient mechanical state and mechanoreceptor responses under transient dynamic conditions during scanning of a textured surface. We estimated the von Mises stress at SA-I and RA-I mechanoreceptor locations during dynamic scanning of a textured surface using an FE model of the human fingertip. By assuming that the temporal history of von Mises stress at mechanoreceptor locations represents temporal changes in the number of nerve impulses or the nerve impulse rate, we estimated the responses of SA-I and RA-I mechanoreceptors. We then determined the correlation between the estimated results and experimental measurements of mechanoreceptor responses, based on the neurophysiological analyses by Phillips et al. 11
Our findings demonstrated that the estimated results were more strongly correlated with previous neurophysiological findings 11 under the assumption that the temporal history of von Mises stress represents the number of impulses than under the assumption that it represents the impulse rate. Previous studies have confirmed the relationship between stimulus application and the impulse rate of SA-I and RA-I mechanoreceptors, as shown in Figure 1(a) and (c).25–27 Considering this observation, it can be assumed that increases in the intensity of the stimulus will influence the number of impulses. Hence, the computational results were more strongly correlated with previous neurophysiological findings 11 under the assumption that the temporal history of von Mises stress represents the number of impulses than under the assumption that it represents the impulse rate. Moreover, other previous studies have reported that the impulse rate of SA-I and RA-I mechanoreceptors is sensitive to changes in stimulus intensity.28,29 Therefore, the impulse rate is assumed to be correlated with the time differential of von Mises stress rather than the temporal history of von Mises stress. This assumption is supported by the relationship observed between the number of impulses and the impulse rate.
Gerling et al. 7 have developed an FE model coupled with a neurophysiological model for predicting mechanoreceptor responses. However, they did not address transient dynamic problems (i.e. problems during scanning of a textured surface), in contrast to this study. Moreover, they did not discuss our hypothesis as stated in the Introduction. Although Maeno and Kobayashi 8 simulated transient dynamic problems in their study, they only investigated the mechanical state at mechanoreceptors, and they did not discuss the correlation between the mechanical state and actual mechanoreceptor responses. Our study is advantageous in relation to previous work in that we addressed transient dynamic problems (e.g. scanning of a textured surface) and compared the temporal history of the mechanical state to actual mechanoreceptor responses.
Von Mises stress was used as a proxy for the responses of SA-I and RA-I mechanoreceptors, although there were other candidates. Srinivasan and Dandekar 2 demonstrated that SED is relevant to SA-I afferent firing responses under static contact conditions. SED can then be converted to von Mises stress when dealing with incompressible materials, as in this study. In addition, von Mises stress and SED are scalar values that can convert a multidimensional field into a scalar field. Previous studies have suggested that mechanoreceptors respond to stimuli from various directions rather than one direction.2,30 Von Mises stress and SED are very useful barometers in such cases. Note that we did not use von Mises stress as a yield function for materials engineering. On the contrary, considering that nerve firing is evoked by the opening of mechanosensitive ion channels in response to receptor membrane deformation, 30 it may be appropriate to deal with strain rather than stress because deformation is described by strain, not by stress. Indeed, previous studies have also verified that the mechanical state involved in strain is relevant to the SA-I afferent firing response.2,6 Von Mises stress can be converted into equivalent strain by dividing by the elastic modulus, which is useful when dealing with stimuli from multiple directions. Thus, we used von Mises stress in this study. In addition, as previously described, because von Mises stress and SED exhibit similar responses when dealing with incompressible materials, 22 results (Figures 9(a) and 10(a)) may be similar when using von Mises stress and SED. This indicates that the temporal history of SED may be also more strongly correlated with the “number of” impulses than with the impulse “rate” as well as using von Mises stress.
The skin exhibits viscoelastic behavior (i.e. stress-relaxation response), which can also be observed in the human finger. However, we omitted the viscoelastic model from the present FE model. If we use a generalized Maxwell model with prony series to describe viscoelastic behavior, the maximum values of von Mises stress (Figures 7 and 8) will decay in accordance with the prony series. However, this decay was not an essential factor in this study because the rates of decay are the same for each dot spacing, and the decayed values are normalized for comparisons with experimental results. In the normalization process used in this study, the differences in von Mises stress between each dot spacing were essential, and the differences are constant over viscoelastic behavior in accordance with the prony series. In addition, if it is assumed that nerve firing (opening of mechanosensitive ion channels) is evoked by strain (von Mises stress can be converted into equivalent strain) rather than stress, it is not necessary to consider viscoelastic behavior (stress-relaxation response).
Previous studies1,24,25 have confirmed that SA-I mechanoreceptors do not respond during the unloading phase of stimulus application. Thus, we assumed that SA-I mechanoreceptors do not respond when von Mises stress begins to decrease. On the contrary, some researchers have demonstrated that there may be several sub-types of SA-I afferent classes that respond to the unloading phase. 31 Although further research is required to verify this hypothesis, we tentatively adopted the widely known assumption that SA-I mechanoreceptors do not respond during the unloading phase of stimulus application.
SA-I and RA-I mechanoreceptors were selected for comparisons between simulations and experiments because these receptors are considered to play an important role in perceiving the shape and spacing of a textured surface. 11 Although we did not aim to investigate and discuss the difference between the responses of SA-I and RA-I mechanoreceptors in this study, it may be possible to estimate this difference by considering the effect of the frequency characteristics of each mechanoreceptor. 32 Figure 11 shows the method for estimating the difference between the responses of SA-I and RA-I mechanoreceptors, and Figure 11(d) shows the results obtained via this method. Figure 11(b) shows the adopted frequency characteristics of SA-I and RA-I mechanoreceptors. Note that each frequency characteristic in Figure 11(b) was determined by referring to previous experimental data, 32 while the characteristics of SA-I mechanoreceptors were slightly modified to align with the mechanoreceptor responses observed by Phillips et al. 11 It seems that the modification was not a serious issue because individual differences in the mechanoreceptor response were observed even for the same type of receptor. These results (Figure 11) suggest that considering the frequency characteristics of each mechanoreceptor may be effective in accounting for the difference between the responses of SA-I and RA-I mechanoreceptors and that measuring their characteristics under various conditions can aid in modeling these responses.

Method for estimating the difference between the responses of SA-I and RA-I mechanoreceptors: (a) the original von Mises stress (Figure 8(d)). (b) The frequency characteristics of SA-I and RA-I mechanoreceptors. 32 A Fourier transform was applied to the original von Mises stress, and the transformed value was subjected to frequency-domain filtering. (c) The response after filtering. This response was analyzed using equations (5) and (6) as previously indicated. (d) Results obtained using this method. Our results suggest that this method may be effective in accounting for the difference between the responses of SA-I and RA-I mechanoreceptors.
In this study, we did not aim to develop a perfect model for precisely describing mechanoreceptor responses. We aimed to investigate which assumption in Figure 1 would be relevant to actual mechanoreceptor responses during the scanning of textured surfaces. Moreover, the investigation was expected to suggest an indicator for roughly estimating the characteristics of mechanoreceptor responses (e.g. differences in nerve firing rates based on differences in the stimulus at various dot spacings) during the scanning of textured surfaces. To more precisely estimate the responses of mechanoreceptors and determine the underlying mechanisms, a perfect model would need to deal with other biophysical mechanisms, such as neural adaptation and mechanoreceptor morphology. However, if we only estimate the rough tendencies of mechanoreceptor responses, the present model and method may provide sufficient results without the use of a high-performance model. In fact, the present model and method were effective in estimating the tendencies of mechanoreceptor responses. Moreover, Srinivasan and Dandekar 2 and Sripati et al. 6 were also successful in estimating the tendency of mechanoreceptor responses during static contact using strategies similar to ours. Although our model and method cannot be used to precisely predict the firing pattern and timing of mechanoreceptors including neural adaptation mechanisms, they were successful in estimating the characteristics of mechanoreceptor responses during the scanning of a textured surface.
Johnson and colleagues have combined psychophysical and neurophysiological studies of the neural coding mechanisms underlying roughness perception.33–36 They suggested that the best method involves spatial variation in the firing rates of SA-I afferents (mean absolute difference in firing rates between SA-I afferents with receptive fields separated by 2 mm). If the mean firing (impulse) rate is obtained using the present model and method, one may be able to predict roughness perception when used in conjunction with the previously suggested method. Moreover, the present model calculates contact interaction with actual object shapes. Therefore, the present FE model is advantageous in which it can also be expected to predict roughness perception for various textured shapes.
Although our results exhibited a strong correlation with experimental findings, this study possesses some limitations of note. As in previous studies,2,3,9,10 we adopted a 2D model of the cross-section of the fingertip to reduce computational costs. However, using the 2D model may influence the skin surface deflection, as shown in Figure 5(d), and this influence may be stronger as dot spacing increases. In fact, the difference between the simulation results and the experimental data 11 (Figures 9(a) and 10(a)) was largest when the dot spacing was 8 mm. This result suggests that more accurate results can be obtained using a 3D FE model. In addition, a neo-Hookean model and Rayleigh damping were tentatively used to material models, as it remains to be determined which model is best suited for simulating scanning of a textured surface and estimating mechanoreceptor firing during tactile perception. Thus, further studies involving additional structural and material models are required to verify our findings. Furthermore, the results shown in Figures 9 and 10 indicate the hypothetical profile of mechanoreceptor firing only. As mentioned earlier, the present model and method cannot precisely predict mechanoreceptor responses such as the firing pattern and timing of mechanoreceptors, including mechanisms of neural adaptation. Finally, there is no guarantee that the present method of analysis can be used to estimate the characteristics of mechanoreceptor responses during any dynamic stimulation of the finger pad. Further studies are required to investigate the validity of the proposed method based on comparisons with additional experimental results.
Conclusion
In this study, we aimed to investigate the relationship between the transient mechanical state and mechanoreceptor responses under transient dynamic conditions during scanning of a textured surface. We estimated the responses of SA-I and RA-I mechanoreceptors during scanning of a textured surface using a 2D FE model representing the longitudinal cross-section of a human index finger. The estimated responses were compared with the results obtained from neurophysiological experiments. 11 For the estimation, the temporal history of von Mises stress at the mechanoreceptor locations was assumed to represent the temporal changes in the number of nerve impulses or nerve impulse rate. Our estimated results were more strongly correlated with previous experimental findings under the assumption that the temporal history of von Mises stress represents temporal changes in the number of impulses, rather than the impulse rate. These findings suggest that the temporal history of von Mises stress at SA-I and RA-I mechanoreceptor locations can be used as an indicator for temporal changes in the number of impulses. Moreover, this indicator may contribute to the development of advanced tactile sensors and robots that can perceive the shapes and roughness of textured surfaces. However, although the present model and method were effective in estimating the tendencies of mechanoreceptor responses during scanning of a textured surface, they cannot precisely predict the firing pattern and timing of mechanoreceptor responses, including mechanisms associated with neural adaptation. In addition, to verify these findings, future studies should aim to validate the structural and material models adopted in this study and address the limitations of the present methods.
Footnotes
Handling Editor: James Baldwin
Declaration of conflicting interests
The author(s) declared no potential conflicts of interest with respect to the research, authorship, and/or publication of this article.
Funding
The author(s) received no financial support for the research, authorship, and/or publication of this article.