
Abstract
This article presents an experimental study on the dynamic behaviour of granular material that forms the bed of a curved fluid flow passage. The secondary vortex structures induced by the passage curvature profoundly influence the stability of the granular material and determine the varying bed profiles subjected to the processes of erosion and sedimentation in the flow passage. For examining the characteristics of the bed profile, the current study develops a non-intrusive measurement method whereby transient changes occurring at the granular bed interface are captured for a range of flow operating conditions. The test results indicate three distinct regimes of onset, transition and quasi-stable erosion–sedimentation in the curved passage over the experimental test range. Each stage is analysed and discussed for the observed intricacies of the flow structures and the bed reshaping behaviour, with respect to the timescale of these occurrences, influences of the flow rate and granular particle size.
Introduction
The presence of the secondary vortex structures, inclusive of Dean vortices, is a well-known flow feature in curved flow passages, giving rise to additional fluid mixing, flow turbulence and pressure drop. In a curved flow passage, the mechanistic principle of centrifugal action induces radially driven fluid motion to produce the secondary flow. This radial motion combines with the axial fluid flow and establishes a unique vortex flow structure in curved passages, making these flow patterns vastly different to those in straight ducts. The secondary flow structures exaggerate the wall shear, as such viscous effects are contributed by both the lateral motion of the secondary flow and the axial fluid flow. Inspired by the challenging fluid mechanics, the characteristic of flow in curved passages have been receiving significant attention in the analyses and applications involving multi-phase momentum, heat and mass exchanges.
In a curved passage with a bed of granular material, when the fluid flow is sufficiently strong, wall shear imparted by the secondary flow structure tends to dislodge granular particles and shift them radially over the passage cross-section (i.e. laterally) as well as axially in the flow direction. These two erosion mechanisms are mutually interactive and determine the subsequent sedimentation of the dislodged material while influenced by the secondary flow. Consequently, curved passages exhibit essentially different granular bed erosion and sedimentation profiles in the flow passage compared to those in straight ducts, where only the axial flow imparts particle movement.
Erosion and sedimentation processes subjected to the secondary flow effects are common occurrences in nature. For example, in river flow over bends, sand is carved out from the bed by the water at the outer flow boundary while the eroded sand is deposited at the inner flow contour. Thus, the river flow at bends indicates higher water depth at outer boundary where ground erosion and changes to landscape are more prevalent. Behaviour of tornados follows a similar flow principle that imparts a higher devastating impact on the outer core of the whirling fluid column. In industrial applications such as slurry (granular) flow in mining, pipe abrasion affecting protective lining is much exaggerated at pipe bends due to the lateral particle movement from the secondary flow. These swirling vortices also tend to segregate heavy particles at inner pipe bend, thus potentially creating flow blockages. Similar flow behaviour and adverse impact are observed with immiscible multi-phase fluid mixtures flowing through pipe bends, where phase separation is an inevitable phenomenon.
Recognising scientific challenges and industrial significance, the fundamental and applied problem of granular bed behaviour submerged in a flowing fluid has been scientifically studied through the onset of erosion, the pattern of bed reshaping and timescale of transitions,1–7 without the influence of the secondary flow. Similarly, an extensive knowledge base is reported on the secondary flow behaviour in curved ducts with many analytical, experimental and numerical modelling studies, and a wide range of applicable methodologies in the field.8–17 However, studies on granular bed erosion in the presence of the secondary flow remain virtually unexplored due to the mechanistic complexities embedded in this flow situation. Accordingly, the literature reporting erosion–sedimentation process in curved ducts is practically non-existent.
The current study addresses this shortfall through an experimental investigation of erosion and sedimentation processes in a curved passage with granular material forming the bed of the flow passage. A calibrated non-intrusive methodology is developed for observing the transient changes in bed profiles for extracting qualitative three-dimensional descriptions of bed characteristics and quantitative analysis of the transient processes.
Granular media are defined as being composed of grains typically larger than 100 µm1 and exhibit characteristics similar to both solid and fluid media. The behaviour of granular media is classified into three regimes: (1) dense-quasi static regime (characterised by frictional contact between grains), (2) liquid regime (driven by both collision and friction) and (3) gaseous regime (characterised by binary collisions among grains). The transitions between the regimes and associated thresholds remain as active research challenges for various flow configurations.1,2 The spectrum of analysis ranges from the importance of granular interphase (i.e. particle interactions) and fluid (i.e. viscous and inertial) forces. Based on these, either the granular phase could be treated as discrete or as a continuous phase interacting with the fluid phase. To determine which force is more dominant, additional attributes of granular phase such as density ratio, packing density, micro-structures and wettability of granules need to be accounted for as non-fluid parameters. Although the microscopic effects of grain interaction have a marked effect on the macroscopic nature of granular systems, 3 the granular phase may behave as a fluid in certain circumstances. 4
Sediment transport is a mechanism acting on the interface between the fluid and granular material, referred to as the bed. Van Rijn 5 explains four possible mechanisms through which a granule is transported across an erodible bed. First, single grain is removed from the bed and deposited downstream. Second, the grain could migrate by rolling of individual grains along the bed or third by undergoing fluidisation and moving as two-phase flow. Fourth and finally, the granule could be carried away and remain in suspension with the carrier fluid.
Incipient particle motion is demarcated as being between a static (non-erodible) and dynamic bed (eroding bed) in a straight passage. 6 This threshold is estimated using the Shield curve (empirical correlation), based on dimensionless shear stress, and is also referred to as the Shields parameter. The Shields parameter, in its purest form, is defined as the ratio of horizontal forces over vertical forces, acting on a submerged particle. The curve was developed by obtaining critical shear stress (as grain movement is initiated) using wide- and open-channel plumes. The turbulent shear at the bed material and the effects of intergranular configurations have been shown to be inherently statistical problems. The original curve has undergone multiple additions, revisions and modifications; yet, it remains as one of the robust approaches of granular analysis, since it was valid for a wide range of density ratio of granular–fluid combinations. 7 Miller et al. 7 extended and improved the fundamental idea of Shields curve by identifying new parameters, which were not accounted for in the original curve.
Most advances in the field focus on the erosion–sedimentation processes of axial flow, whereas the influence of the secondary vortices and local flow structures do remain scientifically unexplored. The curvature-induced secondary flow is one of the commonly seen flow patterns which are likely to form during granular–fluid interactions. The secondary flow, as a single-phase phenomenon, is well known as a result of the decades of experimental and numerical analyses. Spiralling flow patterns induced by centrifugal force and Dean instabilities were foci of research two decades after Reynolds pioneering work in straight flow channels. 8 The occurrence of counter-rotating vortices has been investigated to understand the mechanism of formation and their influence on transport phenomena. The most significant developments have been the flow visualisation techniques for the indication of unique spiral structure,9–11 improvement of verification and physical validation of flow modelling,9,11,12 quantitative evaluation of transport augmentation10,12 and the role of various channel cross-sectional parameters. Nonetheless, the investigation of the secondary flow in multi-phase fields was not as developed until the recent advances in investigative techniques that enable the examination of interfacial transport and exchange phenomena across various phase combinations.
Sharma et al. 14 carried out extensive tests to investigate the hydrodynamic behaviour of Kerosene water in return bends connecting two horizontal conduits. The primary objective of this multi-phase flow analysis was to measure pressure drop in the U-shaped tube and compare it with other possible return shapes (e.g. rectangular). Their experiment also briefly reported phase separation and various multi-phase regimes in the presence of centrifugal force. Nadim and Chandratilleke 15 developed a computational fluid dynamics (CFD) model of immiscible fluids (kerosene and water) in a curved channel, utilising it for more deterministic analysis of the multi-phase secondary flow analysis. With advanced numerical modelling, this work provided visualisation of the vortices structure and their interactions within each phase and across interfaces. The numerical analysis also explained the hydrodynamic process of phase distribution and its consequent effect on contour-rotating Dean vortex cells for immiscible fluid combinations.
Euler–Euler Granular Phase (EEGP) model is a relatively contemporary approach which has been implemented for various applications including in curved ducts. 16 Based on many sub-closures (solid pressure, granular temperature and drag force), EEGP is still considered to be an evolving model which needs to be calibrated, examined and validated for each applied configuration. Chandratilleke and Nadim 16 utilised an EEGP model to investigate the influence of the secondary flow on erosion–sedimentation of a granular bed in a curved duct with a rectangular cross-section. This provided a deterministic foundation for examining the dynamic interaction between the granular bed and the secondary flow structure, and for predicting and analysing the variation of the bed profile under various flow conditions. Such interactions have a two-way influence, namely the bed shape variation over the channel cross-section, in the axial direction, as well as the imparted secondary flow effects. This work accurately accounted for the lateral and axial erosion/sedimentation occurring in curved passage granular bed. Nonetheless, proper model validation was not possible due to the non-availability of reliable and applicable experimental data. The reported study fulfils this need and is based on practical and less expensive non-intrusive method for measurement rather than the complex particle image velocimetry (PIV) and laser-induced fluorescence (LIF) analyses.
The current investigation sets out to experimentally trace the fluid–bed interface over time (temporal interrogation) and across the curved section (spatial interrogation) for interpreting the interaction of spiral flow structure and granular phase. Such indications, alongside with the current understanding of the secondary flow structure, could explain the intensity of lateral vortices, their combined effect with the axial flow and the timescale of variation. The test section used is a transparent 180° curved rectangular passage filled with sand to form the flat channel bed along its length. An array of laser beams is utilised to illuminate discrete points across the bed interface, hence allowing precise measurement of bed height with the help of an image processing technique. A number of tests are carried out to investigate and report the influence of flow rate as the primary parameter of interest while various particle size ranges are compared to obtain possible size influence. It is realised that conducting particulate flow measurements is expensive and challenging due to the interference of discrete phase with particle illuminator and instead, the examination of bed dynamics is more feasible and practical for a better understanding of this phase interaction.
Experimental methodology
Test apparatus and design considerations
The experimental set-up with its functional components is shown in Figure 1. The test set-up essentially consists of a transparent rectangular curved duct 1 with a granular sand bed, a straight flow entry duct, 2 a straight flow outlet duct 3 and a water circulation loop comprising a centrifugal pump, 4 two flow meters,5,6 a flow control valve 7 and a flow directional valve. 8

The experimental set-up with the flow loop.
Figure 2 illustrates the detail arrangement of the curved test section which is 225 mm in radius with a cross-section of 125 mm × 50 mm. A uniform and flat granular sand bed of height 50 mm forms the bottom of this curved passage over which the working fluid, water, flows. The water is directed to the curved passage through the 500-mm-long straight rectangular entry duct 2 having matching cross-sectional dimensions to the curved test section. The bottom of this entry duct is level with the top surface of the sand bed in the curved duct, ensuring smooth flow entry. The straight outlet duct 3 is also similarly arranged to receive the water flow smoothly from the test section. The apparatus is designed and developed to deliver a practically steady flow regime of the secondary flow behaviour in a range that has been well investigated for single-phase fluid flow. For this reason, duct aspect ratio, duct curvature ratio, sand bed height, and inlet and outlet duct extensions have been carefully chosen to satisfy the specific flow requirements based on the published data.

Curved test section with granular bed.
For arresting any flow disturbances affecting the sand bed, a swirl impediment chamber 9 is incorporated into the entry duct and filled with plastic beads, as illustrated in Figure 3(a). As an additional precaution in preventing suspended particle circulation, a mesh filter is also fitted to the inlet pipe of the swirl impediment chamber. A settling tank 10 is used at the end of the outlet duct to capture and separate any sand particles carried by the flowing water, as shown in Figure 3(b). As illustrated schematically in Figure 3(c), the circulating flow enters a compartment, where the particles are separated and contained, prior to flowing back to the pump. The tank water surface is exposed to the atmospheric pressure, to maintain the suction head practically constant.
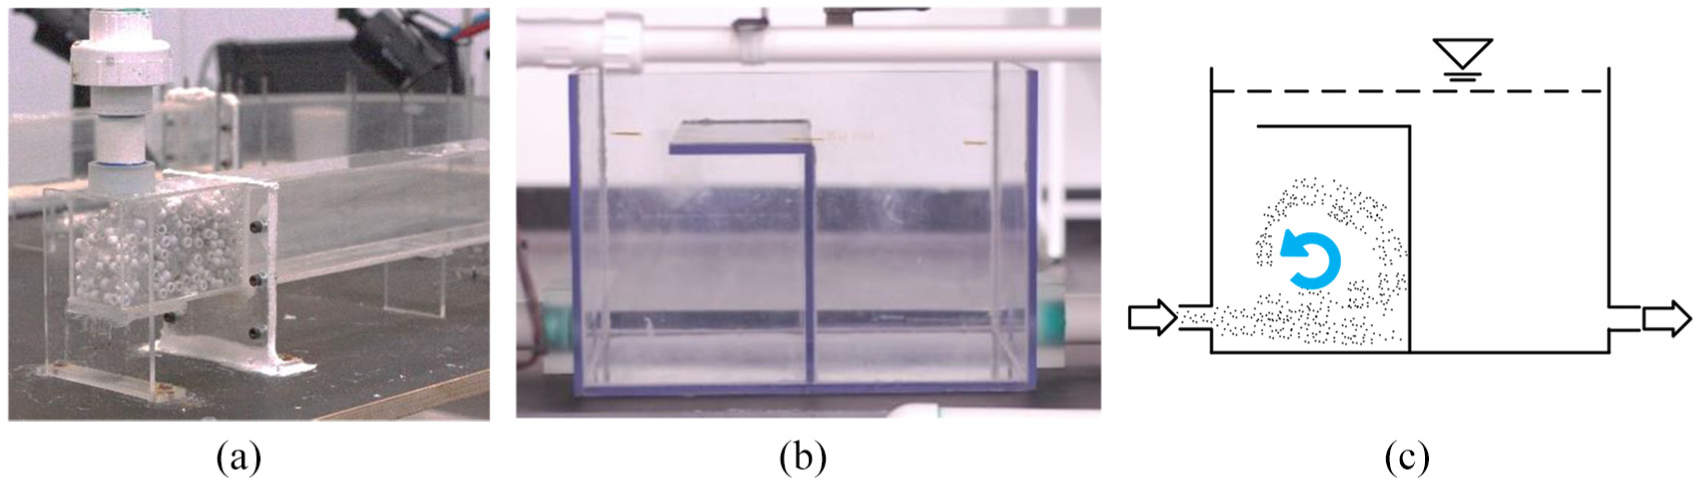
Swirl impediment chamber and settling chamber: (a) swirl impediment chamber, (b) settling tank and (c) separating arrangement in settling tank.
The water flow through the loop is maintained by the centrifugal pump (Lowara CEA210/2V), 4 which is controlled by an electrical variable speed drive (VSD). The control valve 7 is used for overall adjustment of the flow rate with the pump operating at a constant speed. However, at low flow rates, adjustments are made by a combination of the VSD and the control valve, preventing low fluid pressure in the circuit and the possibility of air leakage into the flow passage. For covering the intended flow range, two flow meters are used in the circuit. The flow is switched and directed between the two flow meters when necessary with the directional valve. 8 This facility also confirmed the measurement accuracy and the blockage-free assurance of flow operation. The rotameter (Omega FL-2081) 5 is deployed for the lower range of 4–36 L/min that corresponds to the laminar regime while the magnetic flow meter (Omega FMG-800/2″) 6 is used at higher range of flow rate at 25–1130 L/min. For preventing flow reversal, pipe branches to the flow meters are connected through an L-Port. 11
The entire test set-up is well sealed with appropriate adhesive and O-rings to prevent any leakages. However, provisions are made in the design for easy disassembly of the test section to arrange the sand bed after each test and for cleaning the duct walls, when necessary.
A traversing rake of four laser beams is used for illuminating and profiling the sand bed surface. Four position-adjustable video cameras (720p resolution) 12 are mounted around the curved test section to continuously monitor the sand bed surface behaviour and to capture the bed profile demarcated by the laser spots at selected locations. These camera views allow recording and cross-validation of bed profile data at pre-selected angles and positions along the curved duct under different conditions of water flow.
Non-intrusive measurements
For qualitative and quantitative profiling of the sand bed behaviour, the test set-up uses a non-intrusive approach of laser illumination, allowing bed height measurements over both the time (temporal) and the channel length (spatial). Most commercially available bed scanning techniques are rendered unusable and unreliable due to the scattering effects at the granular bed interface, giving rise to unacceptably high signal-to-noise levels in measurements. Similarly, regular light sources would not give sufficient clarity and precision due to some degree of particle suspension.
In the laser measurements, four equally spaced laser beams (Green/Class-II pointers) are mounted on an adjustable rake for illuminating the interrogating sand surface profile in the radial direction of the curved duct cross-section. The laser pointers are focused for spot size and optimal intensity for accurate determination of the height measurements. Due to the transient nature of the bed profile variation, multiple cameras are deployed for image processing and cross-verification of laser spot measurements. These multiple views also allow any compensation due to channel curvature. Traversing and rotating ability of the camera mounting provide the necessary flexibility to capture laser spot data at any test cross-section or channel-wise position. Figure 4 shows the scanning stages of the bed with this non-intrusive measurement approach using laser beams.
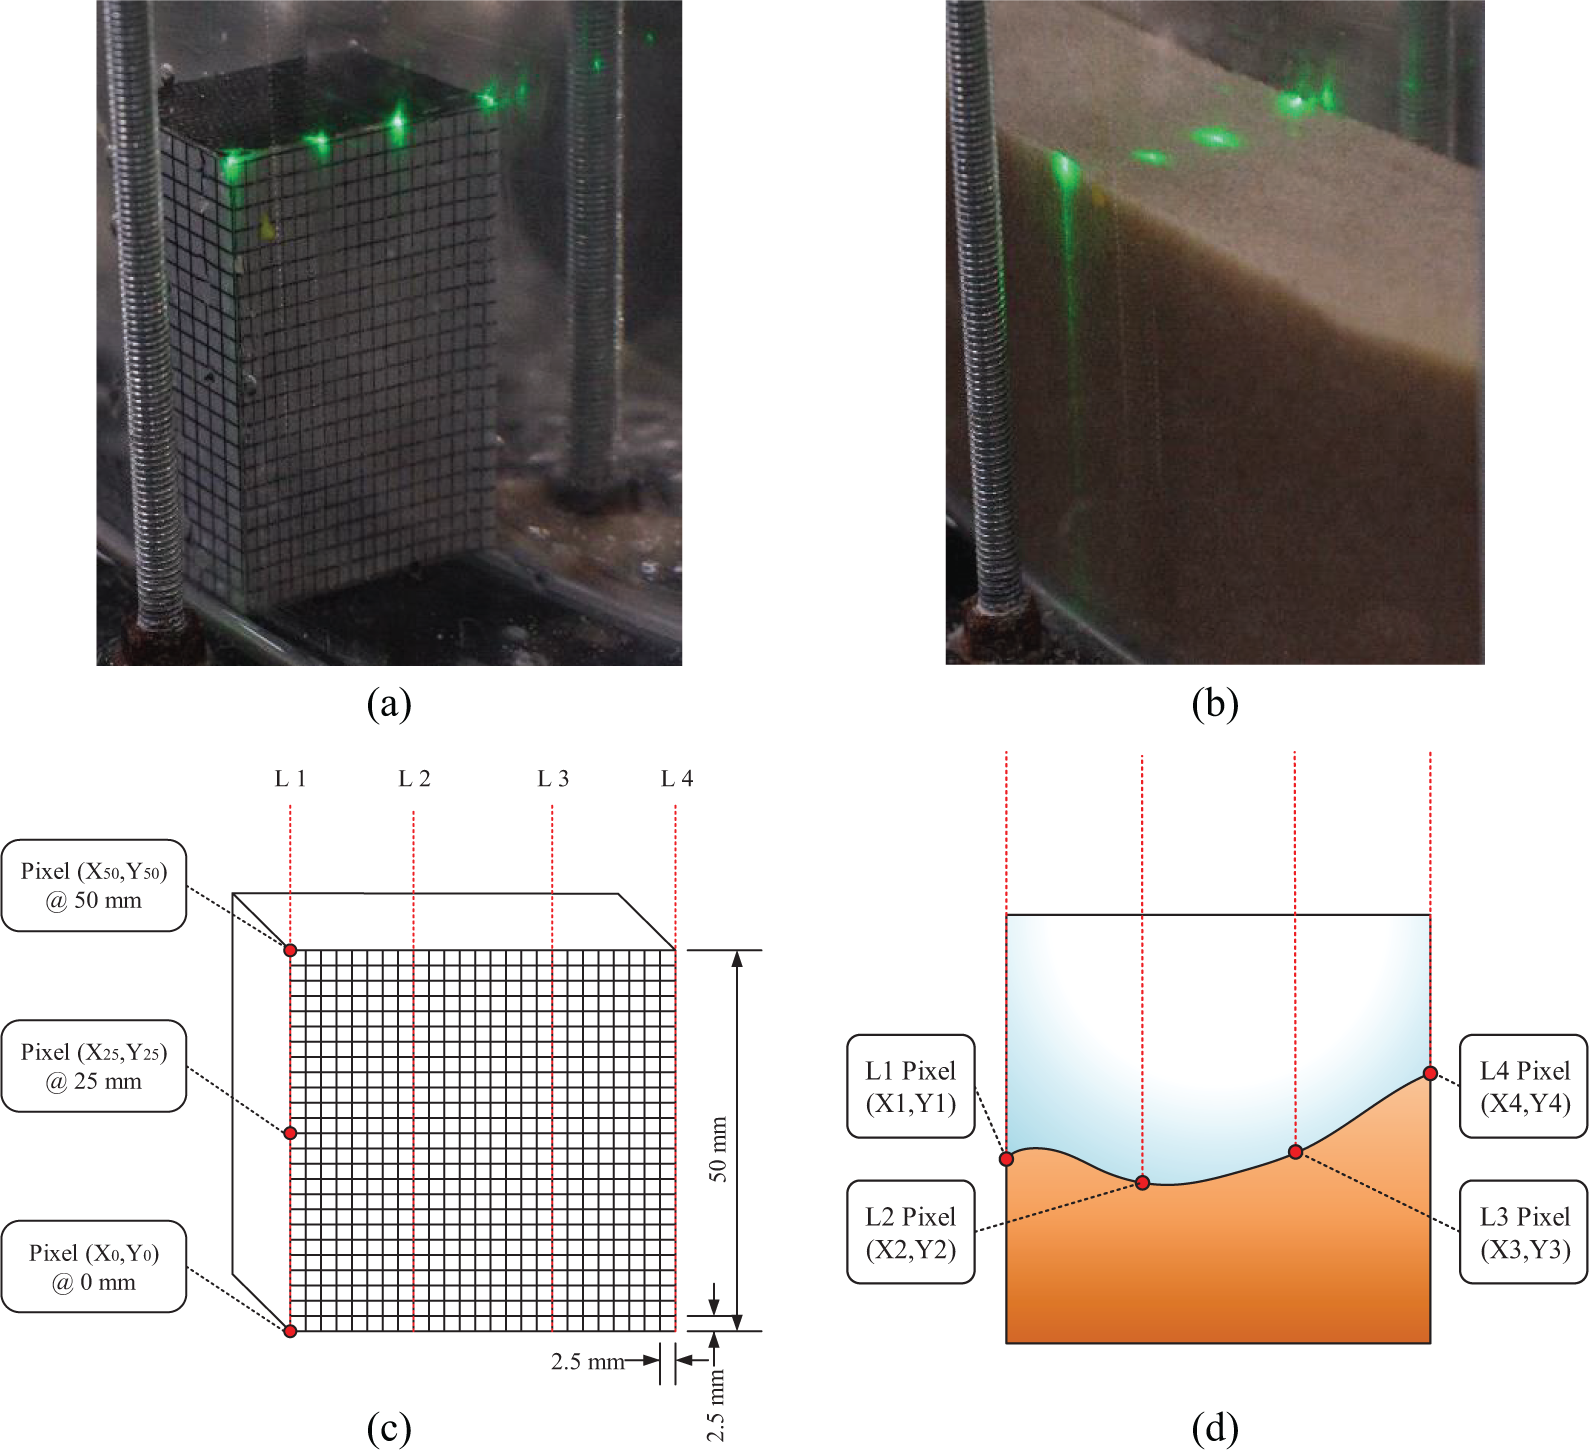
Workflow of laser bed scanning/measurement: (a) calibration of space, (b) illumination and capturing, (c) image processing and (d) reconstruction of the bed shape.
Calibration of space using a gauge block
The calibration is carried out to correlate the physical dimension to laser measurements. This is done by fixing and focussing the individual cameras to the targeted channel cross-section and placing a reference frame called gauge block within the curved duct, as illustrated in Figure 4(a). The gauge block consists of a known pattern of fixed dimensions perpendicular to the direction of interest, hence correlating pixels (digital image attribute) to physical heights (space attribute in millimetres). Since the laser beams are vertically aligned, there are no other projection components in the radial and axial direction. Therefore, with bed erosion/sedimentation, the projected laser points displace only in the vertical direction and provide accurate measurements. The calibration process also accommodates and compensates any image distortions arising from light refraction from wall curvature, the presence of water and possible camera lens distortion.
Illumination/capturing
Once the calibration is complete, the tests proceed to actual granular bed measurements with the water flow through the duct, as typically shown in Figure 4(b). The laser-illuminated spot data are continuously recorded by the four-camera system. Inevitable light scattering at the rough surface of the granular phase leads to some degree of measurement uncertainty, which is minimised by optimised focusing and brightness. This error is estimated by working out the ratio of lit point radius to the measured displacement.
Image processing
In the image processing, the data are obtained from the centroid of the identified lit laser points, and the pixel coordinate is correlated to the physical dimension using the calibration function previously obtained from the gauge block for each frame of the camera view, as indicated in Figure 4(c). In automating this process, a MATLAB script is written and built-in image processing algorithms are used that incorporates image reading, trimming, detection and conversion.
Reconstruction of the bed
From the image data processed, the bed interface profile is reconstructed with a lateral resolution of 15 mm (laser beam spacing) across the channel, as depicted in Figure 4(d). The use of camera views provides continuous tracking of dynamic bed reshaping, which is recognised as a clear advantage of this non-intrusive technique.
Results and discussion
The monitoring and processing elements of the explained approach are deployed for qualitative observation and quantitative measurements of the intricate erosion–sedimentation process over time. The quantitative measurement of bed height could be applied across the channel at a fixed radial location as the bed—flow interaction is progressing. This fixed single-frame measurement is an undeniably valuable measurement to provide the Eulerian description of the phenomenon and for temporal scaling of the process according to the key parameters such as flow rate and granular phase characteristics. Nevertheless, the full observation of the process over the time and throughout the test section reveals those measurements cannot solely be referred for the comprehensive projection of vortices and bed evolution during the term of the experiment. Therefore, the process is qualitatively explained based on general observation of process taking place across the channel as time progresses. This portrays an informed investigation plan for further measurements and quantitative analysis. The quantitative analysis is accordingly determined as spatial (interrogation at four radial locations across the channel at given times), temporal (interrogation at fixed 135° cross-section) and parametric (influence of flow rate and particle size) analyses. Adjustment of operating parameters and characteristics are attempted as accurately as possible within practical/experimental limits and are explained in greater detail in the related section.
Qualitative description of the process
Inner-wall dune formation: initiation stage
The initial mark produced by interactions between the fluid and the granular phases is seen as the formation of bed structures here referred to as inner-wall dunes, relating them to their location of inception. The mechanism by which they were formed, location and their motion along the channel could be correlated to a helix-like structure of flow in a curved duct. As depicted in Figure 6, the dune formation is initiated as the granular particles are picked up from the outer wall, where the secondary flow initially (i.e. with a flat bed) has higher intensity and carried out towards the inner wall. The decelerated flow accordingly hits the inner wall and momentum will be divided into axial and vertical components of flow. The vertical component of flow momentum, in the inner-wall dune vicinity, is insufficient to lift the granules and therefore, a gradual build-up of a dune occurs.
As dunes grow larger, the flow structure of fluid, shape and local intensity of the secondary/Dean eddies are influenced. This is seen as localised scour formed on top of the rising domain of inner-wall dune. These areas of scour extend in the direction of flow and towards the inner wall.
The first inner-wall dune scour (Figure 5, far left) is seen seeding another younger dune being formed downstream. The accumulation of grains displaced due to scouring, shown by the path of the dashed red arrows, accelerates the sedimentation process on the second dune’s crown. Scouring then continued around the newly formed inner-wall dune, enlarging it and assisting the formation of another downstream inner-wall dune. In addition, the scouring path pushes the crest of the inner-wall dunes along the duct wall, resulting in dunes migrating stream-wise. The area of interaction, for this stage, could be marked as the radial span from 80° to 180°, with the area towards the outer wall being left nearly untouched.

Propagation of inner-wall dunes due to scour.
Evolution of dunes: transition stage
Following the stage of formation, dunes are gradually expanded width-wise while being pushed stream-wise. This widening also provides a wider base of flow for scouring which results in the region of scour moving closer to the outer wall. The movement of scour to the outer wall marks a transition from the initial inner-wall sedimentation dominant stage to a new interactive behaviour of combined erosion/sedimentation across the entire width of the duct. This stage is seen to be where the most prominent interaction between the fluid and granular phase occurred, showing strong cyclic behaviour (i.e. the bed height is intermittently varying across the channel).
The captured cyclic behaviour originated as the combined effect of migrating dunes, and scour interacting with the outer wall. Over time, the magnitude of cyclic variation is gradually ceasing, and the interactive behaviour tends towards a less volatile stage of interaction. This is captured as bed height fluctuation across the channel, represented by four points. Although it is observed that the overall duration of transition stage and distance between the passing dunes are determined by macro-flow parameters such as flow rate, the initial bed height randomness and flow perturbation evidently affect frequency and magnitude of such temporal fluctuations.
Established erosion–sedimentation: quasi-stable stage
The third stage of interaction is defined as the situation where the bed shape (relative height of measured points) remains nearly intact while erosion continues to remove granular material and therefore, the absolute bed height is decreasing almost evenly across the channel. This stage is referred to as the quasi-stable erosion–sedimentation stage since the mutual interaction between the bed and vortice shape has converged to a certain configuration. The radial profile of the bed, commonly seen at this stage, has the lowest height towards the outer wall and growing as going inward. This could be associated with the local intensity of the secondary vortices which are expected to be higher at the outer wall.
Quantitative assessment
The first step in progressing from test observation to measurements is to measure bed variations across the channel and quantitatively interpret the values of height to the mentioned process. This test is referred to as spatial investigation since it could be described as a two-dimensional (i.e. radial profiles in various axial locations) evaluation of bed, at given time steps. The second set of tests investigates the granular bed behaviour at a fixed cross-section over the time. These tests are considered as temporal analysis and will be interpreted according to suggested qualitative evaluation. At the third, and last stage, the sensitivity of process will be examined against flow rate, and particle mean diameter as the key parameters of the investigated phenomena.
Spatial investigation: a Lagrangian overview across the channel
Figure 6 depicts the process of bed reshaping as a result of mutual interaction between the bed interface and spiral structure of the secondary flow. The monitoring positions and time steps, presented in the graph, are unevenly selected to best illustrate the formation and migration of dunes aligned with the earlier qualitative description.

Spatial evolution of bed profile at a flow rate of 50 L/min representing points 1–4 arranged from outer wall to inner wall.
The first row indicates the bed shape at the early stage of interaction (t = 130 s) when the cross-section close to the inlet (at 15°) is minimally changed, and the successive cross-sections are affected by a combination of the secondary erosion and upstream sedimentation. Among the following three monitoring positions, the second cross-section (at 60°) is the most eroded profile with the lowest bed height recorded at point 2 (mid-channel point close to the outer wall). Maintaining almost an identical profile shape, cross-section 3 (at 135°) and cross-section 4 (at 165°), shows an overall increase in their height which could be interpreted as the sedimentation of eroded materials upstream from its position. The noticeable observation in the second time step (t = 300 s) is the domination of the secondary flow erosion at the third and fourth cross-sections which are evident by recording the lowest bed height at point 1 (the closest point to the outer wall) for both profiles. Marching to the following time step (t = 490 s), the most remarkable footprint is observed at cross-section 3 where the bed experiences an overall increase in height and a local rise at the outer wall. Such a combination represents sedimentation of material eroded from upstream (causing overall bed inflation) and appearance of a migrating dune (responsible for the rise next to the outer wall). Following this migration process at the next time step (t = 690 s), the dune is not present in cross-section 3 and moved to cross-section 4 where it is indicated by a local rise at point 1. Another migrating dune is captured at cross-section 3 whereas the bed profile at cross-section 4 is back to outward inclining shape, representing the secondary-dominant erosion pattern. Unlike dynamic behaviour of the bed downstream of the channel, profiles at cross-sections 1 and 2 experienced minimal changes in areas where the secondary vortices have a lower intensity. Spatial investigation assists visualisation of dune formation, migration and bed erosion pattern dominant by the secondary flow. Nevertheless, the quasi-steady state cannot easily be explained through spatial results alone, as it has a different time threshold for each location. Hence, the final stage will be illustrated in the following section of temporal analysis.
Temporal investigation: the Eulerian overview at a fixed cross-section
Temporal analysis is carried out by fixing the measurement framework and capturing the bed profile at a fixed cross-section (at 135°) over the time. All the measured bed height values are normalised with the bed’s initial height which is set as 50 mm, consistently for all the tests. The temporal test is continued until the bed profile becomes asymptotic in shape with minimal changes over the time, representing the quasi-steady regime. The test duration will be ideally determined by the flow rate and bed characteristics; nevertheless, the presence of perturbation sources (e.g. initial imperfection of bed surface) could impose conditions requiring premature termination of a test. For instance, once the scour encounters the solid edge of the outlet’s straight section, a new mechanism of erosion emerges due to backflow and hence, the test needs to be terminated. This may be explained as the main reason for the difference between recording duration of various flow rate cases, represented the current section. Explaining such inconsistency, the demonstrated results are chosen from repeated tests to ensure all three stages are illustrated well.
The results presented herein are for the cross-section located at 135° along the curved duct at a flow rate of 46–64 L/min. The position of the cross-section of interest and the flow rate required for incipient grain movement (46 L/min) is determined by initial calibration and trial runs. The applied granular medium used comprises silica sand, with a specific density of 2.6 (in the solid form), and has been sieved to within a grain size of 300–475 µm. Also, laser points are numbered from the outer wall (Point 1) towards the inner wall (Point 4) of the curved duct.
The tests were interrupted once the granular material bed is eroded to the point where the duct base (of the straight outlet section) is exposed to the fluid flow. The reported temporal resolution was determined during post-processing and was determined by the length of the experiment, the rate and intensity of fluid–granular interactions, while raw images are captured at the maximum temporal resolution of 30 fps.
The minimum flow rate required to observe interactions between the fluid and the granular bed, with the given particle size, was determined through trials of flow variation. At a flow rate of 46 L/min, individual grains were observed being lifted from the granular bed and proceeded to roll along the surface; this occurred sporadically. The flow rate may be recognised as the inception of interaction between the carrier fluid, and granular bed, occurred gradually with slow sedimentation along the inner wall (Point 4). The inner-wall then undergoes periods of sedimentation and erosion due to the presence of migrating inner-wall dune (Stage 1) and this interaction expanding towards the outer-wall where erosion dominants. Figure 7 represents the track of four measurement points, fixed across the cross-section, over the term of test for each flow rate. Interactions between the carrier fluid and the granular bed at the outer wall demarcated the start of the transient period (Stage 2), incepted at t = 1900 s. The transient period at 46 L/min was characterised as a gradual progression of erosion, dominant interaction towards the outer wall (point 1). The transition stage occurred over a period of roughly 1100 s and accordingly, the bed profile is observed to be quasi-stable. Form this point onward, the quasi-stable period (Stage 3) continues with minimal variation in the granular bed profile.
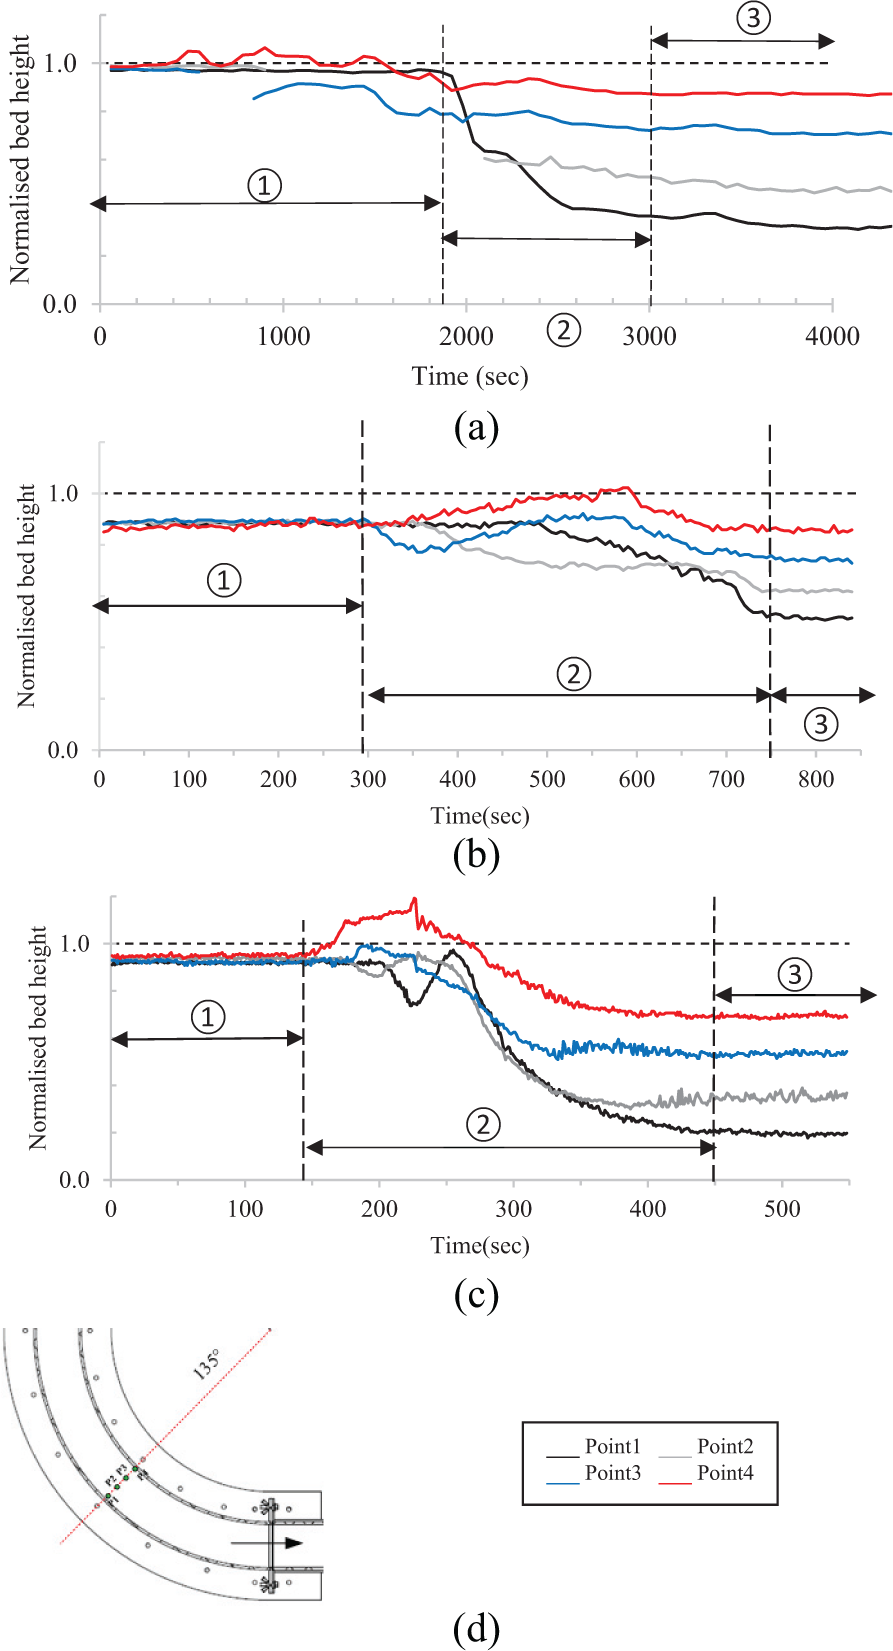
Temporal values of bed height across the channel at 135°/Dp =300–475 µm: (a) 46 ± 0.7 L/min, UncertaintyMax = ±2.6%, (b) 51 ± 0.7 L/min, UncertaintyMax = ±3.1% and (c) 56 ± 0.7 L/min, UncertaintyMax = ±2.7%.
Among other key parameters, flow rate and particle mean diameter are the primary representative of phases’ characteristics which theoretically are expected to play a pivotal role in phase interaction and the process of erosion–sedimentation. This study investigates the influence of these parameters in accordance with the above-mentioned interaction mechanism and also quantifies the effect on timescale. Temporal analysis is carried out for combinations of various flow rates and mean particle diameter of sand in the bed.
Flow rate
Figure 7 shows the temporal results, at the given cross-section, for three flow rates of 46, 51 and 56 L/min where all the sets undergo a similar evolution pattern. Stage 1, known as initiation stage, takes around 1900 s for the lowest flow rate of 46 L/min whereas the length of this stage reduces to just below 300 and 150 s, respectively, for 51 and 56 L/min. This means the time required for the inception of macroscopically visible interaction is inversely proportional to the flow rate. Similarly, an inverse correlation is observed between flow rate and transition time as the cross-section undergoes transition roughly over 1100, 450 and 300 s, respectively, for the lowest to the highest flow rates. Comparison of bed reshaping process, for various flow rates, supports the existence of consistent evolution of flow-bed configuration and also confirms the faster progress towards established (quasi-stable) erosion–sedimentation at the higher flow rates.
Particles dimensions
Particle dimension is another key attribute with importance to drag analysis of individual granule and also for the investigation of two-phase interaction. Therefore, any systematic sensitivity of bed reshaping process to particle dimension could be potentially associated with drag-related discussions in microscale. Temporal analysis has been carried out at a fixed cross-section (i.e. at 135°), for three different ranges of particle size, obtained through accurate sieving facility. The comparative interrogation is represented in Figure 8 while additional tests for various flow rates support the represented temporal behaviour. As indicated in Figure 8, the flow rate is maintained almost identical for all three cases, with a fluctuation band of ±3%. The first graph (Figure 8(a)) shows the evolution of the bed shape for the finest particle range of Dpm = 150–300 μm. The initiation stage takes around 50 s, and consequently, the bed experiences the longest transition time, among the cases, before it settles to the quasi-stable regime. This could be explained by the principle of lower drag force for smaller particles (of the same density) which enables quick inception of erosion (previously linked to the so-called rolling mechanism) of the bed profile at a given location and prolongs instability of the bed.

Temporal trend of bed deformation for various granular sizes at 135°: (a) 57 ± 0.4 L/min/Dpm = 150–300 µm, UncertaintyMax = ±2.8%; (b) 56 ± 0.7 L/min/Dpm = 300–475 µm, UncertaintyMax = ±3.2% and (c) 58 ± 0.6 L/min/Dpm = 400–1180 µm, UncertaintyMax = ±2.6%.
The next examined bed comprises particles with a size range of 300–475 µm, exposed to the flow rate of 56 ± 0.7 L/min. The initiation process is extended as the individual rolling process is slower for larger granules. The transition stage, in contrast, shrinks since the bed contains heavier granules which are less affected by smaller eddies, and hence, quasi-stable conditions are achieved faster.
The third bed with the coarsest size of granular material (400–1180 μm), however, exhibits a different behaviour demonstrating an initiation stage shorter than mid-range particle size. This trend, which was confirmed by the test replication, could be partially associated with a change in porosity of the bed as a secondary influence of particle size. Porosity, which theoretically increases by particle size, is hard to be accurately determined and commonly reported as an estimation. Another reason, which has been well discussed in the case of bed erosion in straight channels, is a faster transition to turbulent boundary layer for the courser particles and the dominance of particle rolling. The transition time, however, reduced further down for the highest range of particle size, supporting the dominant effect of larger eddies such as the secondary flow in this range. The smaller localised eddies perhaps do not have adequate magnitude to lift the larger particles, and hence are less prominent, for this range.
Figure 9 compares the processing time of each stage, as the quantitative measure of temporal behaviour, against various flow rates and granular particle size. The quantitative comparison indicates that the temporal behaviour of all the associated stages accelerates with the increased flow rate. In this, the particle size could have both enhancing and suppressing influence on the initiation process. Larger particle size implies a higher drag force (decelerating initiation), advanced turbulent boundary layer and higher porosity (accelerating initiation). It is noted that the transition process, however, is shortened for beds with larger particles since they are less sensitive to smaller eddies and perturbations.

Summary comparison of the bed temporal evolution with various particle sizes: (a) initiation time and (b) transition time.
Uncertainty considerations
Instrumental and reading uncertainties are minimised by selection of informed process design (previously briefed) and calibration instructions provided by the manufacturer. Nevertheless, the dynamic nature of the multi-phase field dictates the need to define and monitor the level of uncertainty.
The current case of internal flow has a bed with varying heights which in turn varies the hydraulic diameter. Therefore, the current dimensional convention (i.e. reporting the flow rate instead of the Reynolds number) is utilised to enable the users to non-dimensionalising the results as per their own needs and assumptions. The same difficulty arises for the analysis of image processing uncertainty. The location of the laser-projected points is indicated as the centre of laser blob projected on the bed. Since the height (i.e. y value) is defined in the vertical direction, uncertainty range is associated with half of the captured height (i.e.
Figure 10 demonstrates two sample uncertainty analyses for Points 1 and 4, at a given flow rate. The variable reference measure utilises the varying bed heights, at each point, to calculate relative uncertainty

Variable and fixed reference uncertainty tracks: (a) point 1 and (b) point 4.
Instrumental uncertainty associated with the flow rate readings can be trusted within an accuracy of ±1% (operation is maintained between 10% and 100% of flow limit) while (±3%) uncertainty is reported with the measurement of bed heights, based on fixed reference estimation.
Conclusion
Contributions of this study are summarised into three main categories, adding to the knowledge of experimental design, measurement techniques and describing the physical processes of the multi-phase flow phenomena. The proposed combination of the experimental design and instrumentation presents a unique test platform that ensures the following:
Stable and adjustable flow rate within a semi-closed loop for effective interaction between liquid and granular phase;
Fast and relatively accurate preparation of the granular bed, being set to the initial condition, allowing test repetition;
Effective separation of eroded material after the testing section to guarantee recirculation of a particle-free (single-phase) flow at the inlet.
The use of projected laser points is a non-intrusive, extendable and straightforward technique which is deployed for measurement of the bed height. This approach offers a practical image processing technique with an integrated calibration that warrants:
Quantitative readings with reasonable spatial and temporal resolution as well as some indications of accuracy;
Filtering of the visual distortion induced by the light fraction, channel and lens curvature using a gauge block and adopted cross-correlation.
The physics of the two-phase interaction between the water and granular phase is investigated and discussed using the verified measurements. Erosion–sedimentation regimes are discussed qualitatively, and the parametric influences are investigated. Quantitative results are also provided to support the hypothesis of the proposed regimes and identify their sensitivity against the pivotal bed characteristics. These verified measurements are original to the field and not only could be used for further physical investigation but also may be considered as a reliable benchmark for the validation of numerical models and specifically CFD closures.
The findings of the experimental investigation could be summarised as follows:
Initiation stage is indicated as the regime over which the macroscopic variation of the bed is insignificant while smaller eddies cause micro changes.
Following the initiation process, transition stage is indicated by the regimes of formation and movement of dunes resulting in periodic bed profiles at a given flow rate.
The bed essentially reaches a quasi-stable regime where the secondary flow vortices are the dominant erosive flow structure, and the bed interface maintains an outward leaning slope.
The temporal behaviour of all the associated stages accelerates with an increase of flow rate.
The particle size could have both enhancing and suppressing influence on the initiation process. Larger particle size imparts a higher drag force decelerating the initiation, while advanced turbulent boundary layer and higher porosity tend to accelerate initiation.
The transition process is shortened for beds with larger particle sizes since they are less sensitive to smaller eddies and perturbations.
Footnotes
Handling Editor: James Baldwin
Declaration of conflicting interests
The author(s) declared no potential conflicts of interest with respect to the research, authorship and/or publication of this article.
Funding
The author(s) disclosed receipt of the following financial support for the research, authorship and/or publication of this article: This study was funded by the Australian Government Research Training Program Scholarship.