
Abstract
In this study, we investigated the characteristics and the influence of the aero-acoustic noise generated from a pantograph using various experimental approaches in a wind tunnel. First, the noise generated at various flow velocities was measured and analyzed using a full-scale pantograph model. Then, the noise generated from the main position of the pantograph was derived using a microphone array attached to one side of a wind tunnel. The noise contributions of the main components of the pantograph were derived from the noise measurements obtained from a step-by-step disassembly of the full-scale model. In addition, the noise reduction achieved by panhead collectors, which are some of the most important noise sources on a pantograph, was examined by studying the results obtained when varying their geometry. In order to analyze the noise-reduction effect achieved by varying the height of the collector, different types of collectors were fabricated and wind tunnel tests were conducted. Through this study, we have investigated the aero-acoustic noise contribution of the major components of a pantograph, and we have developed effective noise-reduction measures for the panhead collector.
Introduction
The noise generated from high-speed trains is a major cause of discomfort and fatigue for passengers and bystanders. Aero-acoustic noise is particularly troublesome because it increases sharply when the train speed increases, as opposed to noises caused by rolling and traction. 1 The main sources of aero-acoustic noise in high-speed trains include the front of the train, the inter-coach spacing, and the pantograph.2,3 Of these sources, the pantograph is the only source projected outside of the train and in contact with high-voltage electric cables, which transmit electrical power to the train. In this sense, it is difficult to distinguish the characteristics of the noise generated in the pantograph from the noise emitted by each major element by attaching a noise sensor to the pantograph. As a result, studies had been carried out to derive the characteristics of the noise generated in the pantograph and the other major noise sources by various indirect methods. First, microphones far afield from the high-speed train have been utilized to measure and analyze the noise generated from a pantograph. However, because it is difficult to distinguish the influence of various noise sources using a single microphone, a microphone array is often used instead. 4 Sound field visualization methods that utilize a microphone array are a typical method used to derive noise sources on high-speed trains. 5 This method has the advantage of identifying the position of the main noise source on a train using signal processing, which is based on the noise generated when the vehicle is moving. 6 However, this method has limitations for determining the location of pantograph noise sources because of its low resolution in the low-frequency range. 7 In addition, because the analysis of the microphone array system is performed based on the beam power value, the array is limited in its ability to analyze the influence of the actual sound pressure of the pantograph. 8
In order to investigate the effect of noise from the pantographs of high-speed railway vehicles, studies using wind tunnel tests were widely used.9,10 In those studies, noise sources and characteristics generated from a small-scale pantograph model were identified through sound field visualization using a microphone array. Furthermore, in order to simulate turbulent flows, turbulent flow conditions around a current collector of an actual running train were also measured and an experimental method was developed which places obstacles upstream from the test section in a wind tunnel. 11 However, because the generation of aero-acoustic noise is closely related to the size and shape of the model, the simplified shape of the pantograph model limits the characterization of noise for pantographs with complex shapes. Therefore, we examined the characteristics of aero-acoustic noise generated in a pantograph using a model with the same size and shape as an actual pantograph.
Computational flow analysis was conducted to analyze the noise of the high-speed trains.12,13 Analyses of the pantograph noise through computational flow noise analysis is advantageous in that the mechanism of noise generation can be systematically identified through the analysis of various simulations. Numerical simulations of flow fields around pantographs of high-speed trains which run in the open air were conducted using detached eddy simulation (DES). 14 In this research, the far-field aerodynamic noise of pantographs was mainly contributed by the pantograph head in high-frequency bands. Moreover, a numerical simulation for the flow field and aerodynamic noises of pantographs on the symmetrical plane was conducted comparing the simulation results with the experimental result. 15 This research verified the correctness of the numerical simulation model and studied the impact of pantograph angles on radiation noises. Recently, a study was conducted to analyze the noise generated in the pantograph based on the lattice Boltzmann method. 16 However, the computational flow analysis of models with complex shapes such as pantographs require a lot of computational time for accurate noise analysis. Therefore, in general, analysis is often performed based on a simplified model, as there are limitations in analyzing the causes of noise generated according to detailed factors.
The purpose of this study is to identify the noise characteristics of an actual pantograph and to derive effective mitigation measures for noise by analyzing the contributions of each major component. First, the noise generated from a full-scale pantograph at various flow velocities was measured and analyzed in a wind tunnel test. In addition, noise source identification was conducted using a microphone array. In order to derive the noise contribution of the major components of the pantograph, the noise from step-by-step disassembly models was measured and analyzed. In addition, the effect of noise reduction on various shapes of a collector in a panhead was examined (the collector is one of the most important noise sources in a pantograph). In order to analyze noise-reduction effects influenced by the height and width of the collectors, various types were fabricated and tested in a wind tunnel. In order to analyze the influence of holes on a collector plate, noise measurement and analysis was performed using a collector plate with holes placed in various positions. Through this study, we have investigated the flow noise characteristics and the influence of major components on the noise, which is the basis of the flow noise–reduction study of the pantograph.
Noise source identification of the pantograph
Pantograph model
The most important function of a pantograph in a high-speed train is to supply electric power to the traction motors through contact with a high-voltage (20,000+ V) catenary. Pantographs consist of a combination of mechanical and electrical devices to receive effective power during operation. A pantograph can be divided into panhead, joint, and base sections, and each component is connected by rods, as shown in Figure 1. First, the panhead section is composed of a collector that contacts a catenary to receive power. Various components provide mechanical support for the contact between the collector and the catenary during operation. The mechanical support components consist of a control bar, guide horn, and suspension, and prevent high-voltage arcs from generating between the collector and the catenary. The joint section has devices that allow the pantograph to smoothly travel up and down in an oscillatory manner while the train is in motion. The base section also consists of devices that connect the pantograph to the body of the train. For example, insulators are used around the base section to protect the vehicle from high-voltage electric current, and covers are used to reduce air resistance. However, because the scope of this study was limited to examining the noise generated from the pantograph, the insulator and cover were excluded from the analysis. In addition, in Korea, the height of a catenary is located 1355 mm from the top of the train. The height of the pantograph was fixed with wires to maintain this 1355 mm distance from the top of the train. The pantograph model used in this study was the same size and composed of the same material as an actual pantograph; however, there was no connection device between the pantograph and the vehicle. Thus, the pantograph model used in this study was implemented in with the same geometry and conditions as an actual operating pantograph.

Detailed pantograph model.
Experiment equipment
The Korea Aerospace Research Institute wind tunnel was used in this study. Wind tunnel tests were carried out in a closed section in order to stably implement a high-speed flow environment. The cross-sectional area of the closed test section was 4 m × 3 m and the maximum flow rate was 120 m/s. The turbulence intensity inside the closed space was less than 0.13%, and the flow angle was less than 0.1° because a closed-section wind tunnel was used, and this made it challenging for acoustic measurements. In order to accurately measure the noise in a flowing environment, it is important to install the sensor in an effective manner. If the sensor is exposed to the airflow, the sensor itself can be a noise source. Therefore, we utilized noise measurement windows with Kevlar air-permeable cloth in the wind tunnel to prevent turbulent flow from the acoustic sensor. In addition, as shown in Figure 2, 95 microphones were placed on the measurement surface in order to generate a noise map for the pantograph. The microphones were arranged in a random configuration in the nine measurement windows. The microphones were 0.5 in. microphones manufactured by LinearX System Inc. The sensitivity of the microphones varies by less than 1 dB over the frequencies ranging between 50 to 10 kHz, and the maximum measurement range was 150 dB. The data acquisition system used GBM software, which can simultaneously measure multiple channels. The measured noise frequency range in this experiment is 20–32,000 Hz, and the frequency resolution is 16 Hz.

95 channel microphone array configuration.
After the measurement equipment was set up, the background noise was measured at each wind speed after driving the wind tunnel turbine, as shown in Figure 3. Moreover, the various speeds of the high-speed train were set to 150, 200, 250, and 300 km/h, so the wind speeds in the wind tunnel were set to speeds of 42, 56, 69, and 83 m/s. The flow noise was measured over a period 10 s to allow for flow stability because when the flow is stable, the noise is confirmed as constant. From the background noise measurement, it can be confirmed that the noise generation is linearly increased when the speed is increased. In addition, it can be seen that spectral levels of around 70 dB(A) occurred in the frequency range 150–700 Hz. There are some sharp peaks between 3 and 4 kHz at wind speed 69–83 m/s. The background noise in the high-frequency region due to the speed increase was the noise of the flow-generating machine. The signal-to-noise ratio was more than 10 dB for the frequencies above 100 Hz, and the range below 100 Hz was excluded from the analysis.

Background noise at various speeds.
Pantograph noise measurement
After investigating the background noise, the noise generated by the pantograph were measured at various speeds. The pantograph was positioned at the center of the wind tunnel, and the height of the panhead was fixed using a wire line, as shown in Figure 4. The centerline of the pantograph was located at a distance 2.0 m from the noise measurement plane. In addition, in order to investigate the noise generation of the pantograph in forward and backward operational conditions, the noise at each condition was also measured, as shown in Figure 5.

Pantograph noise measurement.

Forward and reversed pantograph modes.
The noise generated by the pantograph when traveling in the forward direction is shown in Figure 6. It was confirmed that the overall noise level was 99.3 dB(A). The highest spectral noise level was 82.1 dB(A), at a frequency of 672 Hz, and at a flow speed of 83 m/s. Spectral levels above 80 dB(A) were generated in the region of 384–752 Hz. It was also confirmed that the highest noise was generated at 496 Hz at a wind flow speed of 69 m/s. The results shown in Figure 7 provide the measurement results of the noise generated from the pantograph in the reverse direction under the same conditions. The overall noise level generated by the pantograph in the reverse direction was 98.1 dB(A). The highest spectral noise level, 82.3 dB(A), occurred at 688 Hz. In addition, it was confirmed that the spectral levels greater than 80 dB(A) were recorded in the region of 672–704 Hz. In addition, it was confirmed that the highest noise was generated at 400 Hz at a wind flow speed of 69 m/s. The high-frequency peaks were generated by the wire, and occurred at approximately 15 kHz, at a flow speed of 83 m/s. The pantograph was held in position by wires of 1 mm in diameter. Through this experiment, the noise levels and the frequency characteristics of the noise generated in the pantograph at various speeds were derived.

Pantograph noise generated in forward motion.

Pantograph noise generated in reverse motion.
The results of the computational flow analysis allowed for a better understanding of the mechanism of noise generation in the pantograph. According to a related study, 16 the flow in the panhead section had continuous vortex shedding. In addition, a high amount of noise was generated from the back of the panhead through the flow. On the joint section, noise that was radiated to both sides was larger than in the back and forth direction of flow. The base section also had noise radiated in both directions in the direction of the flow.
After analyzing the pantograph noise using a sensor located at the center of the microphone array, the results of the sound field visualization were derived using the beamforming method and multiple sensors. The resolution of the microphone array was affected by various factors, such as the measurement distance and sensor configuration.17,18 Moreover, the beamforming method had disadvantages of low resolution in the low-frequency region. 19 The speaker experiment measurement concluded that microphone array had a beam width of 0.2 m at a frequency range of 1000 Hz. 20 The beamforming method was used for sound field visualization in this study. In closed wind tunnel experiments, noise measurements are also affected by reflections from the ground. Therefore, it is important to minimize the impact of the reflections. However, in the case of pantographs that were measured in this study, there were various complex sources of noise, which made it challenging to identify them. The sound field visualization analysis domain was selected on the area of the panhead and joint section. The main noise sources of the pantograph in the forward direction were distributed in the panhead and the joint sections, as shown in Figure 8. The panhead results showed that a high noise level at the collector was generated at a frequency of 1600 Hz, and the main noise source of the joint section was the knee device that connects the upper and lower arms. The noise map of the pantograph in the reverse direction is shown in Figure 9. The main pantograph noise sources in the reverse direction were the panhead and knee devices. The noise map results were almost the same as those in the forward direction. However, because the visualization of the sound field in this experiment was performed in a closed wind tunnel, there was limited space to place the space array sensors for resolution improvement in the low-frequency range.

Pantograph noise maps for forward motion.
Pantograph noise maps for reverse motion.
Pantograph contribution analysis
In this section, an experiment was conducted to clarify the location of the pantograph noise sources using step-by-step disassembly. In this study, the effects of noise were evaluated through the dismantling of major parts of the pantograph, followed by a step-by-step examination of all these parts. This aids in the examination of the effects of noise reduction on the overall noise. The noise differences in the pantograph decomposition models were analyzed from the measurement. First, the panhead collector was disassembled. Second, the guide horn used to create contact with the catenary was removed. Then, the panhead section was removed by separating the control bar and the suspension. Finally, the upper arm was disassembled, and the entire pantograph step-by-step disassembly process is shown in Figure 10.
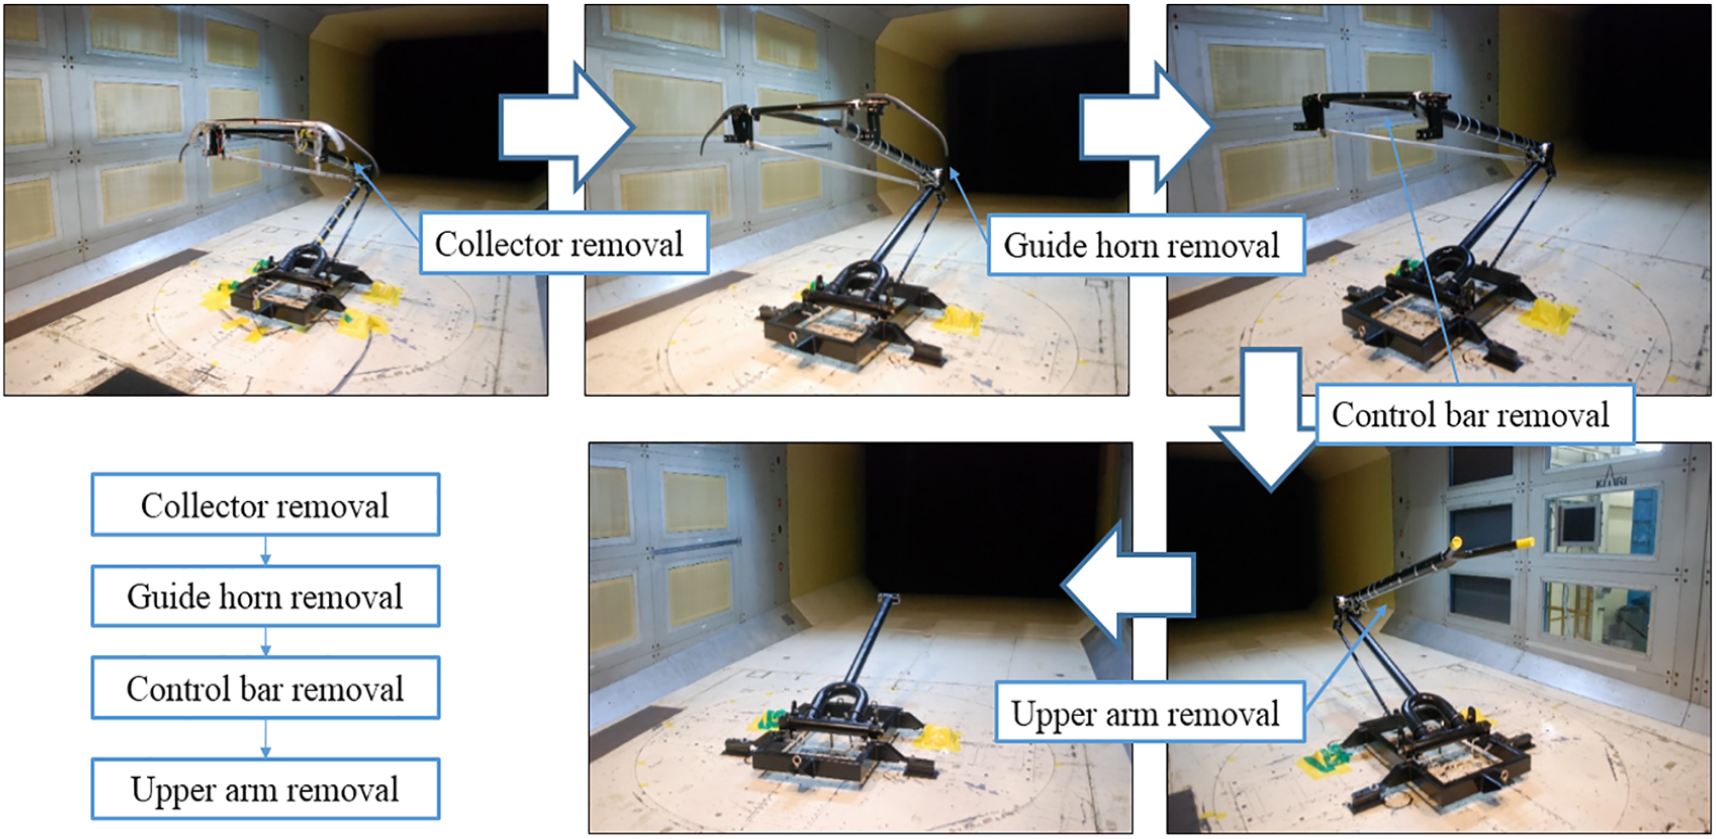
Pantograph step-by-step disassembly.
First, the noise generated from the entire pantograph in the overall frequency range was 99.3 dB(A) and, when the collector was removed, it was measured as 98.1 dB(A) in the same frequency range at a flow speed of 83 m/s as shown in Figure 11. The noise was reduced by 1.2 dB(A) by removing the collector from the pantograph. In particular, the noise reduction was achieved in the 672 Hz frequency range, which was the main noise frequency region. Therefore, the main noise frequency of the collector in the panhead section was in the 672 Hz frequency range. Moreover, it was confirmed that noise reduction could have occurred by reducing the collector noise at a frequency of 672 Hz. The contribution of the collector can be estimated by energy subtraction as 93.1 dB(A). Of course these estimates are unreliable when the difference between the two sound levels is small. When the guide horn was removed, the overall noise was measured to be 97.5 dB(A), and it was confirmed that there was no significant effect on noise reduction when the guide horn was removed from the model. In addition, after completely removing the control bar and the suspension, and after the panhead section was dissembled, an overall noise level of 95.5 dB(A) was measured, and the noise level was reduced by 3.8 dB(A) relative to the full pantograph, as shown in Table 1. The contribution of the panhead section can be estimated by energy subtraction as 97.0 dB(A). The noise from the model after removing the upper arm and the knee was 95.0 dB(A), and the noise reduction was 0.5 dB(A). Therefore, it was confirmed that the panhead contributed to the generation of pantograph noise more than the upper arm and the joint.

Comparison of noise from pantograph step-by-step disassembly at a wind speed of 83 m/s.
Noise in pantograph noise in decomposition models in forward motion (overall (difference) dB(A)).

Noise reduction of pantograph by collector modification
Noise reduction according to collector heights
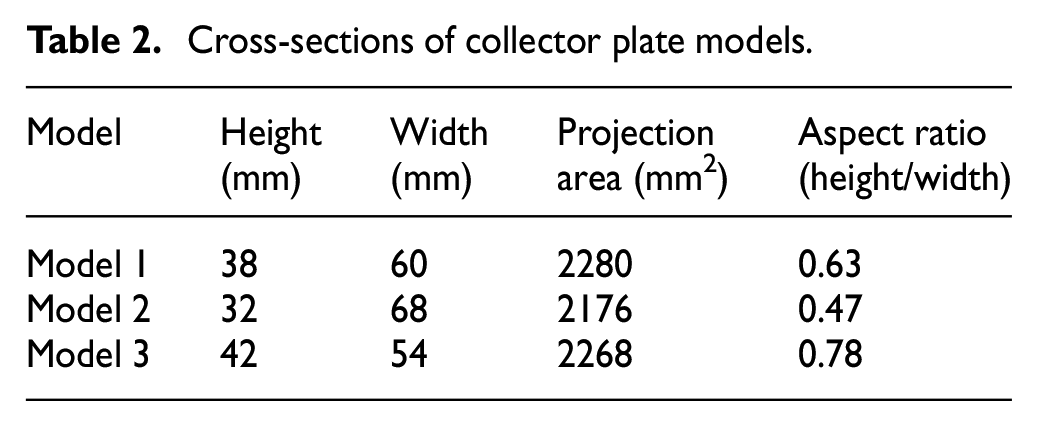
In this study, the effect of various collector heights on noise reduction was analyzed. The collector plate is in contact with the catenary to transmit power to the train. Moreover, a significant amount wear occurs due to the friction between the collector and the catenary during operation. Thus, it is necessary to increase the height of the collector in order to increase the replacement cycle period. Therefore, in this section, noise reduction was examined by measuring the noise from the model when collectors with various heights were installed. In this study, the differences in the levels of noise were masked by the noise from other parts of the pantograph. The various heights are shown in Table 2. The first model is a collecting plate model that was tested in front of the pantograph. It is 38 mm high and 60 mm wide as shown in Figure 12.
Cross-sections of collector plate models.

Width and height of panhead collector of pantograph.
The noise measurement results for the collectors with various heights at speeds of 42, 56, 69, and 83 m/s in the forward direction are shown in Table 3. As can be seen from the measurement results, the difference in noise generation is not significant when the collector changes from 32 to 42 mm in height. The noise measurement results for various collector heights were provided at various speeds in the reverse direction, as shown in Table 4. In the reverse direction, as in the forward direction, the varying heights of the collectors did not provide significant noise reduction. In particular, it was confirmed that the measured noise from the models were within the range of 1 dB(A) at the speeds of 42, 56, 69, and 83 m/s.
Pantograph noise of various collector models in forward motion (dB(A)).

Pantograph noise of various collector models in reverse motion (dB(A)).

Noise reduction caused by collector holes
In this section, we examined the effect of collector holes on noise reduction. The first model is a normal model without holes, as shown in Figure 13. The height of this model is 38 mm and the width is 60 mm. The second model was the same size as the first model, and had five holes of 7 mm diameter along the edges of the collector on each end. The third model is the same size as the first model and had a total of 28 holes.
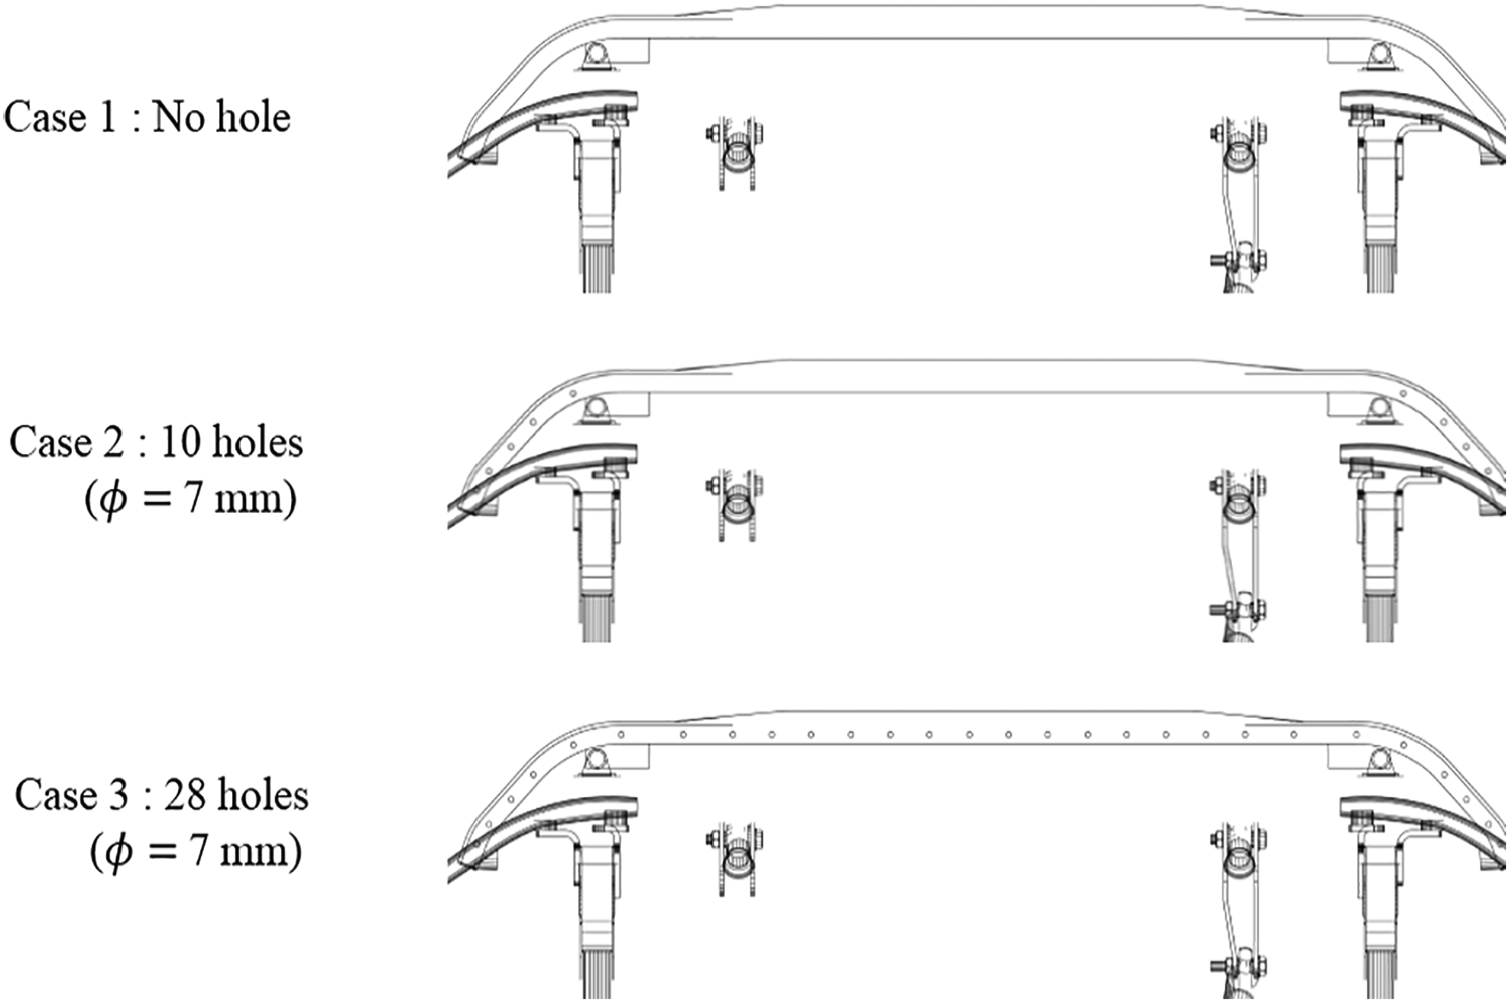
Case models with and without collector holes.
The influence of the holes on noise reduction in the forward direction is shown in Table 5. The noise-reduction results were also provided for the collectors with holes as compared to the model without holes. In order to examine the noise-reduction effects more closely, the difference in the generation of noise between the model without holes and the models with 10 holes and 28 holes was investigated. The figure presents that the holes were effective at achieving noise reduction. Noise level reductions of 0.1–0.4 dB(A) were achieved by the 10-hole collector, and values of 0.2–0.6 dB(A) were achieved by the 28-hole collector compared to the collector without holes. The noise-reduction effect of the collector holes in the reverse direction is shown in Table 6. In order to investigate the effect of collector holes on noise reduction in the reverse direction, the propagated noise differences between the holed collector plates and the normal model without holes were also examined. It was confirmed that a 0.3–0.5 dB(A) reduction was achieved by the 10-hole collector plate, and a 0.4–0.5 dB(A) reduction was achieved by the 28-hole collector plate. Therefore, it was confirmed that collector holes were effective at reducing noise in the forward and reverse directions. In addition, it was confirmed that the noise reduction was 1.2 dB(A) when the collector was completely removed. However, it is not possible to remove the collector during operation. In addition, the noise map analysis results related to noise reduction showed that there was no source of noise in the analyzed noise map because it had been removed in the process. In the case of reduction through the various holes, the noise reduction was not significant, and there was no particular difference from the existing results.
Pantograph noise of collector models with holes in forward motion (overall (difference) dB(A)).

Pantograph noise of collector models with holes in reverse motion ((overall (difference) dB(A)).

Conclusion
In this study, a wind tunnel experiment was conducted to analyze the characteristics of noise generated in a pantograph and its individual components. First, the characteristics of the noise generated in the pantograph were derived. In addition, a sound field visualization was performed using a 95-channel microphone array that was placed on one side of a wind tunnel. The results showed that there were no specific noise differences when the pantograph is orientated in the forward or reverse direction. Moreover, from the noise maps of the panhead and the joint section, it was confirmed that the collector in the panhead and the knee in the joint section were the main noise sources in each section. Moreover, the contribution of noise from the main pantograph components was examined by step-by-step disassembly of the pantograph. The results of the decomposition analysis showed that the highest noise reduction was obtained when the collector, the control bar, and the suspension in the panhead section were removed.
In addition, effective noise-reduction measures were examined by changing the height and the number holes in the collector. Regarding height changes, noise analysis was carried out for models with heights of 32, 38, and 42 mm. However, significant noise reduction was not observed from the measurement results. Conversely, the noise-reduction effects exhibited from the model with 10 holes of 7 mm diameter on both edges of the collector and the model with 28 7 mm diameter holes were examined. As a result, it was confirmed that noise-reduction effects were observed when holes were present in the collector. Therefore, this study has suggested a promising noise-reduction method for pantographs.
Footnotes
Handling Editor: James Baldwin
Declaration of conflicting interests
The author(s) declared no potential conflicts of interest with respect to the research, authorship, and/or publication of this article.
Funding
The author(s) disclosed receipt of the following financial support for the research, authorship, and/or publication of this article: This research was supported by a grant from R&D Program of the Korea Railroad Research Institute, Republic of Korea.