
Abstract
It is crucial for mobile robots to implement vanishing point detection during navigation in corridors. For the fisheye vision, the conventional methods of vanishing point detection usually obtain poor detection results. This is mainly attributed to serious barrel distortion in images acquired from fisheye cameras that are widely used in mobile robot systems. In the proposed system, a novel vanishing point detection algorithm based on the Gabor filter bank and the convolutional neural network is put forward to realize more accurate detection. The Gabor filter bank is used to extract image texture information in the preprocessing step, thereby enhancing the generalization. The convolutional neural network is used to predict the position of the vanishing point in the fisheye images. To improve the real-time performance and guarantee the accuracy, the low-resolution image should be selected as the input image as far as possible. For this purpose, a multi-resolution experiment was carried out. With the appropriate resolution, the proposed vanishing point detector was found still effective even if 60% of the original information was discarded. In addition, an experiment was conducted to verify the generalization on the condition of illumination changing, pedestrians passing, and different corridor appearance. The experiments displayed good effect and generalization on fisheye images captured in the corridor.
Introduction
Autonomous navigation in the corridor using monocular vision has aroused a wide range of attention in the field of mobile robots. There are many parallel lines in the structured indoor environment. In a projected image plane, those parallel lines may no longer parallel but converge to one point that is defined as the vanishing point (VP). Providing important cues for inferring the three-dimensional (3D) structure of a real scene, VP is widely applied in mobile robot navigation, 1 road detection2,3 and camera calibration, 4 and so on. As a result, it becomes common to take VP as the direction cues for mobile robots wandering in the corridor. 1
In VP detection, the mainstream methods are generally classified into two categories, edge-based methods and texture-based methods. The edge-based methods4,5 usually adopt the histogram technique on the basis of statistics. Specifically, Hough transform or Random Sample Consensus (RANSAC) 6 is used to detect lines in the projected image plane; then, the potential intersection of these lines is found mainly by voting methods and considered as VP. By contrast, texture-based methods7–9 have no need to detect lines but vote for the most possible VP by the convolution operation of texture filter and each pixel of image. For instance, a gLoG-based VP detection method was proposed by Kong et al., 9 in which a generalized laplacian of gaussian (gLoG)-based filter was used to estimate the texture orientation at each pixel, and then, the potential VP was voted by the dense texture orientation map. The texture-based methods are able to realize accurate detection of the VPs on both well-paved urban roads and rural unstructured off-roads. Nevertheless, high computational complexity and poor real-time performance lead to their failure to meet the needs of the autonomous mobile robots that require both vision navigation and scene recognition.
In addition to the above two categories, there is another type of VP detection methods, which are based on optimization algorithms. Typical examples include Dynamic Clustering Artificial Bee Colony (DCABC)-based algorithm 10 and Multiple Population Genetic Algorithm (MPGA)-based algorithm. 11 They first consider VP detection as a dynamic line clustering problem and then search for VP using some optimization algorithms such as Artificial Bee Colony algorithm and Genetic algorithm.
The wide view angle of fisheye cameras allows mobile robots to acquire more visual information during navigation. However, those fisheye images are usually accompanied by serious barrel distortion, as shown in Figure 1. In traditional methods, VP detection is considered a dynamic line clustering problem, which greatly reduces the detection effect for those images with serious barrel distortion. Taking the monocular camera as the navigation camera for a mobile robot, this article proposes a novel VP detection algorithm based on the supervised method, which requires only a sample set marked with the location of VP. A VP detector is trained off-line by the supervised method. The Gabor filter bank is used to extract the texture information of corridor in the off-line training phase. This helps the detector used in this study to gain good generalization ability in corridors with illumination changing, pedestrian passing, or appearance changing.

The mobile robot for experiments and distortion images captured by the fisheye camera.
In addition, psychological studies proved the unnecessary of high-resolution images for human intelligence in basic visual navigation. 12 The Andre et al. 13 also pointed out that it was still relatively easy for human beings to complete some visual navigation, despite loss in visual acuity and color vision. In other words, for some relatively simple navigation tasks, such as moving along a straight line, only little visual information is really useful. Therefore, to select the appropriate low resolution (to meet the real-time requirement while not reducing the accuracy), a multi-resolution experiment was performed. The experiment results demonstrated that the proposed VP detection algorithm was still effective even after 60% of the visual information was removed. This proved that the proposed algorithm was able to achieve a good accuracy and real time without using high-resolution image, freeing up much of the CPU for other computation-intensive tasks, such as landmark recognition.
The remainder of this article is organized as follows. The overall block diagram of the innovative VP detector is introduced in section “Overview of the system,” followed by the fundamental of the detector elaborated in section “The proposed method.” Experiments in section “Experiments” verify the performance of our proposed detector. The conclusion of this study is given in section “Conclusion.”
Overview of the system
The experimental images used in this article were captured by the front-facing camera of a self-designed mobile robot, as shown in Figure 1. A tracked mobile robot 14 is used for reconnaissance detection. Different from the traditional edge-based methods, texture-based methods, and optimization-based methods, our VP detection method takes the VP detection as a regression problem. For this purpose, a novel VP detector based on a convolutional neural network is proposed, which consists of two parts, the image texture information extraction and the merging of the predictions. To eliminate the influence of vertical lines on VP prediction, a multi-scale Gabor filter bank (five scales at seven directions, not including 90 degree) is used to filter the fisheye image. Based on the mean value of predictions at seven directions of each scale, the final VP is calculated by the mean value of prediction at five scales. Figure 2 presents the overall block diagram of the proposed VP detector in this article.

Overall block diagram of the proposed VP detector.
The proposed method
Multi-scale texture information extraction
The proposed VP detector is based on the supervised method, which makes it necessary to use the training sample set for off-line training. In this article, to eliminate the interference of vertical segments in the image and enhance generalization ability of the VP detector, a Gabor filter bank (five scales at seven directions, not including 90 degree) is employed to extract the texture feature information first. The impulse response of the Gabor filter is defined as a sine wave (two-dimensional (2D) Gabor filter is a sinusoidal plane wave) multiplied by the Gauss function. 15 The 2D Gabor filter is expressed as below

where
VP detector
Thanks to the advantage of the deep neural network (especially the convolutional neural network) in the image, the convolutional neural network is used as the VP detector, which traditionally consists of a convolution layer and pool layer. As pointed out by the paper, 16 the pool layer is capable of weakening the position of the image feature. That is, the pool layer is beneficial to the position-related classification problem, instead of the position-independent regression problem (such as the VP detection problem). Therefore, a simple convolutional neural network different from the traditional one (where the convolution layer and the pool layer appear alternately) is proposed. Its structure is shown in Figure 3.

The architecture of convolutional neural network without pool layers.
As shown in Figure 3, the first hidden layer, as an input layer, convolves three filters of 5 × 5 with stride 2 with the input image and applies a rectifier nonlinearity. The second hidden layer convolves six filters of 5 × 5 with stride 2, again followed by a rectifier nonlinearity. The third hidden layer is a full connection layer, with 200 neurons and applying ReLU function as the activation function. The output layer is a fully connected linear layer, with the activation function of sigmoid function. The number of neurons in the output layer is two, which is obtained through the ratio of the horizontal and vertical coordinates of the VP in the input image.
Merging of the multi-predictions
After well trained, the VP detector can be used to predict VP’s location in the fisheye image. First, the input image is converted to grayscale image and then filtered by the Gabor filter bank. At each scale, a frame of texture image is obtained by all directions of the texture image, which are summed and normalized. The formula is expressed as
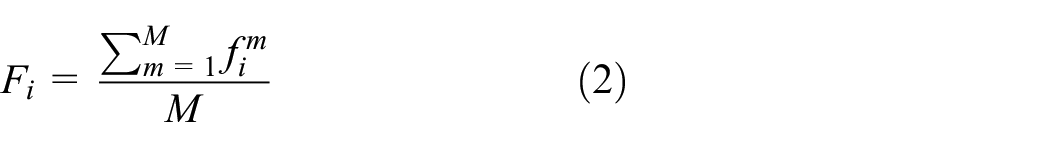
where M is set to 7, representing the number of filter directions, and
Through the five-scale Gabor filter bank, five-frame texture feature image is acquired after input image is filtered and five prediction results are obtained after the five-frame texture feature image is sent to the VP detector. The final VP location is represented by the mean value of the five prediction results, as shown in the following

where N = 5 means five scales,
Experiments
Sample set and Gabor filter results
In this study, to get the training sample set, the mobile robot was controlled to do S-shaped movement in the corridor, and a video (with serious barrel distortion) captured by the fisheye camera was recorded. A total of 1786 frames (100 × 100) were extracted from the video, and then, the location of VP was manually marked in each frame.
Overall 1/5 frames from 1786 frames (100 × 100) were randomly selected as the test sample set, and the remaining frames (in different parts of the same corridor, fluorescent lighting, no pedestrians passing, as shown in the first row of Figure 4(a)) were as the training sample set. Also, corresponding coordinates of the VP were considered the label of the training sample set. In addition, to test the generalization ability of the proposed VP detector, 130 frames with illumination changing, 130 frames with pedestrians passing by, and 130 frames captured in other corridor with pedestrians passing by were collected as well, as shown in Figure 4(b). Figure 4 clearly indicates that straight lines of corridor are regular when VP is located at the center of image but distorted when VP’s location deviates slightly from the center of image. This also explains why the conventional VP detection algorithms make poor performance when processing the images with barrel distortion.

Example images of the training sample set for the proposed VP detector.
The Gabor filter bank used in this article involves five scales and seven directions. The phase offset is not taken into account, that is,


where
After filtered by the Gabor filter bank, texture feature frames of five scales and seven directions were obtained as shown in Figure 5. Then, the texture feature frames of all directions at each scale were fed into the neural network for training and testing after normalization. In this article, the learning rate of 1 and the number of iterations of 10 were used.
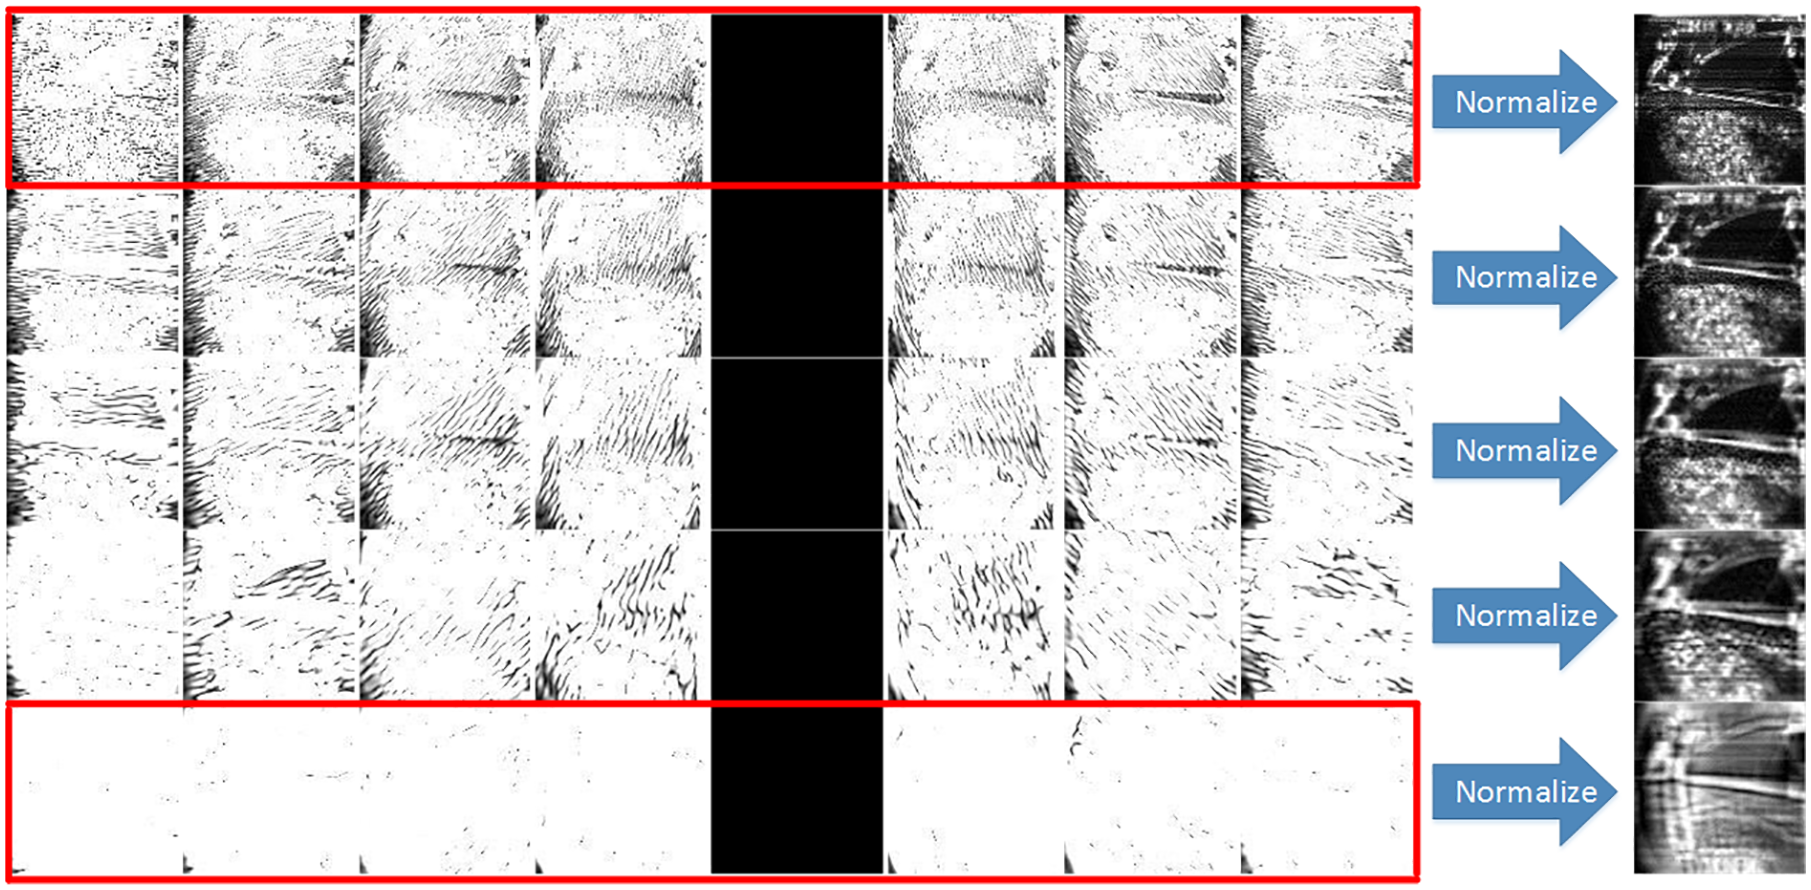
Filter results of Gabor filter bank.
Performance of our detector and contrast algorithm on the test set
Cross-validation is a resampling procedure used to evaluate machine learning models on a limited dataset. In K-fold cross-validation, the original dataset is randomly partitioned into K subsamples. Of the K subsamples, the K−1 subsamples are used as training data, for testing the model, the remaining part of the subsample is used as the validation data to compute a performance measure. The cross-validation process is then repeated K times (the folds), and then, the K results can be averaged as the final estimation. In this study, the K-fold cross-validation method was used to verify the proposed VP detector, where the K was 5. In other words, 1/5 frames were randomly selected from 1786 frames each time as a validation set, and the remaining samples were as training samples. The final result was represented by the mean value of the five prediction results. The selected test samples covered the starting, middle, and end position of the corridor.
In terms of a test image, the distance between the predicted VP location and ground-truth location was computed. The detected VP was defined as correct when the distance was smaller than a threshold. Thus, an accuracy rate on the test samples was obtained. By changing the threshold from 0% to 30% of the image width, an accuracy rate was obtained as shown in Figure 6. X axis represents the threshold, and Y axis refers to the accurate rate of the prediction. The Euclidean distance was used to measure the distance.

Prediction accuracy on multi-resolution. (a) The kernel size of the Gabor filter was 5. (b) The kernel size of the Gabor filter was 8. (c) The kernel size of the Gabor filter was 10.
A test was carried out to verify the performance difference of the proposed VP detector on different resolutions. Figure 6(a)–(c) shows the performance curves on the resolution of 10 × 10, 20 × 20, 30 × 30, 40 × 40, 50 × 50, 60 × 60, 70 × 70, and 100 × 100, respectively. Considering the impact from the kernel size of the Gabor filter on the final results, three kernel sizes (5, 8, and 10) were used, and the performance curve of which is shown in Figure 6(a)–(c), respectively. It was observed that the VP detector exhibited similar performance when the resolution was reduced from 100 × 100 to 20 × 20 but poor performance when the resolution was 10 × 10.
To intuitively compare the impacts of different kernel sizes and resolutions on the VP detector, a metric, degree of error

where
The

Degree of error on multi-resolution with three kernel sizes.
As shown in Figures 6 and 7, when the resolution was reduced from 100 × 100 to 40 × 40, the VP detector performed similarly regarding the accuracy, and the
To compare the performance difference of our detector and other algorithms, a contrast experiment was carried out on the fisheye test sample set. GS, 17 Expectation Maximization (EM), 18 interior and exterior region (IER), 5 and gLoG 9 were selected for comparison. The GS algorithm by Barnard 17 takes the Gaussian sphere as the accumulated space. Using the EM algorithm, Kosecka and Zhang 18 presents an efficient approach for detection of VPs from a single view assuming an uncalibrated camera in man-made environments. The IER algorithm by Li 5 realizes the VP detector using one-dimensional (1D) histogram to detect the three orthogonal vanishing point from the both interior region (IR) and exterior region (ER). The gLoG algorithm applies a new gLoG filter to estimate the texture orientation at each pixel of an image and the vanishing point can be detected based on the estimated texture. All the algorithms were based on the original resolution (100 × 100), and slight modification was made to the source code of EM and gLoG to adapt to this resolution.
Figure 8(a) provides the comparison results between the proposed VP detector (100 × 100, kernel size: 5) and other algorithms. GS outperformed EM, IER, and gLoG, but its accuracy was still less than 100% even if the threshold was relaxed to 30%. The EM, IER, and gLoG made relatively poor performance in the fisheye image test set with serious barrel distortion, and gLoG and EM achieved almost the same accuracy rate.

Prediction accuracy comparison between the proposed method and the state-of-the-art methods. (a) Results on the resolution of 100 × 100. (b) Results on the resolution of 60 × 60.
In order to verify the detection effect of using low-resolution fisheye images, another contrast experiment was carried out using the low resolution (60 × 60, kernel size: 5), with the results shown in Figure 8(b). The accuracy of the other algorithms was found significantly decreasing except the proposed detector. The IER algorithm seemed powerless to the low-resolution fisheye images, since its accuracy gained no improvement with the relaxing of threshold. As shown in Figure 8(a) and (b), it was concluded that GS, EM, IER, and gLoG indeed were not qualified to detecting the VP of low-resolution fisheye image.
The proposed VP detector was designed for the autonomous navigation of mobile robots in the corridor, making the real-time feature greatly significant. Therefore, a real-time contrast experiment was carried out involving the above-mentioned four algorithms. To reduce the test difference as far as possible, all the five algorithms were still based on the resolution of 60 × 60 and 100 × 100, respectively, and tested on the same Windows PC with an Intel Core i5 CPU (3.20 GHz) and 4-GB memory space. The codes of all algorithms were implemented in MATLAB. Figure 9(a) and (b) present the performance of these five algorithms under the small resolution (60 × 60) and the original resolution (100 × 100), respectively. For intuitive demonstration, the error bar graph of the contrast algorithms in these two cases was obtained, as shown in Figure 9(c). The processing time of all algorithms increased with the growing of resolution. In addition, under the original resolution (100 × 100), gLoG performed worst with an average frame rate of only 0.37 frames per second; the IER algorithm performed best with an average frame rate of 43.38 frames per second; the proposed algorithm achieved an average frame rate of 7.14 frames per second. Under the small resolution (60 × 60), the gLoG algorithm still performed worst with the frame rate of only 1.1 frames per second, and the IER algorithm performed best with a frame rate of 76.9 frames per second; the proposed VP detector achieved a average frame rate of 16.47 frames per second, basically meeting the real-time requirement.
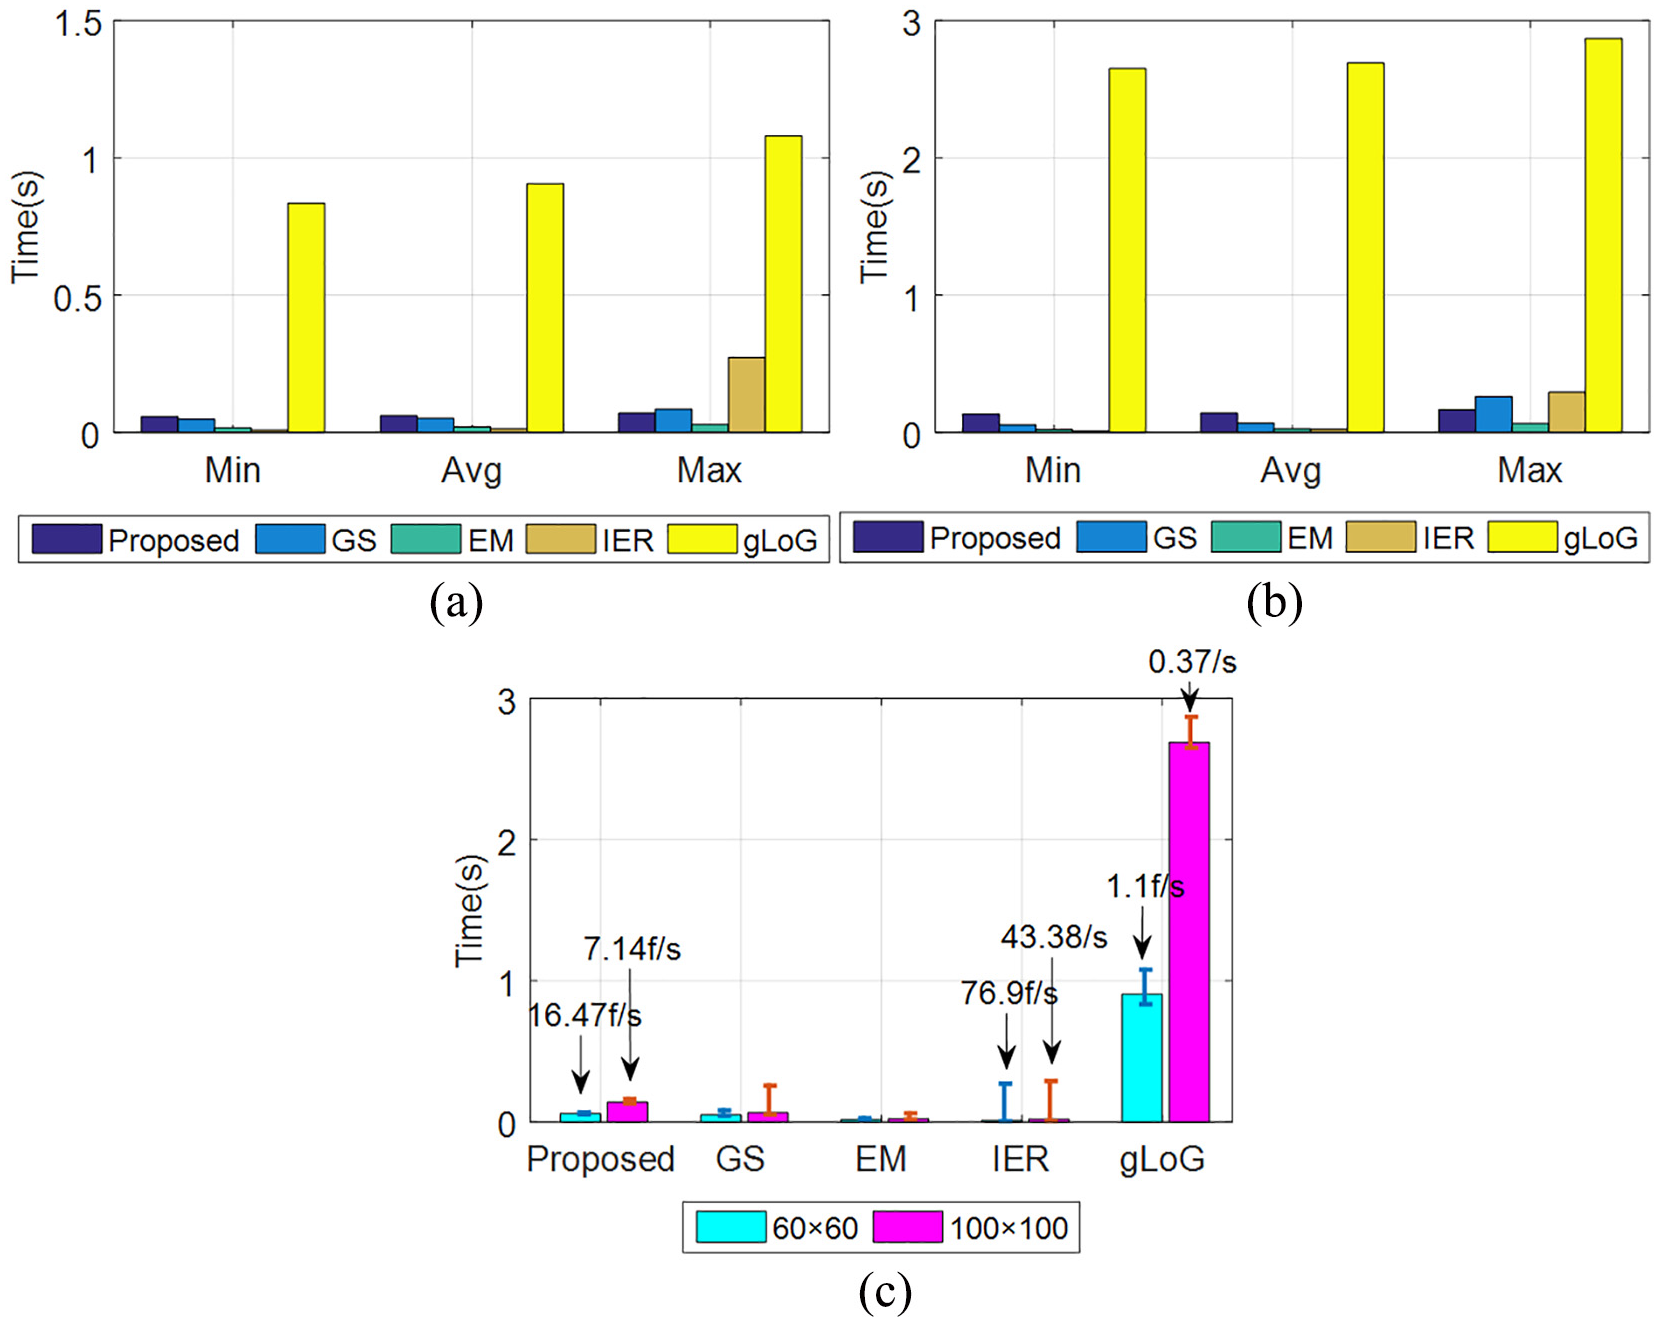
Computational time comparison between the proposed method and the state-of-the-art methods. (a) Results on the low resolution (60 × 60). (b) Results on the original resolution (100 × 100). (c) The error bar graph of the state-of-the-art methods on the low resolution and original resolution.
Generalization ability of the proposed VP detector
The ultimate goal of the proposed VP detector is to enable the mobile robot to autonomously navigate in the corridor with the fisheye camera. The generalization ability of the detector plays an important role. To verify the generalization ability of the VP detector, three test sample sets were collected, each of which was 130 frames (60 × 60). The first set was collected under dim lighting conditions (with a sudden illumination change caused by turning the light on); the second set was accompanied by pedestrian passing noise and the third set was collected in other corridors and accompanied by pedestrian passing noise.
Figure 10 shows the performance of the proposed VP detector on the three test sets. The red curve presents the prediction error of the VP detector on the first test set, which, as shown in segment A, suddenly increased to 10 pixels when the light was suddenly turned on. This may be because the camera in the light suddenly experienced a switch process from excessive exposure to normal. The green curve is the prediction error on the second test set, which, as shown in segment B, increased first and then decreased. This could be explained by a pedestrian approaching the camera and then leaving the camera (from near to far away). The blue curve provides the prediction error on the third test set, which, as presented in segment C, experienced an increase first and went down. Different from segment B, the segment C was caused by a pedestrian passing in front of the camera (from left to right, instead of from near to far away). The segment C obtained higher error than the segment B, which may be attributed to an occlusion process when the pedestrian crossed through the camera. The blue curve shows that the error was basically maintained at about 5 pixels when no pedestrian was passing. This was a little different from the other two test sets (illumination changing and pedestrian passing). This proved that the proposed VP detector remained effective under the conditions of illumination changing, pedestrian passing, and different corridor appearance. Thus, the VP detector exhibited good generalization ability.

Test results of generalization ability.
Conclusion
For monocular fisheye images, VP detection is regarded as a regression problem. A novel VP detection algorithm based on the convolutional neural network is proposed in this article. To select the appropriate low resolution (to meet the real-time requirement while not reducing the accuracy), a multi-resolution experiment was conducted. With the appropriate resolution, the proposed VP detector was found to remain effective even if 60% of the original information was discarded. To verify the generalization of the detector, another experiment was performed under the condition of illumination changing, pedestrians passing, and different corridor appearance. The proposed VP detector exhibited good effect and generalization ability on fisheye images captured in the corridor. In addition, a comparison real-time experiment was carried out, in which the average frame rate of the VP detector reached 16.47 frames per second. This basically met the real-time requirement.
Footnotes
Handling Editor: Eric Fujiwara
Declaration of conflicting interests
The author(s) declared no potential conflicts of interest with respect to the research, authorship, and/or publication of this article.
Funding
The author(s) disclosed receipt of the following financial support for the research, authorship, and/or publication of this article: This work was supported by the National Natural Science Foundation of China (No.61325018, No.61272379, No. 61903207).