
Abstract
This article proposes a design and experimental method of a new inner-rotation nozzle. First, the design model of the inner-rotation nozzle was established based on Abramovich’s maximum flow principle and high-pressure water jet crushing theory. Considering the specific conditions of the negative pressure duster, the reference values of nozzle structure parameters are calculated. The simulation is conducted for studying the relationship between the nozzle’s structure parameters and its performance including water flow velocity at nozzle outlet, atomization effects, and so on. By orthogonal experiment, the reasonable nozzle structure parameters were obtained by analyzing the speed of flow, the amount of air, and so on. Then, a series of nozzles were machined with different size shells and cores. In order to select out the optimum matching of nozzle cores and shells, an experimental system is established. Considering the installation location, wind speed, liquid–gas ratio, and other factors, the optimum matching of the shell core was chosen. At the same time, the application test of the negative pressure duster was carried out on the fully mechanized mining face. The research results show that the removal rate of pulverized coal has a higher improvement, and provides a theoretical basis for the design of negative pressure duster.
Keywords
Introduction
Coal mine dust is one of the five major disasters in coal mines. In recent years, coal mine dust control and prevention of pneumoconiosis have attracted people’s attention. 1 At present, there are several mine dust removal technologies, mainly, coal mine water injection, wet dedusting technology, chemical dust suppression, dust removal by duster, and foam dust removal. The wet dedusting technology is widely used because of the advantages of simple equipment structure, low cost, and convenient installation. The wet negative pressure duster mentioned in this article uses the high-pressure water jet to form negative pressure in the ejector cylinder, to suck the dusty air outside and combine it with high-pressure water jet in the ejector cylinder to achieve the function of dust removal. However, the nozzle is the core component of the negative pressure duster. Its performance directly affects the atomization effect of the water jet, the inhalation of dusty air, and the efficiency of dust removal. Therefore, the structural design of the nozzle and the study of its flow field characteristics are of crucial importance.
Due to the complicated structure of the nozzle, the harsh working environment and the high price, the research on the characteristics of the nozzle is mainly carried out by theoretical and experimental methods. The flow inside the nozzle is very complicated, it involves two or more phases. The problem of phase flow, coupled with the effect of the near wall on the liquid, and the generation of vacuoles and eddies, make it difficult to analyze it through a series of standard and precise formulas. At present, the spray performance and atomization performance of the nozzle are mainly studied by a series of experiments; then, a simple model and many semi-empirical formulas are used to simulate the numerical simulation and the experimental data obtained, and comparing the analysis to draw conclusions. Therefore, the study of the characteristics of the nozzle, especially the theoretical study of its atomization ability and the design of the new high-performance nozzle are still an important breakthrough point. Qi 2 , through analyzing the experimental data and field observation, believes that the dust removal principle of air atomizing nozzle is that the mixture of gas and liquid two-phase flow makes the water droplets atomize, and makes the water droplets have greater kinetic energy. The spraying water droplets are uniform and small in diameter, so that the diameter of the droplets is closer to the diameter of dust particles and the dust removal effect is better. In addition, water droplets have greater kinetic energy in the process of injection by means of aerodynamic force, which can better suppress and capture dust. Liu et al. 3 studied the influence of the number of spiral grooves, the shrinkage angle, the diameter of the cylindrical end of the central hole, and the aspect ratio on the jet effect of the new combined double jet nozzle. The numerical simulation analysis of different design parameters was carried out according to the actual working conditions on the site. It is of great significance to improve the rock breaking efficiency of the new combined dual jet nozzle. Based on the standard k–ε model adopted for the computation of turbulent flow in the liquid phase, Datta and Som 4 have studied the correlation between the geometric parameters of the nozzle and the air core diameter in a swirl spray pressure nozzle, which indicated a sharp increase in the air core diameter and spray cone angle with an increase in the nozzle flow rate, the orifice diameter, and the swirl chamber cone angle. Yang and Xiang 5 designed a nozzle that can be used for ultra-high-pressure water jet cleaning system to solve the difficulty in removing urban pavement marking line; the mechanism features circular cleaning trajectories of 12 nozzles with evenly distributed scattering from inside to outside, which can effectively clean all parts of marking lines at one time. In order to observe the influence of nozzle target distance, pressure, and cleaning speed of the cleaning mechanism, different thickness marks are used. The influence of nozzle target distance, system pressure, and cleaning speed on the cleaning effect of the marking line and the parameter combination of the best cleaning effect of the marking line with different thicknesses were obtained. Thompson 6 studied the flow of fluid inside the fan cone and hollow cone nozzle and the liquid film at the exit of the nozzle. The results show that the liquid film of viscous fluid increases with the increase of the inlet flow rate of the nozzle. Santangelo 7 studied the solid–liquid cone characteristics and droplet size of the high-pressure nozzle from the initial velocity of the liquid ejected from the nozzle, the atomization angle of the ejected liquid, and the flow velocity distribution in the nozzle, and plotted the flow distribution curve. By observation, it can be found that the curve has only one peak. When the pressure value is 60 bar, the half angle of the liquid cone is 33°. In order to improve the cutting ability of high-pressure water jet coal seam slitter, Lu 8 proposed a new idea of using double gradient nozzle to improve the cutting energy of high-pressure water jet coal seam. The prototype structure was optimized by numerical simulation, and the performance test was carried out using 3DPIV indoors. The results show that the average velocity of the jet exit flow field is the largest, and the velocity field distribution is ideal. The average speed at the 150-mm target distance is 1.4 times that of the ordinary nozzle. Tembely 9 deduced a nozzle model formula based on the general principle and maximum entropy principle. The droplet size of the nozzle was studied. The model utilized gamma distribution of multiple parameters and conservation of energy and mass, and was suitable for nozzle design in various environments.
According to the domestic and foreign literature works, there are many theoretical analyses on the nozzles. The traditional nozzle design is based on the principle of high-pressure atomization, which improves its effluent atomization ability by reducing the outlet diameter and increasing the outlet pressure, but it requires high water quality. In the process of underground application, even filtered water often leads to blockage or wear of nozzles, resulting in poor dust removal effect, shortened nozzle life, increased water consumption, and other problems to bring great trouble to the site. The nozzle is widely used and distributed in fully mechanized coal mining face, which is laborious and time-consuming to replace. It not only increases the worker’s burden, but also sometimes affects production, resulting in great indirect economic losses. Therefore, a kind of atomizing nozzle with good atomizing ability, long service time, and low water consumption is urgently needed. The inner-rotation nozzle is the core component of the water jet negative pressure duster and its performance directly affects the atomization effects of the water jet, the suction volume of dust-containing air flow, and the dust removal efficiency.
The application test of the negative pressure duster is carried out in the fully mechanized mining face. The article provided a novel design and experimental method of inner-rotation nozzle, main parts of which include shell and core. The rotation of the core in the nozzle can increase the turbulence degree of water flow, and transform the pressure energy of water jet into the velocity energy of fine water droplets, so that the water flow can be fully atomized. By applying Abramovich’s maximum flow principle and high-pressure water jet crushing theory, theoretical design formulas for calculating the structure parameters of the inner-rotation nozzle are derived. Thereby, the main structural parameters of the nozzle are calculated according to the specific conditions of the negative pressure duster. It is important to study the relationship between the nozzle’s structural parameters and its performance including water flow velocity at the nozzle outlet, the atomization effects, and so on. So, the physical model and the mathematical model of the velocity field are established; and numerical simulation is conducted by FLUENT and the distribution of gas–liquid two-phase flow inside and outside of the nozzle, pressure characteristics, and velocity characteristics of the nozzle were obtained. By orthogonal simulation experiment, several parameters including speed of flow and the amount of air were analyzed; and the reasonable nozzle structural parameters were also obtained. Referring to these parameters, a series of nozzles were machined, in which shells and cores have different structure parameters. In order to determine the optimum matching of nozzle core and shell, an experimental system for measuring wind speed of duster is established. Considering the installation position, wind speed, liquid–gas ratio, and other factors, the optimum matching of shell and core is selected. The atomization characteristics of nozzles in duster are important to dust removal efficiency, including the size, moving direction, velocity, and distribution of fog particles. So, an experimental system for measuring atomization characteristics parameters was established, which provides a basis for the exploration of the atomization principle of the nozzle and the optimization of its structure.
Design model of inner-rotation nozzle
Structure of inner-rotation nozzle and working principle
For the nozzle applied to the negative pressure duster, an inner-rotation nozzle is designed based on the performance of various nozzles combined with the requirements of the negative pressure duster on the jet velocity and atomization performance of the nozzle. The inner-rotation nozzle consists of the nozzle shell and core. Figure 1(a)–(c) describes the assembly drawing, the shell part drawing, and core part drawing, respectively. According to Figure 1(c), the outer surface of the core has spiral grooves with a through-hole in the center.

The structure of the inner-rotation nozzle: (a) the nozzle, (b) the outer shell, and (c) the core.
The inner-rotation nozzle is a nozzle containing a core inside, and the core is an important component of the inner-rotation nozzle. The core has a cylindrical shape, and an axial straight-through-hole is formed in the middle portion, and a spiral groove is formed on the outer surface, and both the ends have conical surfaces. When high-pressure water enters the nozzle from inlet, due to the specific structure of the central straight-through-hole and the outer spiral groove surface of the core, the water flow will be divided into several strands, one along the straight-through-hole, and the other, several water strands, will rotate along the spiral groove. Thus, the instability of the water flow is improved. The water flows, meet, and mix in the conical mixing zone at the outlet of the nozzle. At this time, due to the turbulence inside the water flow and the disturbance of the external gas, the water flow is broken and deformed due to the surface tension of the liquid, forming a conical water mist. This is the first atomization of the liquid. The ejector dust collector requires that the water mist at the nozzle outlet has a certain jet velocity and a certain atomization angle, so that the water mist can be propelled at a high speed in the ejector cylinder to form a “piston effect,” thereby forming a negative pressure at the inlet of the dust collector. Under the action of the negative pressure, the inlet of the ejector is sucked into the surrounding dusty air to form an ejector airflow in the ejector. Moreover, a complex vortex motion is also formed between the high-speed water mist at the nozzle outlet and the surrounding low-speed air to achieve a second atomization of the liquid. 10
The structural characteristics of the core are directly related to the atomization effect of the nozzle. Therefore, theoretical analysis and design of the nozzle are necessary. When the high-pressure water flows through the core, part of it advances along the through-hole. The principle is similar to that of the cylindrical jet nozzle, where the other part rotates along the spiral groove. Because the size of the spiral groove is relatively small, it can be approximated as the water flow point. The motion trajectory is the motion along the spiral groove. When the radial velocity of the water flow is neglected, only the circumferential velocity along the core of the cylinder and the axial velocity along the direction of the water flow are considered. At this time, the motion characteristics of the fluid inside the nozzle are similar to those of the fluid inside the centrifugal nozzle. In this situation, its motion characteristics similar to that of the centrifugal nozzle under the circumferential velocity along the core cylinder and the axial velocity along the flow direction were considered. Therefore, the inner-rotation nozzle can be regarded as the parallel nozzle of cylindrical jet nozzle (cy for short) and spiral groove centrifugal nozzle (sp for short). Then, Abramovich’s maximum flow principle and the jet principle are used, respectively, for following theoretical analysis, to obtain suitable nozzle parameters.
According to Abramovich’s maximum flow principle, 11 the relationship between spiral groove and through-hole in the inner-rotation nozzle was shown as

Q, Qsp, and Qcy refer to the total flow through the nozzle, the flow through the spiral groove, and the flow through the through-hole, respectively.
Thus, the two flow rates are related to the area relatively. For the convenience of design, the flow through the nozzle is divided into direct flow and rotary flow, as

To simplify the theoretical design, the following hypothesized as:
The fluid is incompressible inviscid flow.
According to Abramovich’s maximum flow principle, the flow has the axial and tangential velocities, but no radial velocity. Besides, there is no loss in the flow process, where the momentum obtained by the inlet remains constant and the symmetry of the flow is maintained.
The direct flow and rotary flow have no interference and overlap in the conical mixing zone at the nozzle outlet.
Design of nozzle based on Abramovich’s maximum flow principle
Due to the low viscosity of water, the nozzle can be designed based on Abramovich’s maximum flow principle. 12 Figure 2 shows the structural schematic of a spiral groove centrifugal nozzle.

The structural parameters of spiral groove centrifugal nozzle.
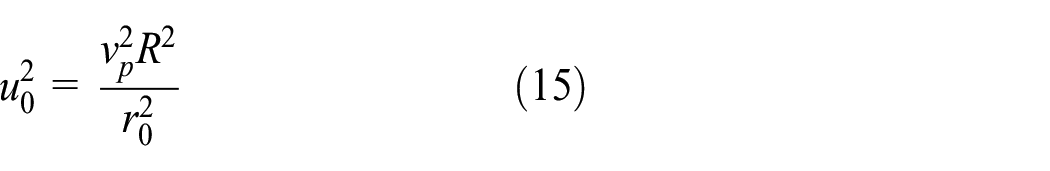
When the water runs into the nozzle, a rotational flow occurs in the spiral groove of the core. The angular momentum at any point of the fluid is conserved according to the angular momentum conservation formula as given below

where vp is the velocity of the fluid at the nozzle inlet, R is the radius of fluid inlet swirl, u is the tangential velocity of the fluid, r is the rotation radius of the fluid. Since, the radial velocity of the liquid is not considered, according to “the Bernoulli formula”

where P is static pressure (P = 0), ρ is the density of the liquid, v is the axial velocity of the fluid, u is the tangential velocity of the fluid, PL is the total pressure, which is approximately equal to the pressure of the liquid.
An air core is formed at the center of the liquid when the liquid is ejected at the outlet of the nozzle. Due to the existence of the air core, the liquid does not fill the outlet of the entire nozzle, that is, the actual flow area of the liquid flowing through the nozzle outlet becomes smaller. Assuming the radius of the nozzle outlet is r0, the radius of the air core is rc, as well as the liquid element having the width of dr and the length of
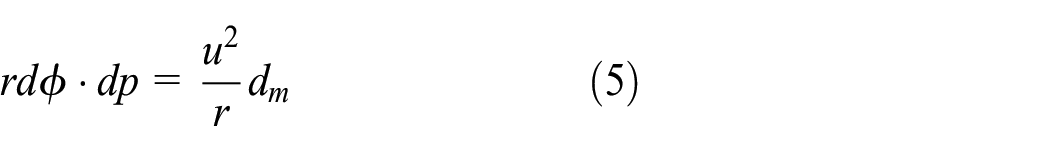
In formula (5) substituting

Formula (7) can be obtained from formula (3)

Substitute formula (7) into formula (6), then formula (8) can be obtained

Formula (8) was integrated as

Substituting r = rc, P = 0, the boundary condition can be obtained as

Then, the static pressure formula of the nozzle outlet, r =r0, can be obtained as

According to the flow formula when the liquid flows, the flow at the nozzle outlet and the inlet is equal

where
From the above, formulas (13) and (14) can be obtained


The tangential velocity formula of the fluid at the nozzle outlet r = r0 can be derived from formula (3)
Substituting formula (8) into formulas (11) and (15)


Substituting formulas (13), (16), and (17) into formula (4) and simplifying it, we get

In order to facilitate theoretical design of the nozzle, several parameters are introduced.
Geometric feature parameter A.
The geometric characteristic parameter A represents the relationship among the main structural parameters

Effective section coefficient
As mentioned above, the water flow does not fill the whole nozzle at the nozzle outlet for the air core. Suppose the area of the nozzle outlet is F, where the liquid is filled; the total cross-sectional area is F0; then,

Flow coefficient
Substituting formulas (19) and (20) into formula (18), the following can be obtained


According to Abramovich’s theory, when the liquid flow goes through the nozzle at a maximum,

Substituting formula (23) into formula (22)

And the relationship between the effective section coefficient and the injection angle can be derived as

In order to get the relationship between A, Cd, and α, their graphs are drawn as shown in Figure 3.

The relationship between flow coefficient, atomization cone angle, and geometric characteristic parameters.
From Figure 3, it can be seen that the flow coefficient decreases gradually and the atomization cone angle increases with the increase of geometric characteristic parameters. In summary, with the increase of swirl radius R, nozzle outlet radius r0, and the decrease of total cross-sectional area F0 of spiral groove, the effective cross section coefficient decreases with the increase of geometric characteristic parameter A, that is, the increase of air core rotating radius and the decrease of actual liquid outflow area. The swirl intensity and the atomization cone angle increases simultaneously; and with this increase, the velocity at the nozzle inlet and the tangential velocity at the nozzle outlet also increase.
In this design, the working pressure of the nozzle is PL = 12 MPa, the liquid supply amount is Q = 0.25 kg/s, the atomization angle of the nozzle required is α > 60°, and the density of water is
The nozzle geometric characteristic parameter.

Design of nozzle based on jet theory
In order to derive the relationship between the basic parameters of the jet and the geometry of the nozzle, a simplified model is established in Figure 4. Since the fluid has been assumed to be non-viscous and non-resistive to the near wall, the loss of speed is ignored. 13

Jet nozzle simplified model.
Using the Bernoulli formula at the inlet and at the outlet of the nozzle, respectively
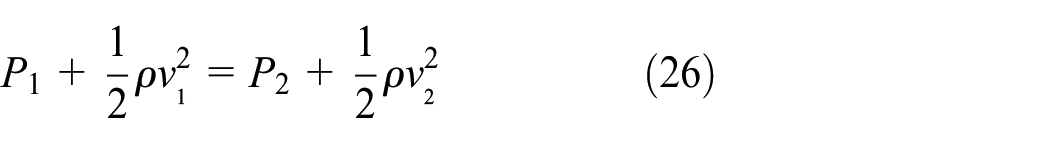
where

where
According to the flow formula, 14 the flow at the nozzle outlet and the nozzle inlet is equal during the flow of the liquid

where A1 is the nozzle inlet cross-sectional area, A2 is the cross-sectional area of the nozzle outlet, Q is flow of liquid

There is a shrinkage effect when the fluid passes through the outlet in the jet process, so the actual flow cross-sectional area of the outlet is smaller than the cross-sectional area of the outlet. Besides, an effective coefficient is introduced

The actual flow is
Set the straight-channels as round tubes, so

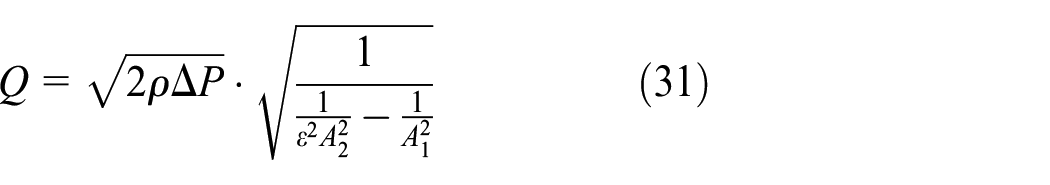
Introducing the flow coefficient

Substituting

According to the design of centrifugal nozzle and jet nozzle, the reference values of nozzle structure parameters are obtained. The outlet diameter is about 2 mm, the swirl diameter of spiral groove is 8 mm, the groove width is 2.176 mm, and the groove depth is 2.5 mm. However, the optimum mix size of nozzle needs to be verified by experiments. This article will get the optimum nozzle size in the orthogonal simulation test group.
Numerical simulation method
Model establishment
The numerical simulation method is to understand the characteristics of the internal flow field of the nozzle and its working condition. According to the theoretical reference value, the main parameters of the model are the spiral groove width ta 2.5 mm, and the core through-hole diameter d 1.2 mm, the outlet diameter D 1.5 mm. The analysis is carried out from four aspects: gas–liquid two-phase distribution, velocity characteristics, pressure characteristics, and air–water inlet mass flow rate. This article studies the incompressible and two-phase flow problems of the inner-circular nozzle, so we choose a pressure-based split solver, and the Pressure-Implicit with Splitting of Operators (PISO) algorithm for unsteady flow problems or a grid with a higher slope than the average grid, so the pressure–velocity coupling algorithm uses the PISO algorithm. 15
Turbulence model
In the multiphase flow model, the volume of fluid (VOF) model is selected.
16
In addition, the inner-rotation nozzle has a large strain rate, a large degree of streamline bending, and there are phenomena such as rotation and separation. Therefore, the renormalization group (RNG)
If the subscript 1 indicates the gas phase, 2 indicates the liquid phase (water), and

In the gas–liquid two-phase flow, due to the surface tension, the source term of the momentum conservation equation is generated. The continuous surface force (CSF) model with the expression

The transport equation for its turbulent kinetic energy and turbulent dissipation is as follows


where
In FLUENT, as the default value constant, C1ε = 1.44, C2ε = 1.92, C3ε = 0.09, the turbulent Prandtl numbers of the kinetic energy k and the dissipation rate ε are σk = 1.0 and σε = 1.3, respectively.
Discrete phase model
The discrete phase model (DPM) is based on Lagrangian. The single particle is used as the research object in the calculation process. FLUENT can use the DPM to calculate the particle motion and trajectory scattered in the flow field, and provide the Taylor analogy breakup (TAB) model and the wave breaking (WAVE) model—two droplet-breaking models. The Taylor analog crushing model is a classic model for calculating droplet breakage. The mechanism depends on the Taylor analogy between the spring mass system and the droplet deformation and oscillation. The oscillation and deformation of the droplet are equivalent to the spring mass system, the surface force is equivalent to the spring restoring force, the drag force of the droplet is equivalent to the spring system external force, and the droplet viscous force is equivalent to the damping force, in the Weber number. At lower times, the calculated results using the TAB model agree well with the experimental results. The damping oscillation equation is shown below

where F is the external force, K is the spring coefficient, d is the damping coefficient, x is also the amount of displacement from the equilibrium position.
According to Taylor, the coefficient relationship of the equation can be obtained as follows

where r is the invincible radius before undeformed, CF, Ck, and Cd are the dimensionless numbers.
Making

If the droplet is not damped, it is assumed that the relative velocity is constant and solvable
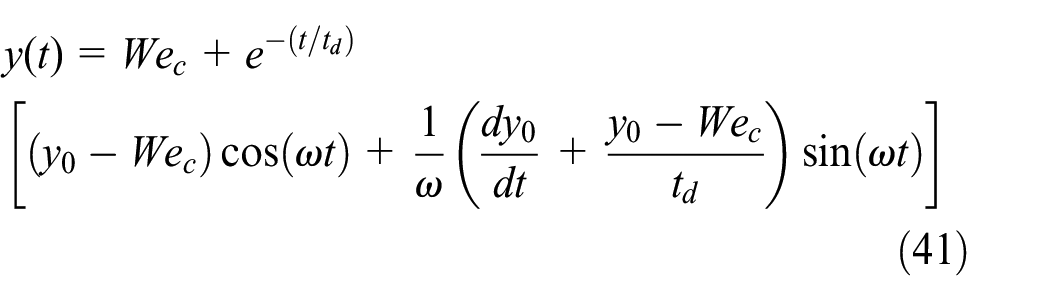
where
Movement velocity model of fog particles
The speed of dust movement in the wind cannot be very high. In order to effectively collide with the fog particles and increase the number of collisions, it is necessary to increase the speed of the fog particles. The sum of the number of collisions occurring in a unit of time for all fog particles and all dust particles within 1 cm 3 is equal to

where n1, the average amount of dust particles in the n-unit volume; n2, average amount of fog particles in a unit volume; ε, vortex motion intensity; v, water viscosity coefficient;


Laplacian can be expressed as
The N–S equation represents the mass force, surface force (pressure and viscous force), and inertial force phase equilibrium acting on a unit mass of fluid. The basic equations consisting of N–S equations and continuous equations can solve the velocity field and the pressure field in principle. It can be said that the motion analysis of viscous fluids is reduced to the study the N–S equation.
Control equation for dusty air. 17
The VOF model in this article uses the equation of the standard k–ε turbulence model, and its basic governing equation consists of the following equations.
Mass conservation equation
The flow problem must satisfy the law of conservation of mass, that is, the increase in mass in the fluid micro-element per unit time is equal to the net mass flowing into the micro-element at the same time. This leads to the continuity equation
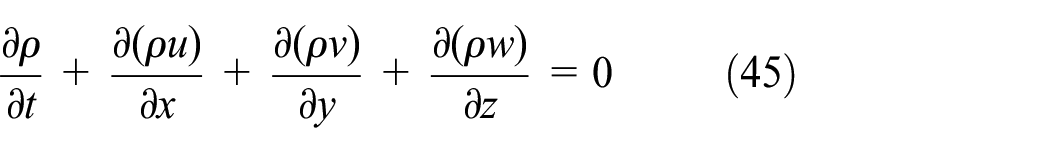
where ρ is the density, t is the time, and u, v, and w are the components of the velocity vector in the X, Y, and Z directions.
Momentum conservation equation
The law of conservation of momentum is also the basic law that any flow system must satisfy, that is, the rate of change of the momentum of a fluid in a micro-body to time is equal to the sum of the forces acting on the body of the micro-body. The momentum conservation equations in the three directions X, Y, and Z are
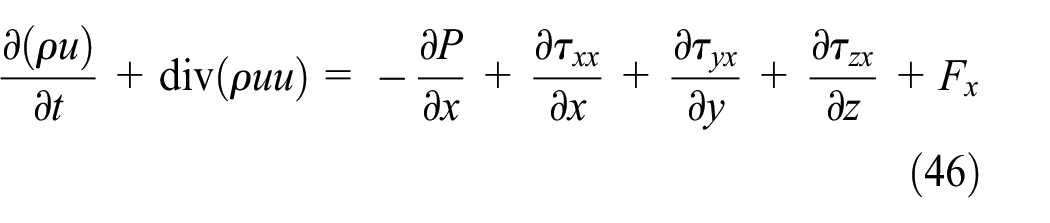
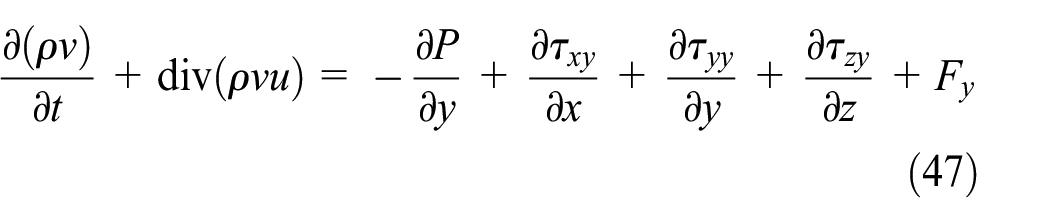

where P is the pressure on the fluid micro-body; τxx, τxy, τxz, and so on are the components of the viscous stress τ acting on the surface of the micro-body due to molecular viscosities; Fx, Fy, and Fz are micro-elements of physical strength.
Energy conservation equation
The law of conservation of energy is the basic law that must be met by a flow system containing heat exchange. The law can be expressed as the rate of increase of energy in the micro-element equal to the net heat flux into the micro-element plus the work done by the physical and facial forces on the micro-element

where k is the heat transfer coefficient of the fluid; cp is the specific heat capacity; ST is the internal heat source of the fluid, and the part of the fluid energy converted into heat due to the viscous action.
Fluid volume fraction equation
The gas–liquid interface simulation was performed using the fluid volume fraction equation (VOF). The fluids in the VOF model are not interspersed with each other, and the volume fraction sum of all phases is one in each control volume. The continuous equations and constraints for the volume fraction are as follows
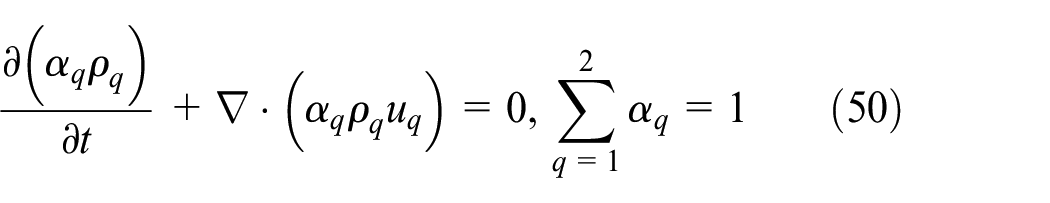
where ρ is the density of the fluid, u is the velocity of the fluid, and q is the phase of the fluid.
In the case of satisfying the above four basic equations, liquid atomization can be divided into two processes: primary atomization and secondary atomization. After the liquid enters the nozzle from the inlet of the nozzle, the liquid flowing into the nozzle is disturbed by the external gas and the internal turbulence due to the existence of the internal structure characteristics of the nozzle. At the same time, the liquid table surface tension also exists. Under these effects, the development of liquid becomes extremely unstable, which weakens the turbulence of the jet. The liquid continuous jet breaks down under various comprehensive factors and becomes a liquid line, a liquid ring or a larger droplet, thus realizing the initial atomization of the liquid. The velocity difference between liquid and surrounding medium gas is poor. When the velocity difference is very large, the atomization of the two atomization is caused. Compared with the atomized particle size, the droplet diameter of the initial atomization is larger, so the diameter of the droplet after the first atomization cannot meet the requirement, and two droplets are needed to obtain the droplet with smaller diameter.
Boundary condition setting
Boundary conditions of gas phase flow field
Water inlet boundary conditions: pressure inlet, the total inlet pressure is 8 MPa, the turbulent intensity is 4.2%, the hydraulic diameter is 0.01 m, and the set water flow phase is 1, indicating that the pressure inlet is 100% water ingress.
Gas inlet boundary conditions: pressure inlet, the total inlet pressure is 0 MPa, turbulence intensity is 3%, and hydraulic diameter is 0.1 m.
Exit boundary conditions: pressure outlet, the total outlet pressure is set to 0 MPa, that is, an atmospheric pressure, indicating that the fluid medium can enter and exit at will, and the water flow term in the reflux volume fraction is set to 0, that is, the volume fraction of water in the reflux is 0, water flow out from the exit.
The water phase is set to 0 at the time of initialization, indicating that the entire calculation domain is initially filled with air and the presence of no water flow.
Boundary conditions of discrete phase flow field
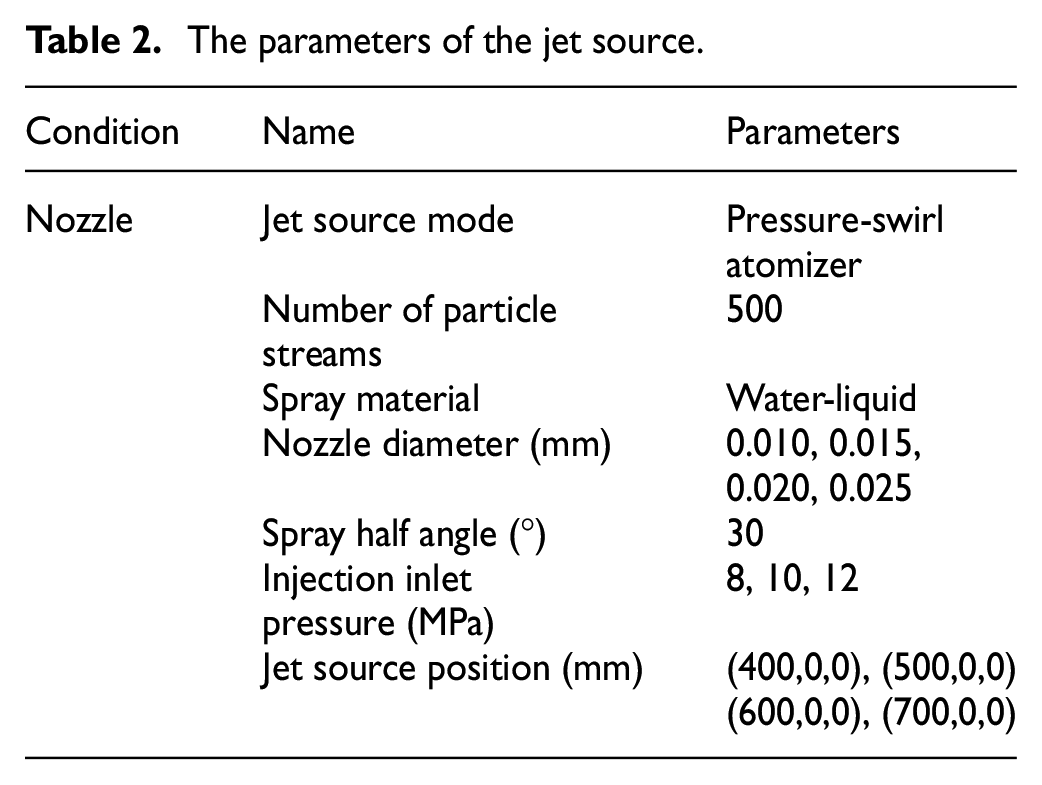
Open the DPM, suspend the breakup fracture model, establish the injection, and set the relevant parameters of the jet source, as shown in Table 2.
The parameters of the jet source.
The spray particle phase herein takes the escape boundary at the exit, that is, the particle moves to its original velocity and moves outside the calculation zone, and the other particle trajectory calculations terminate at the boundary.
Basic assumptions of simulation
Considering the actual flow situation and the purpose of simulation calculation, this article makes the following simplifying assumptions for the actual physical state:
The flow is water–air two-phase.
The flow to be unsteady flow that is not compressible.
Ignoring the heat transfer effect.
The external environment temperature is assumed to be 25°C, and the working pressure is one standard atmospheric pressure.
The geometry of the nozzle is small and the effect of gravity is negligible.
Grid independence analysis of numerical simulation
When a reasonable numerical simulation method is adopted for a specific problem, the accuracy of numerical simulation is also affected by factors such as mesh quality, mesh number, and time step. In order to reduce the error caused by grid in numerical simulation, the independence of grid must be checked to eliminate the influence of grid on simulation results. Aiming at the problems mentioned above, the reliability verification method of numerical simulation based on grid independence is explored with the nozzle as the object.
The model is partitioned using tetrahedral unstructured mesh, and part of the nozzle area is densified by dense combination. In order to fully demonstrate the reliability of numerical simulation results and the scientificity of mesh generation, the outlet pressure p, velocity V, and dust removal efficiency of nozzles were used as evaluation parameters of numerical simulation results, and the mesh was densified by checking the irrelevance of A/320,310, B/436,750, C/549,227, D/649,227, and E/721,730. The relative change rate before and after the evaluation is taken as a reference, and then the problem of grid independence is analyzed and evaluated in Figure 5. It can be seen from the graph that the results are close when the number of grids are 649,227 and 721,730. That is to say, when the number of grids reaches 649,227, if the grids are refined further, the simulation results are not very different, and take up a large amount of storage resources and simulation time, so the simulation efficiency can be improved. In this article, the grid number is 649,227.

Analysis of mesh independence.
Finally, the quality of the whole grid is optimized to meet the quality standards. The basic information of the grid is as follows:
The axial direction of the nozzle is Z-axis, that is, the direction of flow is also the positive direction of Z-axis.
The spiral groove, nozzle outlet, and inner straight passage are partially encrypted in axial direction.
Because the liquid is rotated out from the nozzle outlet close to the wall, the radial unit of the nozzle outlet near the wall is encrypted.
After meshing, the number of meshes is 649,227; the number of mesh nodes is 148,431; and the quality is up to the standard.
Simulation experiment results and discussion
Gas–liquid two-phase analysis
Since the liquid rotated along the spiral groove of the nozzle, for the convenience of observation, the X = 0 section is selected for observation analysis. Pipeline water filling is the process by which the liquid volume fraction changes over time. Figure 6 shows the flow of liquid in the air at different time intervals and the gas–liquid two-phase distribution of X = 0 cross section. Blue part represents the water phase and red part represents the gas phase.

Gas–liquid two-phase distribution at different times.
At t = 0.6 ms, the tube is filled with gas, and water flows in parallel from the pipe, and a gas–liquid two-phase flow occurs in the pipe. It can be clearly observed that it is divided into three streams of water after the high-pressure liquid enters the nozzle from the inlet, two of them are rotated along the spiral groove and the other is advanced along the center through-hole.
At t = 1.7 ms, the water flow from the through-hole first reaches the cone mixing chamber and form a jet phenomenon. The liquid volume fraction increases continuously and increases linearly.
At t = 0.91 s, the rotation water flow also reaches the cone mixing chamber in the front section of the nozzle outlet with time increases, and several streams of water are mixed with each other. Due to the addition of the rotation water flow, the water flow in the mixing chamber is changed from a direct jet to a swirling mist stream with a tangential velocity and finally ejected from the nozzle outlet.
At t = 3.8 s, there is no larger water column or water block in the whole mixing chamber, which is because the rotation flow in the spiral groove gets into the mixing chamber and continues to move forward without the action of the inner wall of the spiral groove. Then, the part of the water flow compresses the air in the mixing chamber due to the great speed difference between the air, which produces friction, tearing the water stream, colliding with the inner wall of the mixing chamber, causing the water flow to rupture, forming small liquid micelles that diffuse around, and reach the central portion of the mixing chamber. Mixed with the original jet, collision, the two streams of water undergo complex energy and momentum exchange, resulting in further atomization of the water stream. Therefore, in the mixing chamber, the water flow has reached a good atomization quality, with the formation of a high-speed cone-shaped mist flow.
In order to analyze the change process of gas–liquid two-phase, the analysis is carried out at t = 0.91 s, and there is no intervention of rotation water flow during this time, with the jet phenomenon fully developed. The simulation results are shown in Figure 7. According to the theory of jet breaking, the liquid phase of the jet is divided into four sections which includes tight section, core section, rupture section, and water droplet section. The statements of these four sections will be analyzed as follows.

Basic structure of the jet.
First, the tight section is close to the outlet of the through-hole. After the jet leaving the through-hole for a certain distance, the initial injection speed keeps the same, so that it is in a tight state, in which the gas can be pushed forward in the cone mixing chamber. Also, there is a great speed difference due to the boundary surface formed between it and the air, which produces a force perpendicular to the direction of the jet axis. Under the action of the force and the internal turbulence of the liquid, the exchange of mass and momentum occurs, thereby generating ripples on the outer surface of the jet.
Second, the core section is the continuing development part of the tight section. Although, it is still in a tight state and maintains the original jetting speed, with the continuous increase of the corrugation, the liquid column is continuously broken and the diameter of the tight section is continuously reduced.
Third and final, the rupture section and the water droplet section, respectively, are the basic segments in which the jet is broken into droplets. Due to the aerodynamic force, inertial force, surface tension, and the extreme speed difference, the liquid column is broken and formed a large water block, then the distance from the nozzle outlet increases. The water mass gradually decreases, eventually turning into water droplets, forming a mixture or atomization of water droplets and air.
The flow trace after the water flow enters from the nozzle inlet is shown in Figure 8. The rotation phenomenon of the water flow in the spiral groove and the direct phenomenon in the through-hole can be clearly seen from the figure.

Nozzle flow.
The pressure characteristics
Figure 9 is the pressure distribution cloud map of the axial section (X = 0 section) of the nozzle, and the pressure gradient phenomenon in the water flow can be seen from the graph. In order to better explain the pressure of water flow in different parts of the nozzle, three segments parallel to the Z-axis direction were selected. In the three line segments, respectively, draw the pressure numerical distribution curve of these three line segments, as shown in Figure 9, 4.5–2.5 mm is the inlet section of the nozzle, 2.5–9.5 mm is the swirl and straight-flow segments, 9.5–17 mm for the mixing chamber section, >17 mm for the nozzle outlet section. As shown in Figure 9, the nozzle in the shaft upward pressure loss of the site is mainly the entrance, spiral groove, and nozzle outlet part. When the water flow is entered through the nozzle inlet, due to the large circulation area, the flow rate becomes slow and stable, without producing pressure loss; in the transition part of the inlet section, the helical groove and the straight-through-hole, due to the sudden reduction of the circulation section and the increase of the flow velocity, the water flow of the pressure dissipation inside increases, pressure energy is mainly changed into kinetic energy of water flow. The curve in Figure 9 shows that the pressure just entering the spiral groove is larger than that in the through hole. This is because the cross-sectional area of the through hole is small and the pressure loss is large. In practice, the collision and friction between the water flow and the wall surface are also intensified the loss of pressure energy. In the through-hole, the flow velocity is stable and the pressure is basically unchanged due to the constant cross-sectional of the flow passage. In the spiral groove, the curvature of the streamline is large, the spiral is severely bent, and the water collides with the wall surface during the flow to cause pressure loss. Hence, at the mixing chamber and the nozzle outlet, the pressure loss is severe due to the smaller flow cross-sectional.

Pressure distribution cloud of nozzle axial section (X = 0) and curve of three lines segments.
The radial pressure distribution cloud map of the mixing chamber and nozzle outlet are shown in Figure 10. The upward numerical distribution curve in the radius direction is shown in Figures 10 and 11. In Figure 10(a), there is no pressure loss along axial direction; in other words, the pressure loss occurs only along the radial direction in the mixing chamber. The closer to the center part, the smaller the pressure value, which is due to the high-speed rotation of the flow from the spiral groove that results in lower pressure in the center of the mixing chamber. However, Figure 10(b) shows that negative pressure is generated at the central part of the nozzle outlet. The pressure gradient in the negative pressure and mixing chamber connects the nozzle with the outside air and at the same time generates an air eddy current at the center of the nozzle.

Radial profile pressure distribution cloud map: (a) mixing chamber and (b) nozzle outlet.
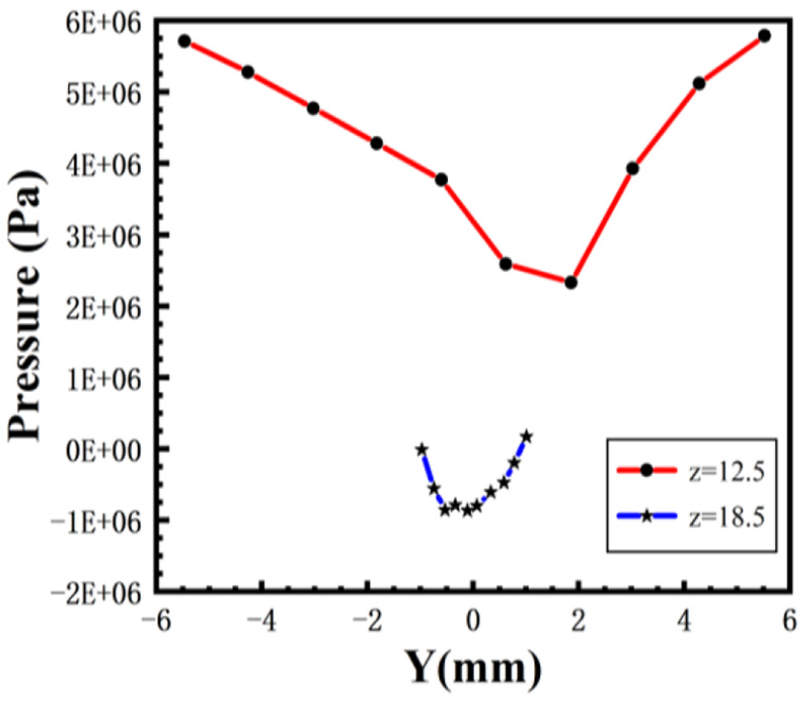
The pressure distribution curve of mixing chamber and outlet section along radius direction.
Speed characteristics
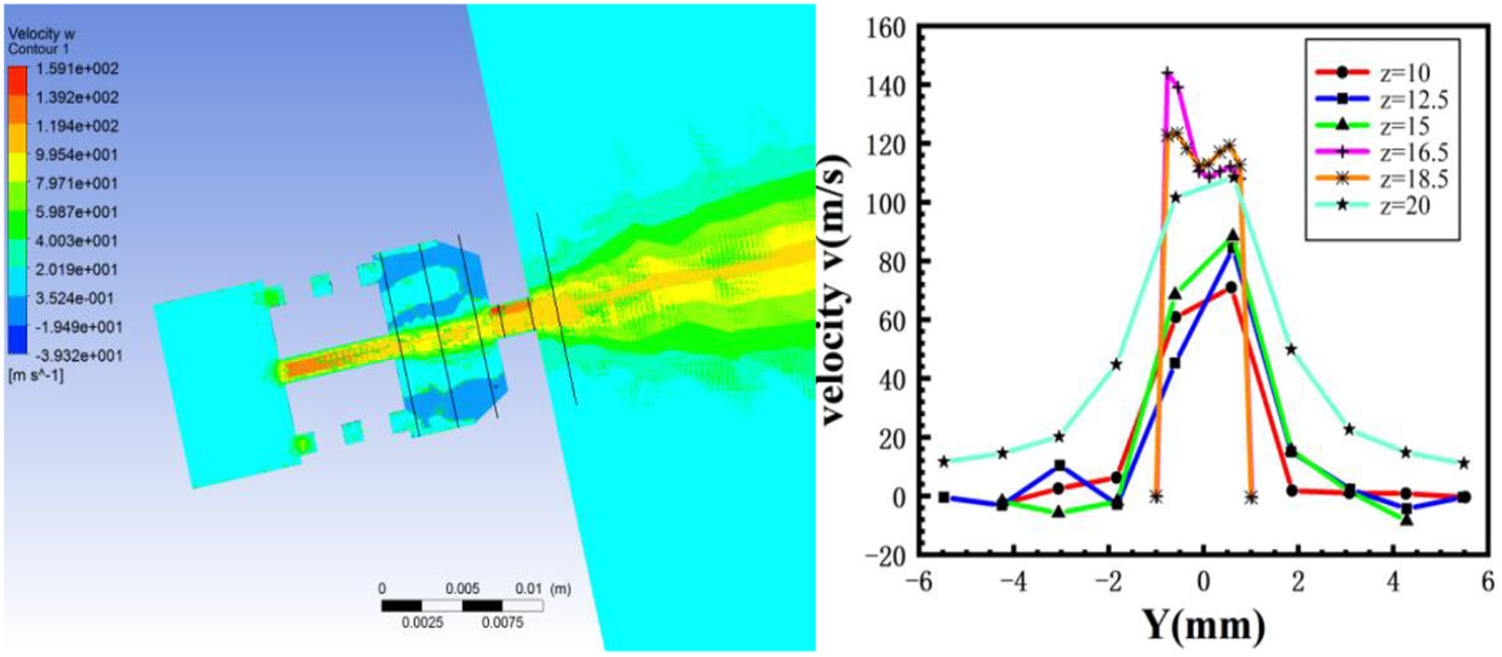
Figure 12 shows the total velocity distribution of the axial section of the nozzle. From the figure, it can be seen that the velocity increases when the flow enters the spiral groove and through-hole from the nozzle inlet in which the sudden decrease of the flow cross section and the change of the pressure energy of the flow transmitted into kinetic energy. And the velocity of the flow into the spiral groove is less than that of the through-hole because the cross-section area of the through-hole is smaller, the speed of transformation is also large. In order to figure out the velocity distribution of the mixing chamber and outlet in all directions, six parallel spline lines are intercepted as shown in Figure 12, in which their velocity distribution curves along the radius direction are obtained. Figures 12–15 are the distributions of total, axial, tangential, and radial velocities on the spline curves, respectively.

The total velocity distribution and the spline curve.
The spline curve of the axial velocity.

The graph of tangent velocity distribution of spline curve (X = 0).

The radial velocity distribution graph of spline curve (X = 0).
It can be seen from the spline curve of the total velocity in Figure 12 that the velocity distribution of the mixing chamber and the outlet section tends to gradually increase toward the center, and the velocity of the water flow on the wall is close to zero. The velocity of the water flow is increased gradually which is up to 142 m/s because the nozzle outlet area is reduced.
Figure 13 describes the axial velocity of the water in the radial direction increases as the radius decreases in the mixing chamber, and the axial velocity of the wall faces approaches to zero. In the nozzle outlet section, the shape of the axial velocity is similar to the “M” shape along the radial direction, which indicates that there is a distinct low velocity zone in the water flow. Due to the strong entrainment of the water flow, the center pressure of the rotation fluid decreases, while the outside air is sucked into the inside of the nozzle, hindering the movement of the center water flow, and at the same time a maximum speed is approached around it. On the one hand, the kinetic energy is transmitted due to the air velocity difference after the water flow is ejected. 16 On the other hand, due to the loss of the force of the inner wall of the nozzle, the radial direction is diffused with the direction of the velocity changing. Besides, the axial velocity component is converted into the radial velocity to cause the axial velocity to gradually decrease after the water jet is ejected.
From Figure 14, the tangential velocity distribution of the water flow is in “N” shape distribution approximately, which means the tangential velocity of the water flow is symmetrically distributed with the center, while the tangential velocity direction on both sides is opposite. The tangential velocity increases along the radius direction from the center, which is called “potential flow rotation zone” in the theory of rotational water jet, referred to as “potential vortex” (the increasing area of tangential velocity with the decrease of radius is called the potential flow rotation zone in the side circumference of cylindrical swirl equipment), and the liquid velocity of its fluid boundary is zero. When the pressure is reduced to the same pressure as the nozzle outlet, the potential flow rotation zone is cut off, due to combination of the fluid stickiness, the tangential velocity increases as the radius reduces and forms the “solid zone,” referred to as “vortex,” in which the fluid is like a rotating solid. When the water flow is ejected, the liquid spreads around by the tangential velocity, the tangential velocity attenuates rapidly, and the centrifugal action is weakened.
From Figure 15, the radial velocity of the mixing chamber and the outlet segment due to the constraint of the wall surface is small, the flow of water is ejected from the nozzle, the axial velocity component is transformed into the radial velocity component, and its radial velocity increases rapidly, which is reflected in the axial velocity distribution map and its direction is pointed from the center to the wall surface.
The air and water inlet flow rate
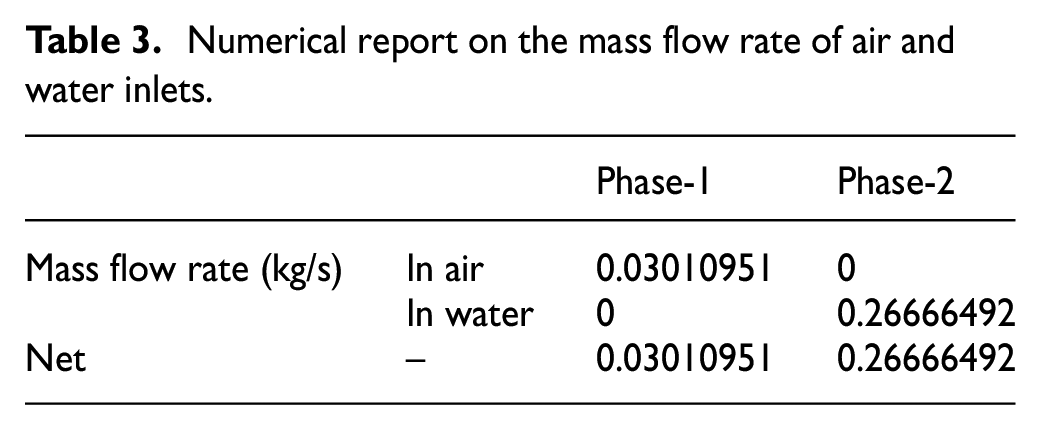
Through the post-report processing in FLUENT, the flow rate of gas and liquid at the water inlet and the air inlet can be obtained, as shown in Table 3, the mass flow rate of air is 0.030 kg/s, and the mass flow rate of water is 0.267 kg/s.
Numerical report on the mass flow rate of air and water inlets.
The analysis of orthogonal simulation experiment results
The geometry of the nozzle has major impact on the jet velocity and the atomization quality; and the nozzle structure parameters are many. It is necessary to carry out the comprehensive test of different geometric parameters for the preferred test quantity, so in order to optimize the optimal nozzle geometry parameters, the orthogonal simulation test group was designed. From the pressure distribution and velocity distribution curve, the axial velocity affects the range of the mist flow, the axial velocity is larger and the range is larger; the tangential velocity affects the diffusion angle of the mist flow, and the larger the tangential velocity, the more obvious the diffusion phenomenon; the air inlet mass flow. The rate is the amount of suction, the larger the suction volume, the better the dust removal effect. Therefore, the axial average velocity, the tangential average velocity and the air inlet mass flow rate at the nozzle outlet are used as test indicators. The theoretical analysis shows that the spiral groove width of the core (ta), the diameter of the through-hole (d), the outer shell diameter (D), and the inlet pressure (P) have a greater influence on the atomization quality, selected as experimental factors. So, the experimental factors are ta, d, D, and P, which is set as A, B, C, and D respectively, in orthogonal experimental design. Three values with better effect were selected for optimization and sensitivity analysis according to the search space and simulation analysis of each experimental factor; and the factor-level table of orthogonal simulation experiment was shown in Table 4.
Orthogonal simulation test factor level table.

In the simulation experiment, the individual influence of each factor on the atomization quality is considered without the interaction between various factors. So, the orthogonal table is selected as L9 (34).
The numerical simulation results are shown in Table 5. The analysis of axial average speed result range, tangential average speed result range, and air flow rate result range are shown in Tables 6–8.
Orthogonal simulation experiment results.

The axial average speed results range analysis.

The tangential average velocity results range analysis.

The air flow rate results range analysis.

Orthogonal experiment optimal parameters arrangement
The orthogonal experimental parameters combination design was carried out using four factors: spiral groove depth, diameter of through-hole, nozzle outlet diameter, and nozzle intake pressure. Through FLUENT simulation, the nozzle performance parameters were found to be the best combination of the experimental scheme 7, with the spiral groove depth of 2.5 mm, the diameter of through-hole of 1.2 mm, the diameter of nozzle outlet of 1.5 mm, and the inlet pressure of 1.5 MPa.
Single factor sensitivity analysis
According to the results in Tables 5–8, the axial average velocity distribution curve, the tangential average velocity distribution curve, and the air flow rate distribution curve are plotted in Figures 16–18, respectively.
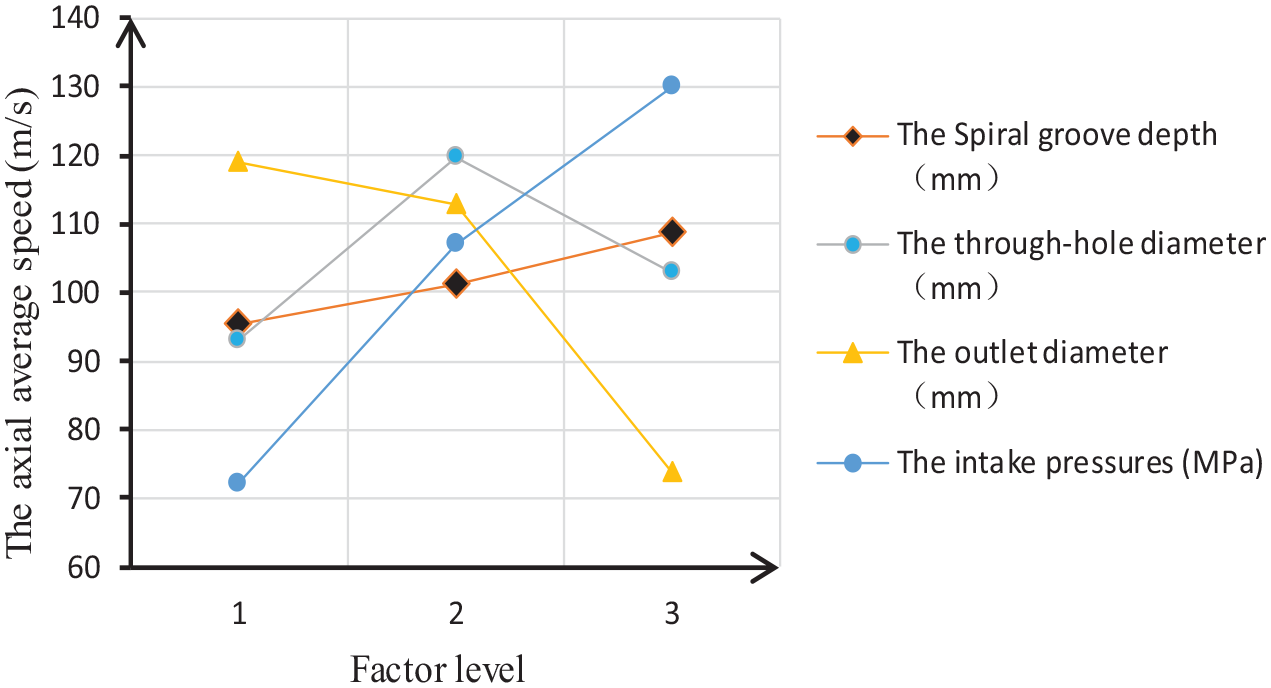
The axial average velocity distribution curve.

The tangential average velocity distribution curve.
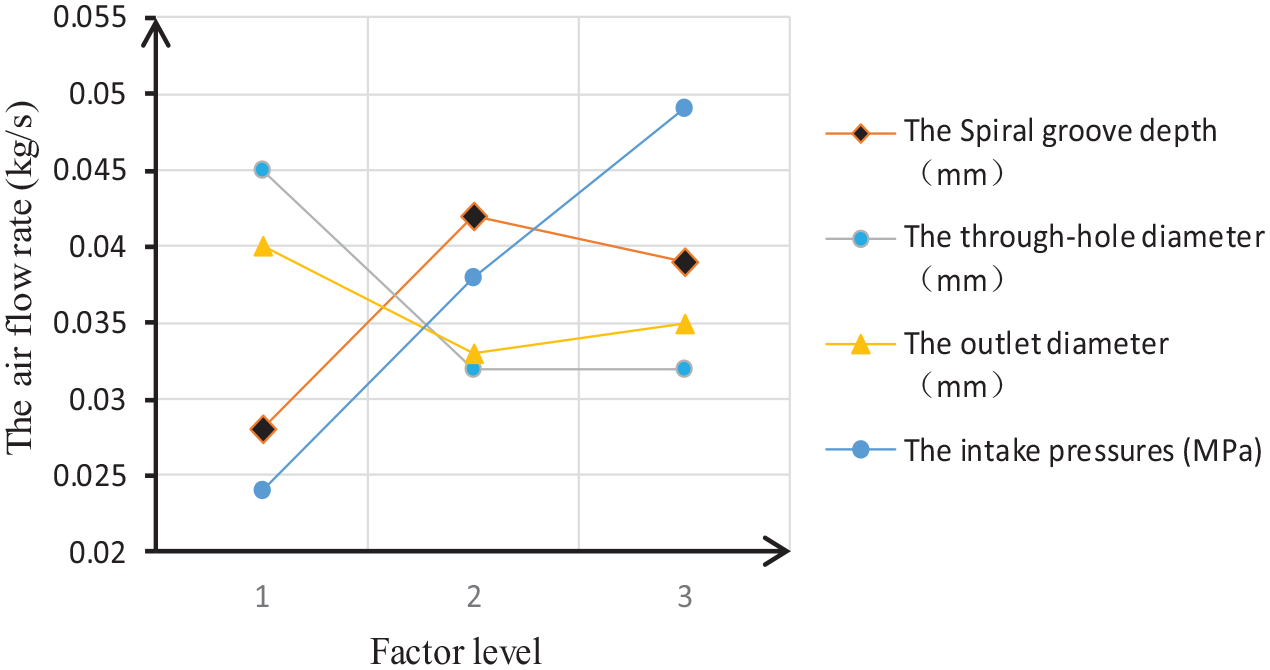
The air flow rate distribution curve.
According to the range of Tables 6–8, the order of factors under each index can be obtained, and the optimal level combination of factors can be determined according to the average value of different levels of each index, as shown in Table 9.
The primary and secondary order and optimization level of each indicator.
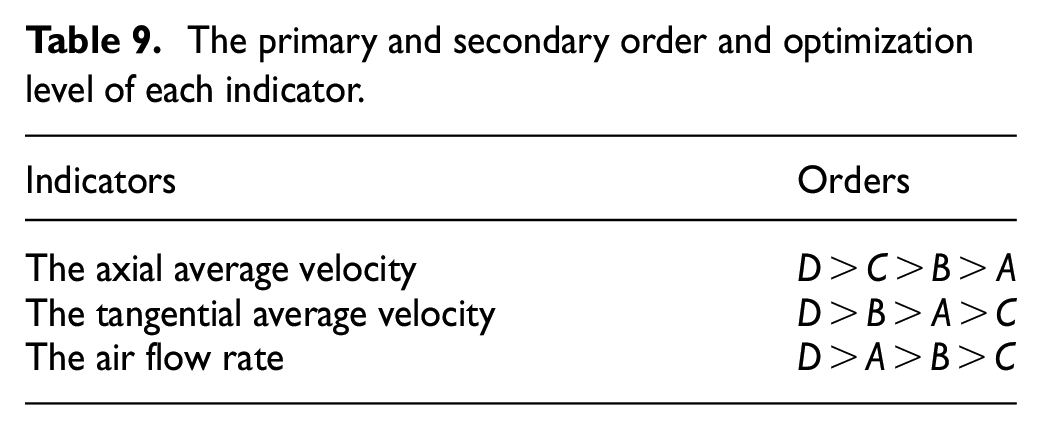
Table 9 shows that the influence of inlet pressure on the three indicators is in front, and it can be concluded from Figures 16 to 18 that the greater of the intake pressure, the larger of the three indicators, which indicates that the nozzle pressure is 15 MPa. Furthermore, the diameter of the nozzle outlet has a great influence on the axial average speed. And the axial average speed decreases with the increase of nozzle outlet diameter, so the nozzle outlet diameter is selected to be 1.5 mm. In addition, the influence of the nozzle outlet diameter is small among the tangential average velocity and the air flow rate, but the maximum value is obtained at 1.5 mm, so it is reasonable to be selected to 1.5 mm. It is crag-fast to find the best level because the diameter of through-holes affects the size of each indicator in the middle level. Thus, a comprehensive selection criterion should be considered. In the optimization level combination, there are two levels of B1 and B2. If B2 is selected, it can be concluded from Table 4 that although the axial average speed is 22.4% higher than B1, the tangential average speed is reduced by 10.2% and the mass rate is reduced by 40.6 %, so the diameter of the through-hole is 1.2 mm. Similarly, there are also two choices A2 and A3 for the width of the spiral groove. If A3 is selected, the axial average speed is 7% more than A2 and the tangential average speed is 15% higher, the air flow rate is reduced by 7.7%, so the spiral groove depth should be selected as 2.5 mm.
Therefore, according to the orthogonal simulation experiment, the optimal combination of nozzle sizes is A3 B1 C1 D3, that is, the spiral groove depth is 2.5 mm, the through-hole diameter is 1.2 mm, the nozzle outlet diameter is 1.5 mm, and the inlet pressure is 15 MPa.
Design of the inner-rotation nozzle
The nozzle is installed on the nozzle base of the water spray device, the nozzle base is connected with the transition joint, one end of the transition joint is connected with the high-pressure water supply system, the other end is equipped with the nozzle base, the curved cover plate is used for sealing, and the whole water spray device is used. The two-dimensional cross-sectional view is shown in Figure 19.

Water spray device and two-dimensional cross-section.
Physical experiments of the inner-rotation nozzle in negative pressure duster
The key to the ejector dust removal technology is the size of the negative pressure at the inlet of the ejector cylinder. 18 The larger the negative pressure, the larger the suction volume. The speed at which the nozzle ejects the jet has a direct influence on the magnitude of the negative pressure. Under other conditions, the greater the speed, the greater the negative pressure. One of the most important steps of inhaling the dust in the ejector cylinder under negative pressure is to mix, collide, adsorb, and bond with the particles of water to form a mixture with water to discharge the ejector. Therefore, in the ejector cylinder, the particle size, direction of motion, velocity and its distribution state of the water emitted by the nozzle affect the dust collection efficiency of the jet, which directly affects the performance of the ejector. To understand the effect of spray characteristic parameters (particle size, movement direction, speed and distribution state, and so on.) on duster efficiency, and the relationship between spray characteristic parameters and structural parameters (nozzle, ejector cylinder, nozzle on the ejector cylinder, and so on), This paper designs indoor and underground wind speed test system.
Laboratory wind speed test system
In order to obtain reasonable design parameters through experiments, a laboratory wind speed test system for the development of the ejector duster was designed. (See Figure 20, where the high-pressure pump is used to supply high-pressure water to the ejector duster, and its working pressure is 10–15 MPa. The flow rate is 15 L/min; the relief valve is used to adjust the pressure; the inlet pressure of the ejector is read from the pressure gauge; the negative pressure gauge is used to determine the negative pressure at the inlet of the ejector.) The working process of the laboratory wind speed test system is as follows: after the water from the water source is pressurized by the high-pressure pump, it reaches the nozzle through the pressure gauge, and is sprayed in the spray cylinder in a mist. The negative pressure at the inlet of the ejector cylinder is measured by a negative pressure gauge, and the wind speed at the inlet of the ejector cylinder can be calculated according to the negative pressure. The suction volume of the ejector can be further calculated based on the wind speed. The water consumption of the ejector duster can be read by a flow meter. Calculating the ratio of water consumption to suction capacity, the liquid–gas ratio of the ejector duster can be obtained.

The sketch of the laboratory wind speed measurement system.
As shown in Figure 21, the key component of the particle dynamics analyzer (PDA) subsystem is a three-dimensional particle dynamic analyzer, 19 which can measure parameters such as the velocity and particle size of the droplets. The working principle of the system is as follows: the water pressurized by the high-pressure pump is sprayed by the nozzle. The PDA hits a blue laser and a purple laser onto the water mist and focuses on the measurement point. Then, the laser signal reflected back from the water droplets is collected and sent to the data processor for processing to obtain parameters such as the velocity and particle diameter of the droplets to be measured.
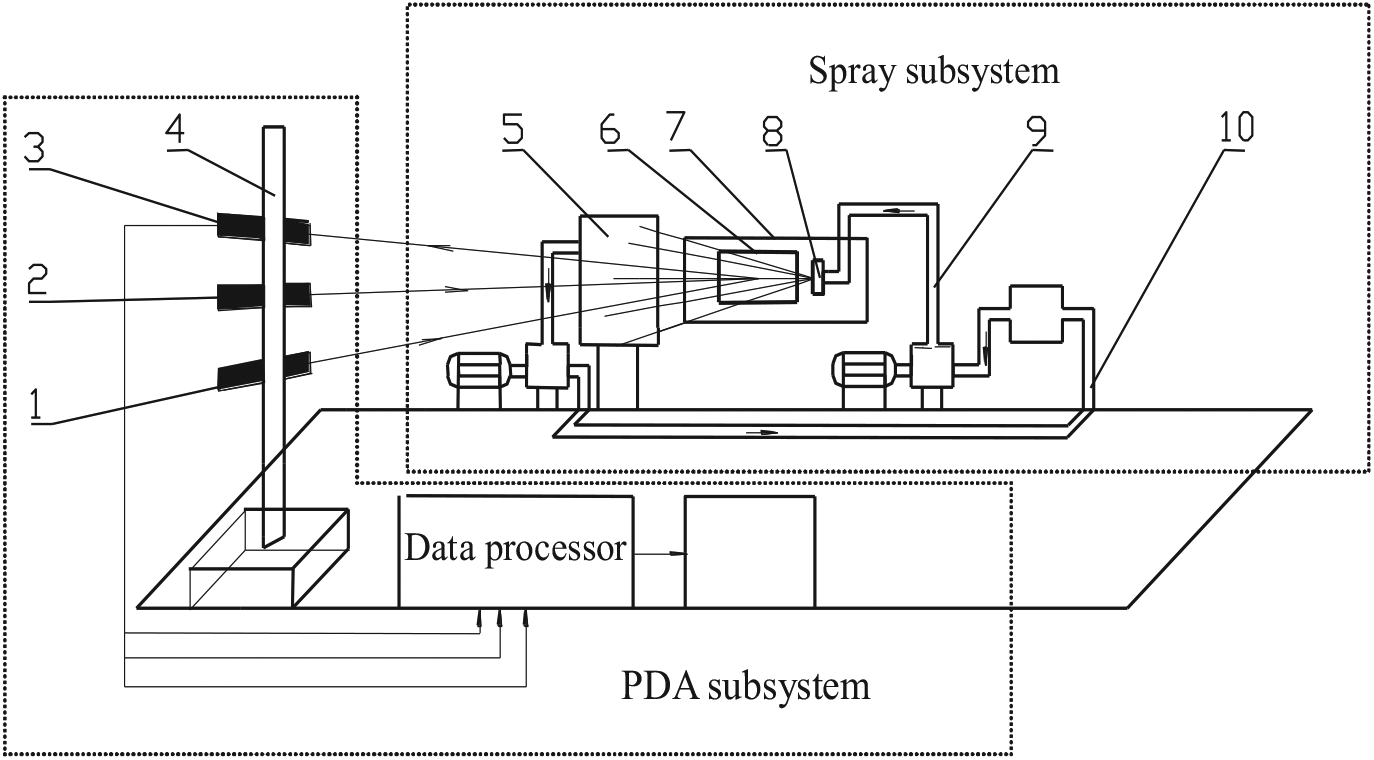
Diagram of microscopic testing experimental system.
Figure 22 shows the jet parameter test site. The Danter company’s 3D PDA system, the 3D particle dynamics analyzer, is a new measurement system developed on the basis of traditional laser Doppler velocity measurement. The basic principle is the phase Doppler principle, which realizes the simultaneous measurement of speed, particle size, and density without calibration. It is a non-contact absolute measurement technology.

Microscopic testing experimental spot.
Since the velocity, particle size, and density distribution of the droplets all affect the efficiency of jet collection for dust, these parameters were measured using a jet parameter test system. The experiment measured the jet that had been optimized when the nozzle was sprayed at a water pressure of 12 MPa.
The water spray from the nozzle is conical. According to its axis symmetry,20–22 it is only necessary to measure the droplet parameters on the half horizontal section (see the shaded part in Figure 23). The measuring point moves once every other distance along the axis of the spray, taking several measuring points on each radius. The order of movement is first axial, then radial, radial points are sampled, and then moved forward in the axial direction. At each sampling point, the laser dynamics analyzer samples 50 times. When the sampling time reaches 2 min or the number of collected droplets reaches 3000, the sampling process is ended. Except for individual measuring points, most of the measuring points can pick more than 1000 droplets in 2 min. U, V, and W are the velocity components of the droplets in the X, Y, and Z directions, respectively; X is the spray direction of the water mist.

The cutting plane of measurement.
The jet parameters experimental results
Table 9 is the experimental results of computer processing. According to the data in the table, velocity profiles (Figures 24–26) and particle size distribution (Figure 27) in three coordinate directions are obtained.
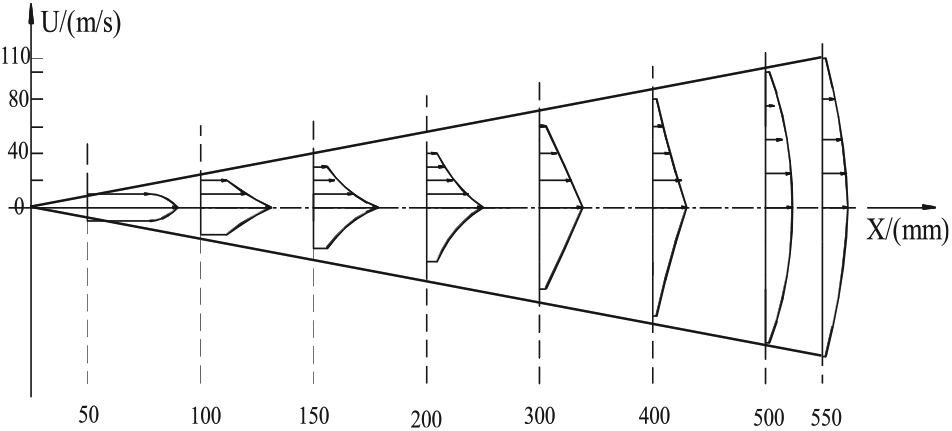
Distribution of speed in X direction.

Distribution of speed in Y direction.
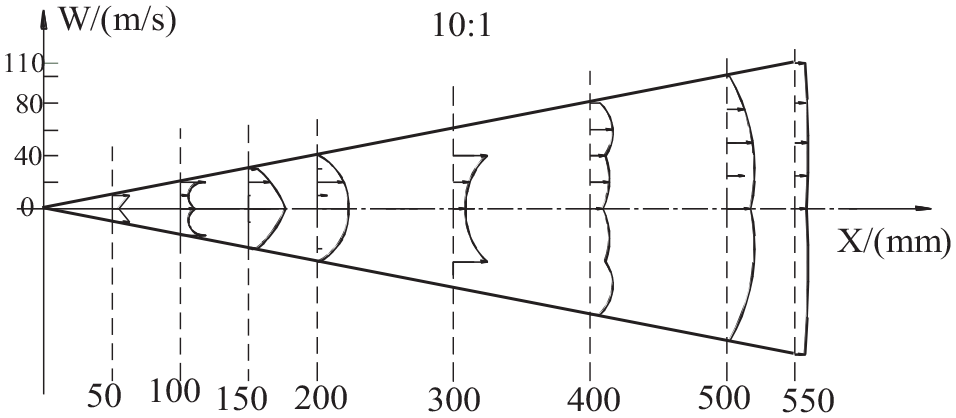
Distribution of speed in Z direction.

Distribution of diameter of spray particle.
From Table 10 and the distribution map, the velocity of the droplets in the X direction is the largest, with an average of about 30 m/s, the velocity in the Z direction is the smallest, almost zero; the distribution of the particle size DL is relatively uniform, and the average value is 27.0 µm.
Velocity distribution and spray particle’s spread.

It is generally believed that the droplet velocity of the ejector duster should be controlled above 20–30 m/s, and the droplet diameter should be controlled within the range of 20–50 µm. The experimental results show that the design of the ejector duster meets this requirement.
Underground experimental system
The underground field experiment was carried out in a group of fully mechanized top coal caving face. 23 The working face air volume is between 800 and 1896 m 3 /min, the maximum wind speed is 3.7 m/s, and the average effective area of the working surface is 8.5 m 2 .
Figure 28 is the diagram of the field experiment system. When the hydraulic support is working, the shut-off valve and the high-pressure pump are opened, and the relief valve is adjusted to make the pressure of the pressure gauge reach the working pressure of the duster. When the precipitator is working normally, the dust sampler is turned on to collect the dust sample on the leeward side, and the water consumption of the precipitator is read from the flow meter.

Spot testing system.
The test uses the XRB2B (A) type emulsification pump with a rated working pressure of 20 MPa and a rated flow of 80 L/min. The dust sampler used was an AFQ-20A dust sampler with a sampling flow rate of 20 L/min.
Analysis of downhole test results
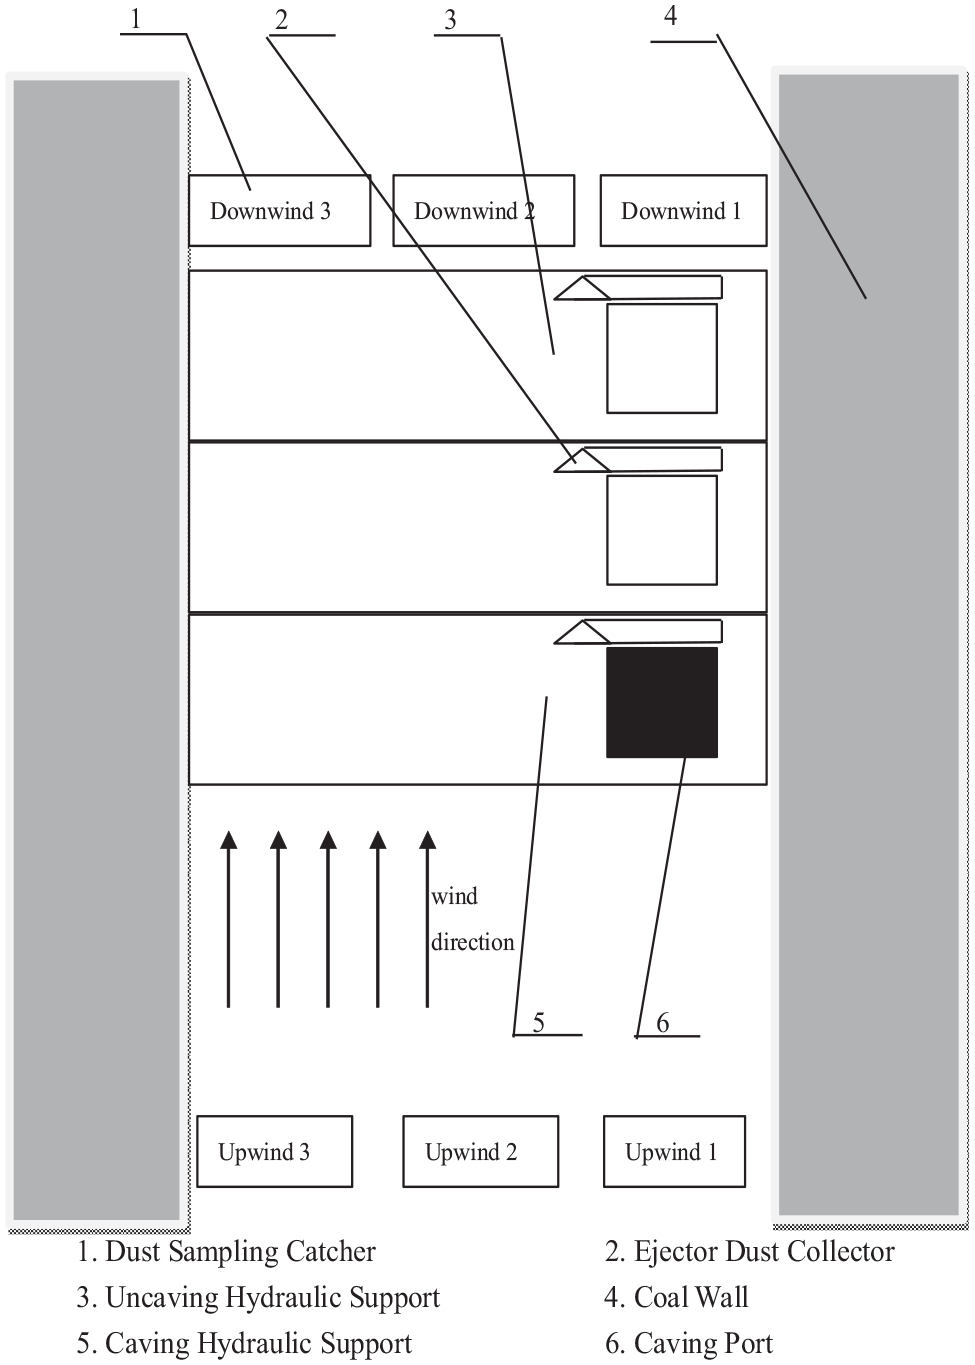
The content of the downhole experiment is to detect how much the dust concentration in the vicinity of the coal discharge is changed by the ejector duster.24,25 The dust sampling point is arranged on the upwind side 5-m away from the coal inlet, and Figure 29 is the layout of the dust sampling point.
Arrangement of dust measurement.
Arrangement of measuring points
Since the ejector mainly solves the problem of dust removal at the coal caulking port, the measurement focus is on the prevention and control effect of the ejector on the dust near the coal caulking port. The measurement is carried out twice according to the production conditions of the working face. The measuring points are arranged near the coal vents on the up and down wind side and 5 km apart from the ejector and on the sidewalk.
Calculation of dust density
Since there are two types of dust sampling pre-catchers used, there are two corresponding methods for calculating dust density.26,27
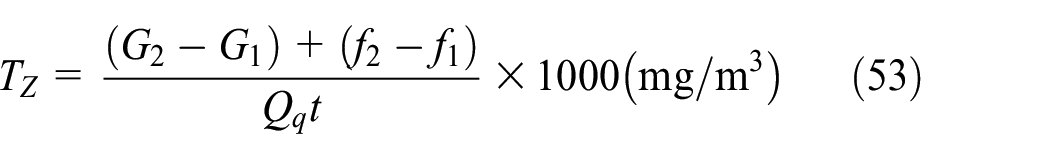
① Calculation of dust density when using a full dust pre-catch

where TZ, total dust density (mg/m3), f1 mass of filter before sampling, F2 mass of filter after sampling (mg), Q sampling flow rate (L/min), and T sampling time (min).
② Calculation of dust density when using impact pre-catch
Respirable dust density

Total dust density
where R, respiration dust density (mg/m3); f1 mass of filter before sampling; F2, filter membrane mass (mg); TZ, total dust density (mg/m3); G, sampling plate mass before sampling (mg); Q, sampling flow rate (L/min); T, sampling time (min).
Measurement results
Table 11 is the measurement result of the downhole experiment. If there is no ejector duster, the dust generated by the coal discharge port is brought to the downwind side by the basic wind flow, and the dust concentration on the leeward side will be higher than the upwind side. However, due to the dust removal effect of the ejector duster, the dust concentration on the leeward side is significantly lower than that on the windward side. Dust removal efficiency of dust collector refers to the percentage of dust collected by dust-laden airflow through dust collector to the amount of dust collected into dust collector. When the dust collector does not leak air, the dust removal efficiency is equal to the ratio of the difference between the dust concentration on the upper side (total dust concentration and respirable dust concentration) and the dust concentration on the lower side and the dust concentration on the upper side. The dust removal rate in the table is calculated as follows
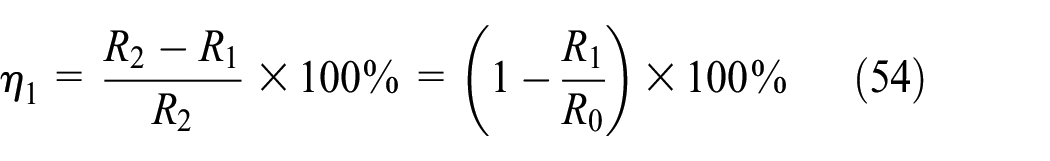
where
Measure result in fully mechanized mining face.

In the wet dust collector, the purified gas contains droplets, and there are dust particles in the droplets, which will reduce the total dust removal efficiency of the dust collector. It is assumed that the dust concentration in the droplet is R2 when the droplet is entrained in the outlet gas on the downwind side
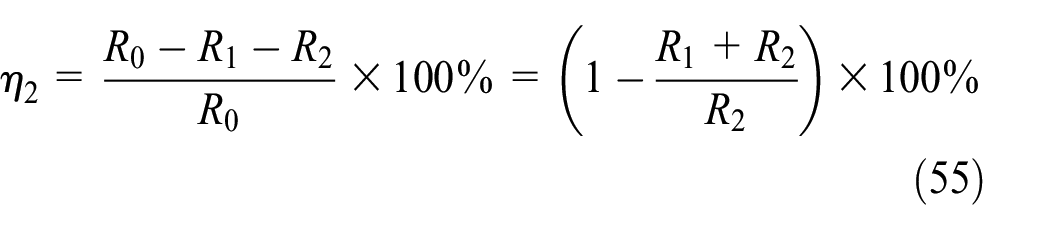
In practice, the actual dust removal efficiency is to subtract 10% of the water effect. Therefore, the average dust removal rate of field test is 57%.
Conclusion
This article designs a good internal rotation nozzle with good atomization ability, long service life, and low water consumption. The performance of the nozzle was verified by combined parameter optimization, numerical simulation, experimental simulation, and field test. The main conclusions are as follows:
This article designs a novel inner-rotation nozzle structure, which consists of a shell and a core. The outer surface of the nozzle core is a spiral groove, and the center of the nozzle core is a straight hole. Through the numerical simulation of the structure parameters affecting the atomization effect of the nozzle, the optimum combination level of the nozzle can be obtained, namely A3 = 2.5 mm, B1 = 1.2 mm, C1 = 1.5 mm, and D3 = 15 MPa.
In order to explore the influence of structure parameters, a set of wind speed experiment system and PDA experiment system was designed. The experimental results show that the combination of nozzle structure parameters can improve the requirement of negative pressure duster to reduce dust. The optimized ejector duster was tested in a fully mechanized mining face of a coal mine. The air volume of the working face is 800–1896 m 3 /min, the maximum wind speed is 3.7 m/s, the average effective area of the working face is 8.5 m 2 , and the sampling points are arranged on the upper and lower sides of the roadway. The average dust removal rate measured is 67%, which is about 12% higher than that of the ejector duster before optimization. However, the actual dust removal efficiency is to subtract 10% of the water effect in practice. Therefore, the average dust removal rate of field test is 57%.
Footnotes
Handling Editor: Pietro Scandura
Declaration of conflicting interests
The author(s) declared no potential conflicts of interest with respect to the research, authorship, and/or publication of this article.
Funding
The author(s) disclosed receipt of the following financial support for the research, authorship, and/or publication of this article: This work was supported by National Fundamental Research Funds for the Central Universities of China (Grant No. 2017YJ02), National Undergraduate Innovation and Entrepreneurship Training Program (Grant No. 201611413086), Beijing college students innovation training project (Grant No. K201504024), Beijing cross training program for high level talents in higher education institutions (Grant Nos 2016 and 2017), The Innovation training project of China University of Mining and Technology (Beijing) (Grant Nos C201404026, C201504022, and K201504016).