
Abstract
In this study, Aeshna cyanea dragonfly forewing mid-cross-section corrugated airfoil was simulated at ultra-low Reynolds number. The corrugated airfoil was compared with its smooth counterpart to study the effect of the corrugations upon the aerodynamic performance. Unsteady two-dimensional laminar flow was solved using FLUENT. This study was divided into gliding phase and flapping phase. In the gliding phase, the corrugated airfoil produced a higher lift force with respect to the profiled airfoil at both tested Reynolds numbers (
Introduction
In the 1990s, the Defense Advanced Research Projects Agency (DARPA) initiated the challenge to create small and lightweight flyers to mimic nature. Consequently, the micro aerial vehicles (MAVs) became a research frontier attracting the researchers all over the world.1,2 The MAVs concept is based on being small and inexpensive unmanned aerial vehicles comparable in size to biological flyers which put them in a new category of aviation aircraft.3,4
The aerodynamic challenge is represented by the low Reynolds number
In nature, the greatest optimizer, there are no examples of fixed wings or even rotary wings. Nature gave flapping wings the chance to be evolved over millions of years. All birds and insects have well-defined wings and fuselage that blend together. By flapping, birds and insects can produce both lift and thrust forces to make extreme maneuvers, fly effortlessly, and sustain flight for long durations. 6 Flapping wings are nature’s answer for the perfect MAVs. 7 The interest in flapping wings field has increased rapidly over the past few decades. Hence, a lot of efforts have been made to enhance our understanding of flapping aerodynamics. The more we understand, the better our MAVs design becomes. Insects such as dragonfly, locust, and hawkmoth represent a frontier for researches due to their unique wing shape and kinematics.
Several studies were concerned with dragonfly experimentally and numerically.8–19 Dragonfly is basically a flapping insect which can flap its wing with approximately 40 beats/s.20–23 The wingbeat frequency was found to be size-dependent as small species tend to use higher frequency than large species.
21
However, dragonflies can be considered to be also gliders. The Aeshna cyanea dragonfly species can glide up to
Okamoto et al.
9
were one of the very first researchers who studied the corrugated shape of the airfoil and the aerodynamic characteristics of a real dragonfly’s wings and body through three-dimensional (3D) experiments. All the aerodynamic characteristics have been studied within the Reynolds number range
Vargas et al.
11
used the immersed boundary method with non-body conformal Cartesian grids to solve the time-dependent, incompressible, viscous Navier–Stokes equations. The studied corrugated airfoil corresponds to profile 2 in Kesel.
10
They were able to clearly observe the trapped vortices inside the corrugations, which cause the airflow stream to be similar to the profiled airfoil. The trapped vortices produced a negative shear drag; therefore, the contribution of the shear drag in the total drag for the corrugated airfoil was lower than the other two tested airfoils. The corrugated airfoil was found to produce a comparable and even sometimes higher lift force with a comparable drag force to the profiled airfoil. Furthermore, Vargas et al.
11
concluded that the corrugated airfoil has an aerodynamic performance benefit compared to the conventional airfoils. It provides a stiff structure with lightweight which can resist bending loads. They suggested that such a wing can be useful in the future MAVs’ wing design. Kim et al.
24
conducted a 2D numerical analysis to study the effects of the corrugations upon the drag and the lift coefficients. Various corrugation shapes were solved using FLUENT solver at different Reynolds numbers for different angles of attack. They were able to capture the generated vortices inside the corrugation valleys which gave the dynamic smoothing effect. The numerical results showed that the corrugations found in the dragonfly forewing increased the lift coefficient for all the tested angles of attack compared to its smoothed version at
Based on the above-mentioned survey, it is of great importance to study the aerodynamic performance of the corrugated airfoil during different flight phases. This study is going to be as a step for a better understanding of nature for better MAVs performance. It is clear that the performed 2D analysis cannot predict the 3D effects of the actual dragonfly wing in nature. However, it gives a clear view about the flow behavior among the corrugations and the effect of the trapped vortices. On the current research, the corrugated airfoil based upon A. cyanea dragonfly forward wing mid-cross-section will be considered as the main airfoil. The corrugated airfoil will be analyzed in two different flight phases (i.e. gliding and flapping). For the gliding phase, different parameters will be varied to study their effect on the airflow stream, hence the aerodynamic performance. The results will be compared to the flat-plate as a base airfoil. For the flapping phase, the effect of reduced frequency variation will be considered to study its impact on the aerodynamic forces and the propulsive efficiency.
Numerical method
Numerical settings
The flow motion around the tested airfoils is governed by the so-called Navier–Stokes equations which consist of conservation of mass, momentum, and energy. The energy equation is ignored since the flow is assumed to be isothermal. In this study, FLUENT solver was used to solve the 2D, unsteady, incompressible, viscous flow. The flow is assumed to be laminar; hence, no turbulent models were needed to be coupled with the governing equations.
FLUENT is a finite volume solver that turns the Navier–Stokes equations into a set of algebraic equations to be solved numerically. The pressure-based solver was used since the flow is incompressible. Two algorithms can be found under the pressure-based solver, namely, segregated solver and coupled solver. In the segregated solver, FLUENT solves the pressure correction (i.e. the continuity equation) and the momentum equations sequentially. In the coupled solver, FLUENT solves the pressure correction and the momentum equations simultaneously. 26 The pressure-based coupled solver was suitable for our calculations since we only deal with a single-phase flow (namely, air) with low speed.
The coupled solver requires more memory than the segregated solver; however, it produces more accurate solutions. The solutions of the discrete governing equations from FLUENT are stored at the center of the control volumes, so interpolation is needed to transfer the solutions to the control volume faces. For the gradient interpolation, the Least Squares Cell Based was used. Due to the presence of swirling flows trapped inside the corrugations’ valleys and the possible vortex shedding, it was recommended by FLUENT manual 26 to use the Quadratic Upwind Interpolation (QUICK) scheme in the momentum interpolation. The Pressure Staggering Option (PRESTO) scheme was used for the pressure to accurately predict the high gradient over the corrugated airfoil surfaces.
The solutions obtained from FLUENT solver must satisfy our convergence criteria conditions, 26 so we can clearly adopt the solution. The convergence criteria conditions are as follows:
All the Navier–Stokes equations’ residuals must achieve the limit of
The overall mass imbalance must be less
The appearance of the requested phenomena (i.e. vortex shedding in our case).
The aerodynamic forces (i.e. lift and drag) are computed from the pressure and the shear stress integrations over the tested airfoil surfaces. Their corresponding coefficients are defined by


where the lift and the drag forces are denoted by
Airfoil geometry
Okamoto et al. 9 and Kesel 10 obtained different cross sections by slicing the dragonfly forewing into several elements. Many researchers including Vargas et al. 11 used the same geometry. Vargas et al. 11 constructed their study upon the mid-cross-section of the A. cyanea dragonfly forewing (profile 2 in Kesel 10 ). The corrugated airfoil used in this study is based on Vargas et al. 11 The corrugated airfoil is shown in Figure 1(a).

Tested airfoils: (a) corrugated airfoil, (b) profiled airfoil, and (c) flat-plate.
A lot of trials were carried out to get the points of the corrugated airfoil. The points were extracted digitally, but the corrugated shape was found always to lack the accuracy needed for the solution. The thickness of the airfoil and the corrugations shape (i.e. the sequence of edges and bends) were found to influence the solution significantly, 10 so the accuracy of the shape was of great importance. Finally, the airfoil points were taken from Vargas 27 PhD thesis. The airfoil edges were kept sharp without smoothing as it was reported that the blunt corners and sharp corners experience almost the same results. 28
All insects in nature with their different species were found to fly at ultra-low Reynolds number (i.e.
The tested airfoils were solved under the same conditions. The study parameters were the same used by Vargas et al.
11
The mean chord length
In seeking to complete the aerodynamic study, the flapping phase of the corrugated airfoil was necessary to be investigated. During a flapping motion, an effective angle of attack

where

Definition of the effective angle of attack. 29
For all the flapping tested cases, the airfoil center of rotation was made at quarter the mean chord length
Equations (4) and (5) are used to describe the coupled corrugated airfoil plunging and pitching motions


where
To be able to understand the aerodynamics behind the flapping mechanisms, several non-dimensional parameters have to be considered, one of them is the reduced frequency. The reduced frequency

The product of the frequency by the mean chord length (i.e.
Power coefficient and thrust efficiency calculations
One of the current study parameters of interest is the power

where

where

The moment can be non-dimensionalized as

The input power can be also non-dimensionalized as follows

The propulsive efficiency is a measure of the energy lost in the wake versus the energy used in creating the necessary thrust, which can be expressed as 32
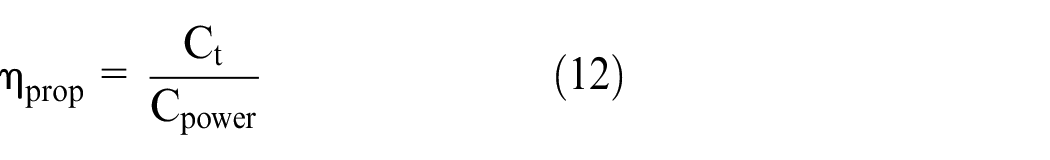
where the thrust coefficient is defined as33,34

The definition of the propulsive efficiency loses its meaning when the airfoil produces drag instead of thrust.
Computational domain
In this study, we nominated the computational domain to be a squared domain with structured elements to simulate reasonably the corrugated shape of the main airfoil. The schematic diagram of the domain is depicted in Figure 3.
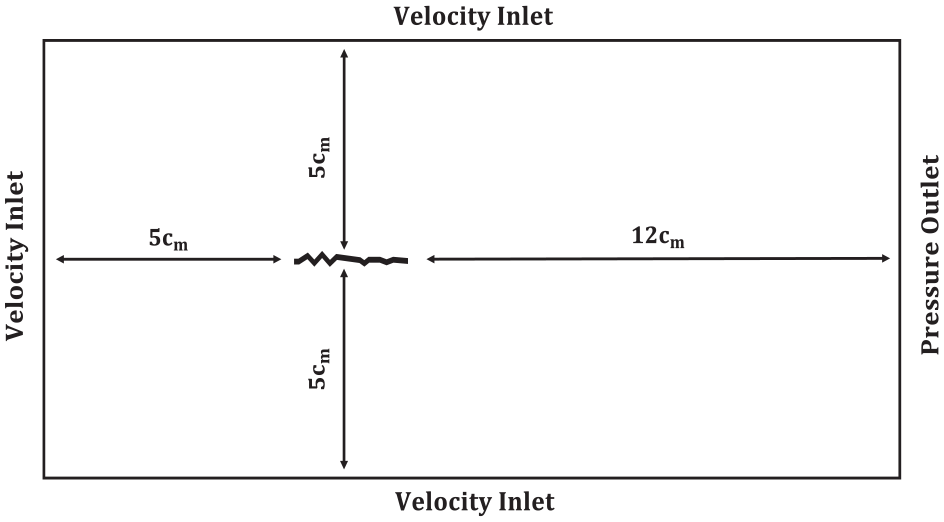
Computational domain.
The computational domain consists of four boundaries. All the boundaries were far enough to eliminate their effects on the geometry wall (i.e. airfoils). In the present gliding analysis, we were interested in a narrow range of angles of attack. Hence, the domain size was chosen to be relatively small. The upper and the lower boundaries were made at a distance of
For the flapping phase, all the independent studies’ simulations were conducted for the combined pitching and plunging motions of the corrugated airfoil at a flapping frequency of
Figure 4(a) and (b) illustrates one complete cycle for the forces coefficient values evaluated for three different domain sizes. The first number in the legend represents the upper, the lower, and the upstream distances, while the second number represents the downstream distance. The time axis was normalized for one complete flapping cycle. Finally, based on the obtained results, the domain size was updated so that the upper and the lower boundaries were positioned at a distance

Corrugated airfoil forces coefficient in a flapping motion for different domain sizes: (a) lift coefficient and (b) drag coefficient.
Mesh generation
Due to the geometry complexity, ICEM-CFD was needed. ICEM-CFD represents a powerful tool to control every single point along the domain which gave the ability to adjust accurately the position of the nodes along the chosen airfoils’ edges. The mesh consists of three grid regions with different cell sizes. The first region surrounds the airfoil with clustered mesh to capture the vortices with high fidelity. The growth rate was set to be

Mesh around the corrugated airfoil.
For the flapping phase, a mesh-independent study was carried out to ensure that the mesh resolution was enough to capture the solution details (i.e. vortex shedding phenomena). The results shown in Figure 6(a) and (b) represent the forces coefficient values for one complete cycle at different mesh sizes, namely, fine mesh (

Corrugated airfoil forces coefficient in a flapping motion for different mesh sizes: (a) lift coefficient and (b) drag coefficient.
The need for dynamic mesh rises from the requirement of the airfoil to flap in a certain prescribed motion. The mesh must be able to absorb the deformation performed by the motion and simultaneously track the body. To be able to use dynamic mesh model in FLUENT, we must construct the very first volume mesh and provide a description of the boundary motion. FLUENT provides either boundary profiles, user-defined functions (UDFs), or 6-degree-of-freedom (6-DOF) solver to describe the motion of the boundary.
26
In this study, the UDF was used to describe the boundary motion. The UDF is basically a C code with a lot of varieties of pre-written macros which can be linked to FLUENT. For FLUENT to recognize the UDF files, they must be compiled or either interpreted. All the dynamic meshing macros require compiling.
35
The UDF macro used in this study based on the literature is the
Time-independent study
For the gliding phase, the time step of

Time-independent study for the corrugated airfoil in a flapping motion.
Validation
To be able to solve our main gliding and flapping problems, a validation case was required to validate the adapted mesh strategy and the used FLUENT setup. The validation problem can be summarized as a flat-plate with

The pitching amplitude in our case equals

Aerodynamic coefficients versus the instantaneous AOA: (a) lift coefficient and (b) drag coefficient.
Results and discussion
Gliding phase
During all the performed simulations, it was noted that the flow behaves as a steady flow at
Figure 9 illustrates the flow streamlines at the maximum lift coefficient for the corrugated airfoil at angles of attack of

Streamlines of the corrugated airfoil at Re = 1400: (a) 0°, (b) 5°, (c) 10°, and (d) 15°.
The average lift and drag coefficients for the tested airfoils are depicted in Figures 10 and 11 when the Reynolds number equals

Coefficient values at Re = 200: (a) lift and drag coefficients versus AOA and (b) polar diagram.
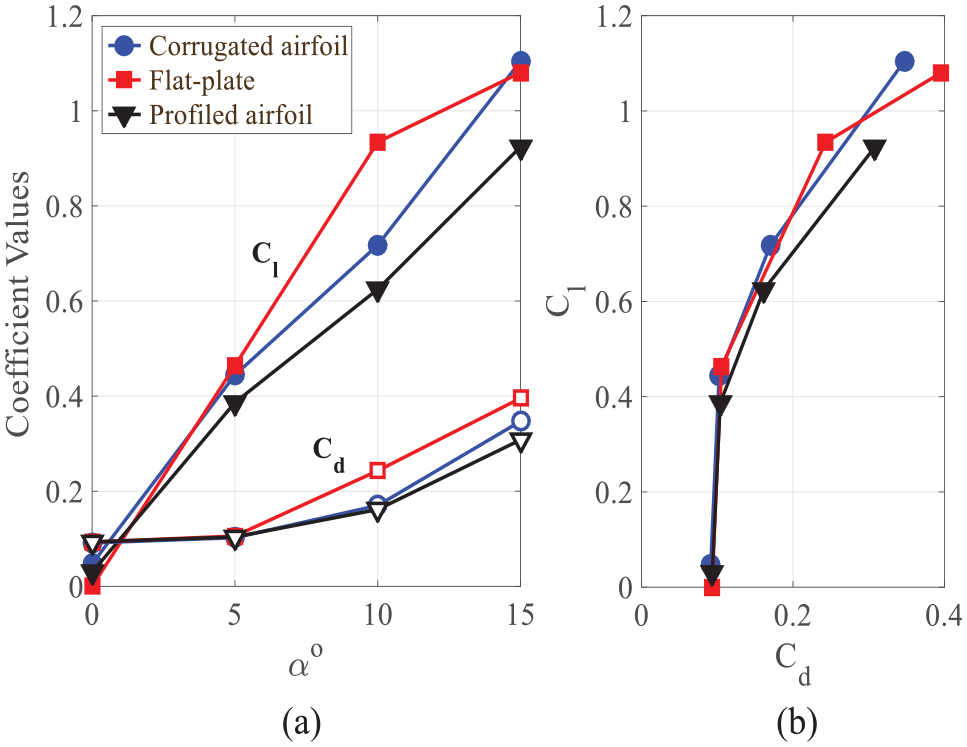
Coefficient values at Re = 1400: (a) lift and drag coefficients versus AOA and (b) polar diagram.
Figure 10 illustrates that the flat-plate produced almost the same lift force with respect to the corrugated airfoil with approximately the same drag coefficient. However, Figure 11 illustrates the superior performance of the flat-plate at
Figure 12(a) and (b) illustrates the gliding ratio for the tested airfoils at

Gliding ratio (Cl/Cd) versus AOA: (a) Re = 200 and (b) Re = 1400.
Figure 13 compares the static pressure coefficient
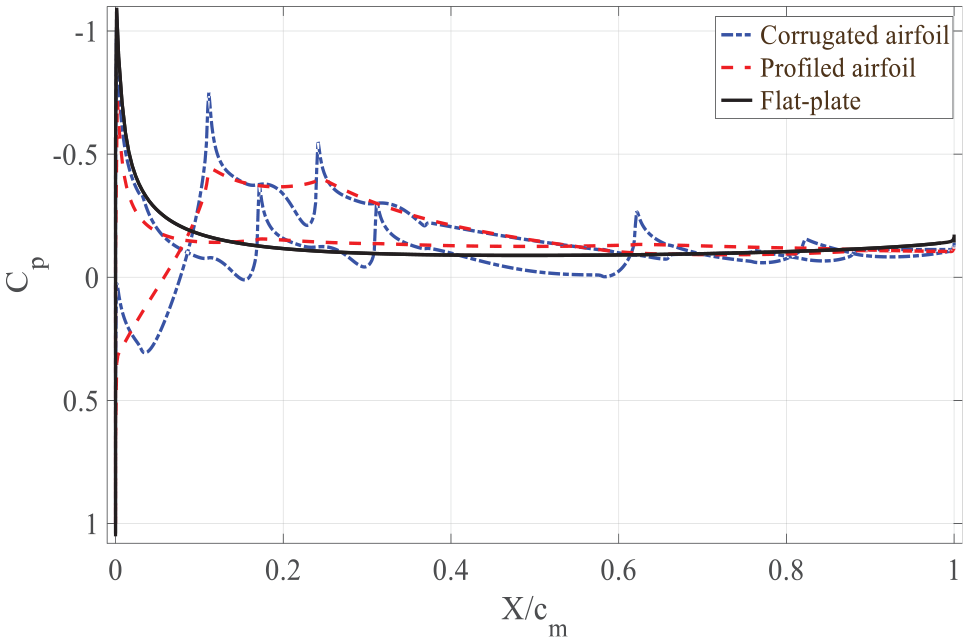
Static pressure coefficient distribution for the tested airfoils at α = 0° and Re = 1400.
Figure 14 illustrates the streamlines formed around the tested airfoils at fixed angle of attack of

Streamlines of the tested airfoils at α = 5°: (a) Re = 200 and (b) Re = 1400.
Table 1 presents the components of the drag coefficient for the tested airfoils at
Drag force coefficient’s components for the tested airfoils at α = 5° for two different Reynolds numbers.

The streamlines analysis showed the importance of the corrugated airfoil in reducing the net drag coefficient compared to the streamed airfoil (i.e. profiled) and the flat-plate by reducing the viscous drag force coefficient. From the performed analysis, we can say that the corrugated airfoil always performs better than its smoothed version (i.e. profiled airfoil) at low Reynolds number, and sometimes its performance is comparable to the flat-plate. Hence, the profiled airfoil will be excluded from the flapping analysis.
Flapping phase
The effect of the frequency was studied by fixing the other flapping parameters. The Reynolds number, plunging amplitude, pitching amplitude, and phase difference were kept fixed at
Figure 15 shows the instantaneous static pressure contour for the corrugated airfoil and the flat-plate at

Static pressure contours for the corrugated airfoil and the flat-plate at Re = 1400, f = 40 Hz, yo = cm, θo = 90°, and φ = 90°: (a) t ≈ 0/10 T, (b) t ≈ 2/10 T, (c) t ≈ 4/10 T, (d) t ≈ 6/10 T, and (e) t ≈ 8/10 T.
Figure 15(d) illustrates the movement of the TEV downstream to the trailing-edge as the airfoil starts to accelerate in the upstroke motion. At the same time, the LEV began to be formed on the lower surface of the airfoil. As the airfoil continues in the upstroke motion, the effective angle of attack increases causing the LEV to further increase. At the same time, the TEV is sheded to form the reversed von Kármán vortex street hence, improving the thrust coefficient. Figure 15(e) represents the airfoil upstroke acceleration phase. During this phase, the LEV began to move downstream of the lower airfoil surface; however, the LEV is still attached to the airfoil surface. The lift and the thrust coefficients reach one more time almost their maximum values during the flapping cycle with respect to the negative sign for the lift coefficient. Thus, the thrust force is a twin positive peak during the complete cycle with a higher value during the downstroke than the upstroke. The airfoil now began to decelerate as the end of the upstroke is being approached. The end of the upstroke is coupled with a rapid rotation of the airfoil, called the supination rotation.
The two airfoils were found to have similar static pressure contours. Obviously, the corrugations did not have much influence on the flow field around the airfoil rather than their main influence was to change the thrust and the lift forces. The averaged values of the lift, the thrust, and the power coefficients together with the propulsive efficiency for both the corrugated airfoil and the flat-plate can be found in Table 2. The coefficient values are very similar for the two airfoils. The lift coefficient was found to be higher than that for the flat-plate, which can be attributed to the curvature presence in the corrugated airfoil due to the corrugations along the upper and the lower surfaces. The propulsive efficiency was found to be slightly higher in case of the corrugated airfoil than that for the flat-plate.
Performance parameters for the corrugated airfoil and the flat-pate (Re = 1400, k = 1.229, yo = cm, θo = 30°, and φ = 90°).

Figures 16 and 17 represent the thrust and the lift coefficient variations of the corrugated airfoil for one complete flapping cycle resulting from the pressure variation caused by the vortices formation and shedding for the different tested frequencies. During the first few flapping cycles, the flow field around the airfoil seems to be unstable due to the start of the movement which affects the forces coefficient values. Eventually, the flow began to be stable causing the forces coefficient values to reach a quasi-steady condition. The forces coefficient values were calculated to be the average over one complete flapping cycle. The forces coefficient values need to be set for at least four cycles to reach an acceptable error between the cycles.

Corrugated airfoil thrust coefficient for various flapping frequencies.

Corrugated airfoil lift coefficient for various flapping frequencies.
In contrast to the lift force, the thrust force over one flapping cycle is being generated in both the upstroke and the downstroke motions as shown in Figures 16 and 17. This can be explained as a result of the aerodynamic force presences normal to the relative airflow around the airfoil, which has a positive thrust component in both the upstroke and the downstroke motions. In Figure 16, the first peak corresponds to the downstroke and the second peak corresponds to the upstroke.
The peak formed during the upstroke was smaller than that formed during the downstroke, which can be due to the corrugations effect on the forces coefficient values. By increasing the flapping frequency, the aerodynamic forces increased, which can be attributed to the effective angle of attack increase. Figure 17 illustrates that for
The effects of the reduced frequency on the thrust and the lift coefficients at
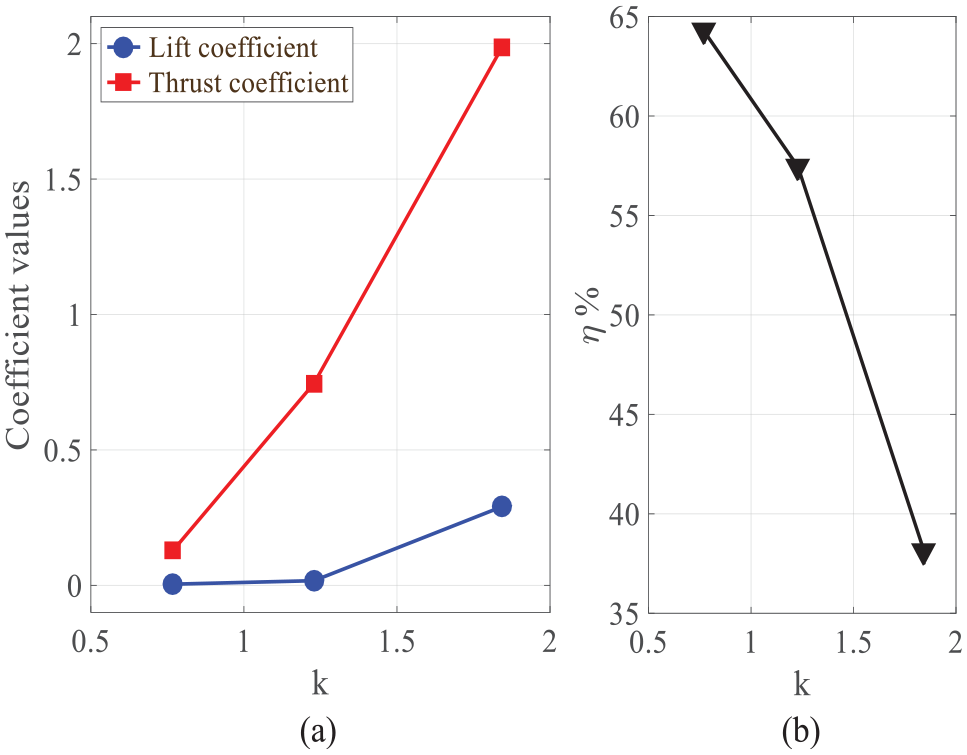
Reduced frequency effect: (a) coefficient values and (b) propulsive efficiency.
Static structure analysis
As it was previously demonstrated that both the corrugated airfoil and the flat-plate have a very similar aerodynamic performance, it was necessary to investigate their structural performance. A wing with
Material properties. 38

In the present simulation, we are only interested in the wing’s deflection under the applied load to compare the stiffness between the corrugated airfoil and the flat-plate. Figure 19 represents the corrugated airfoil deflection. The corrugated airfoil thickness varies along the chord length with a maximum value of

Corrugated airfoil deflection in m.
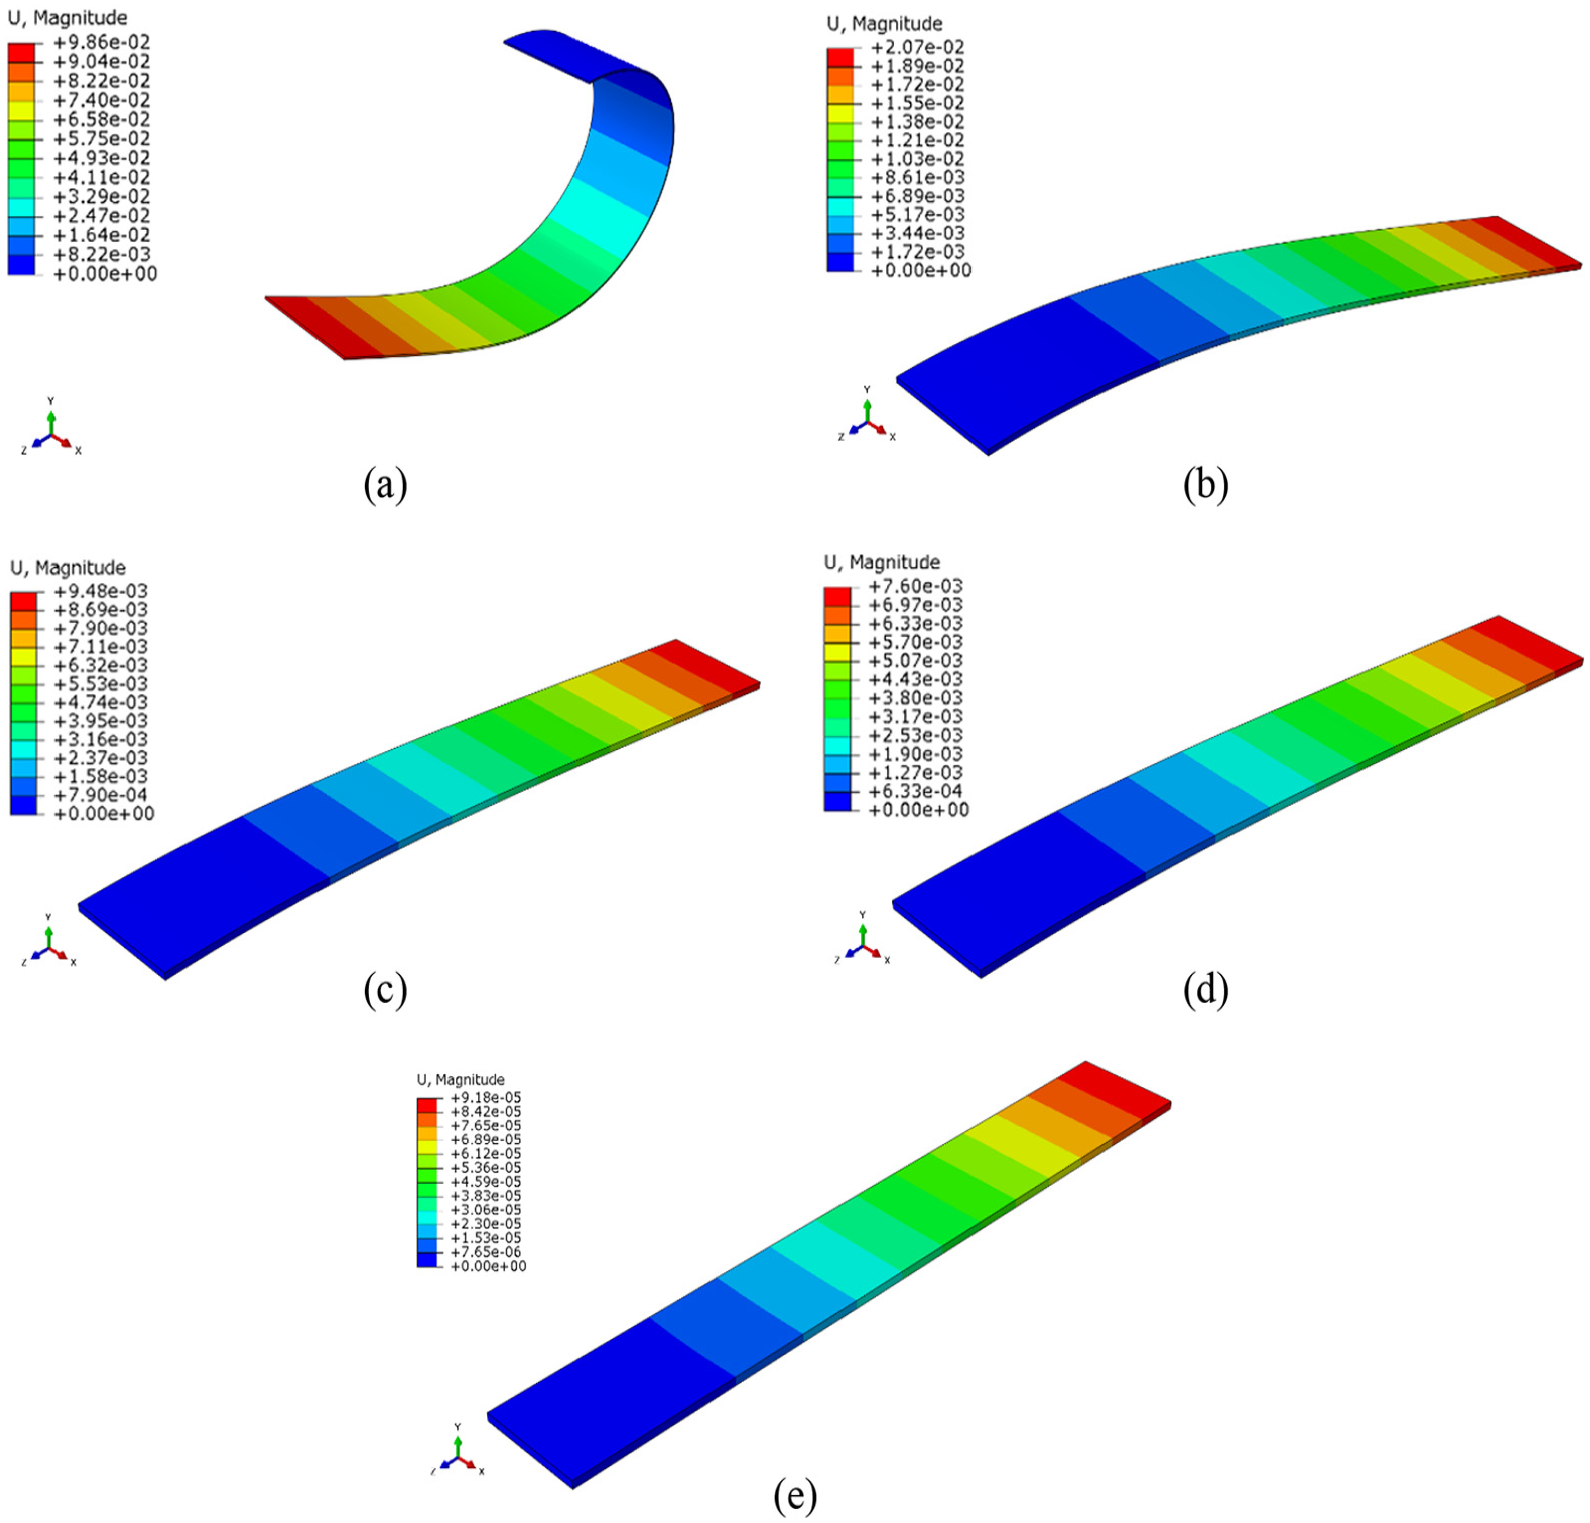
Flat-plate deflection in m for different flat-plate thicknesses: (a) 0.18 mm, (b) 0.5 mm, (c) 0.65 mm, (d) 0.7 mm, and (e) 0.75 mm.
Table 4 represents the weight of the different tested cross sections and their corresponding deflection. We can clearly see that the flat-plate thickness which corresponds to the thickest region in the corrugated airfoil (i.e.
Weight and deflection variation of the different tested cross sections.

Finally, although the corrugated airfoil and the flat-plate have almost the same aerodynamic performance, the flat-plate cannot be used to replace the corrugated airfoil unless its weight increased.
Conclusion
In this study, A. cyanea dragonfly forewing mid-cross-section corrugated airfoil was simulated at ultra-low Reynolds number. The corrugated airfoil was compared with its smooth counterpart to study the effect of corrugations upon the aerodynamic performance. A flat-plate was also added to the comparison as a base airfoil. This study was divided into two main phases, namely, gliding phase and flapping phase.
For the gliding phase analysis:
At
The corrugated airfoil was found to produce an increasing lift force among all the tested angles of attack for the two tested Reynolds numbers. The results indicated the importance of the corrugations in producing the lift force even if there is no recirculating flow inside the valleys at high angles of attack. At
For the flapping phase analysis:
The static pressure contours for the corrugated airfoil and the flat-plate revealed the importance of the LEV formation and the shedding of the TEV in generating both thrust and lift forces by forming the reversed von Kármán vortex street. The results obtained for both the corrugated airfoil and the flat-plate under the same circumstances showed slight differences between their aerodynamic performances. The lift force obtained for the corrugated airfoil was slightly higher than that for the flat-plate, which can be explained due to the camber presences for the corrugated airfoil. The thrust trend obtained was a twin peak for both tested airfoils. The generation of the thrust force during the downstroke was higher than that for the upstroke for the corrugated airfoil, while it has almost the same value for the flat-plate during the upstroke and the downstroke.
Based on the performed simulations, increasing the reduced frequency has a great impact on the thrust and the lift forces. Increasing the reduced frequency from
Although the corrugated airfoil and the flat-plate have the same aerodynamic performance, the flat-plate cannot be used to replace the corrugated airfoil due to its low stiffness properties.
Finally, based on the conducted simulations, the corrugated airfoil is a preferable choice in MAVs due to the high performance at low Reynolds number and high strength with light structure weight.
Footnotes
Appendix 1
Handling Editor: Dean Vučinić
Declaration of conflicting interests
The author(s) declared no potential conflicts of interest with respect to the research, authorship, and/or publication of this article.
Funding
The author(s) received no financial support for the research, authorship, and/or publication of this article.