
Abstract
The female/male screw rotor profile design for a twin screw compressor poses challenges such as frequent parameter modification and a difficult-to-build performance test platform, which affect the efficiency of a rotor profile design. To address these problems, a new idea of applying a B-spline curve to a twin screw compressor rotor profile design is proposed in this article. In addition, the design result underwent fluid simulation based on fluid dynamics technology. This method overcomes the aforementioned challenges. As a meshing line has one-to-one mapping relationship with the rotor profile and reflects important performance parameters of the rotor profile, the method of deducing female and male rotor profiles for a twin screw compressor from a meshing line is proposed. Furthermore, the B-spline curve is used as a composition curve of the meshing line to achieve fast local adjustment of the rotor tooth profile. Based on existing rotor profiles, a meshing line is designed via the B-spline curve, and female and male rotor profiles are derived in reverse. The final rotor profile underwent fluid simulation via computational fluid dynamics analysis under various conditions to analyze the pattern of the internal flow field, which is compared with the results from conventional design.
Introduction
Twin screw compressors are deployed in many industries that require high performance, low noise, and high efficiency. 1 As the screw rotor has a unique geometrical structure, it is difficult to collect various data even via testing; this is particularly the case for internal parameters of compressors. The internal pressure of compressors can be collected via sensors; however, this requires careful deployment of high-quality sensors in the rotor. Furthermore, internal fluid velocity of compressors cannot be measured via a normal method. Moreover, screw rotor processing and manufacturing requires special machine tools, and the test screw rotor eventually becomes waste; this is a challenge for enterprise. Computational fluid dynamics (CFD) analysis for twin screw compressors is a viable substitute for these processes. Compressor design is optimized based on the simulation result, and the final result is validated via testing. Therefore, CFD computation has become an important process in twin screw compressor design. 2 The core idea is to discretize a continuous parameter. For example, the original pressure and velocity are continuous in the time and space domains. Now, the variable is replaced by a set of finite number of discrete points. The equation set for the relationship between discrete point variable values is created based on predefined rules. Finally, approximate solutions for field variables are obtained. 3
Rane et al. 4 proposed a method to generate a non-structured grid and analyzed compressor performance and transient flow field in an operational chamber via CFD. Wu et al.5,6 proposed a new numeric computation model for a screw compressor and validated the model via testing. Kovacevic et al.7,8 applied a numerical method to screw compressors and applied this method extensively to study fluid mechanics. To address the challenge of performing CFD numerical simulation for the leakage caused by a compressible medium flowing through a narrow gap, Pascu et al. 9 proposed a grid generation technology that is suitable for extremely small gaps and then performed CFD simulation of the model for gas leakage via gap.
Researchers have studied twin screw rotor profile design and optimization extensively and have achieved modest success. Wu and Fong 10 proposed a method to describe the rotor gear profile equation via a dual-section cycloid equidistant line. This composite curve can be adjusted freely in design. They also proposed the optimization of the rotor tooth profile via unconstrained continuous minimization. Litvin and Feng 11 investigated vector-based rotor profile expression and analyzed the characteristics of a rotor profile and the effect of a rotor contact gap on compressor performance. Although forward design theory is mature, compressor performance cannot be predicted directly via the rotor profile; it can only be determined by female and male rotor meshing lines. To obtain a complete screw rotor profile with desirable performance, numerous modifications and verifications are required, making the entire design process extremely complex. To address this problem, reverse design theory was created. Reverse design for a screw rotor profile was initially proposed by Zaytsev and Ferreira:12,13 it started from a sealing line design; then, based on the sealing line, the screw rotor profile was calculated. This method summarized the requirement of the meshing line design, investigated the relationship between the meshing line and end surface profile, and optimized the rotor end surface profile. Li 14 deduced the conjugate curve equation for the arc envelope via the meshing line, analyzed transmission performance based on rotor profile optimization design, and obtained the relationship between transmission performance and structure parameters, which provided theoretical guidance for rotor profile optimization design.
Currently, rotor profile design and optimization are mostly based on points, straight lines, and simple curves such as quadratic curves. Therefore, the created screw rotor has an inferior streamline, which results in a significant loss in compressor aerodynamics during operation. 15 As a free curve has numerous advantages such as local support, the effect of each functional segment in the meshing line on compressor performance parameters is investigated in this article. The B-spline-curve-based rotor meshing line is deduced based on a curve meshing principle for screw rotor structure design. Based on an existing rotor profile, a meshing line segment is created via B-spline fitting to obtain a rotor profile reversely. A simulation model for a twin screw compressor flow field is created. Based on the twin screw compressor CFD computation method proposed in this article, a numerical simulation of a compressor flow field distribution pattern is performed. The flow field distribution patterns of the prototype line and the new profile under various conditions are compared.
Computing fluid dynamics for a twinscrew compressor
Twin screw compressor model meshing
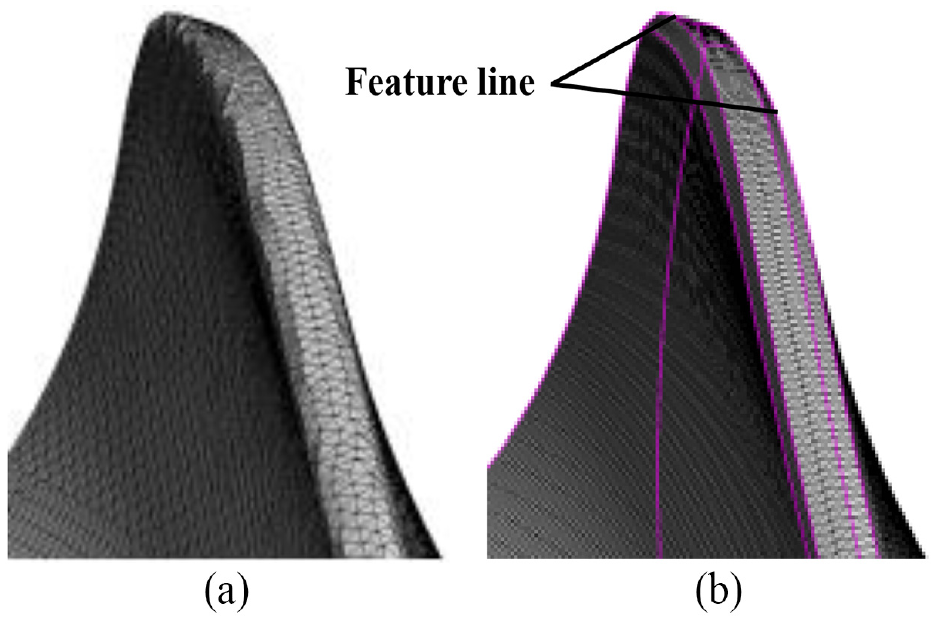
In this article, CFD solver STAR-CCM+ is used to implement CFD computation for a twin screw compressor. Screw compressor meshing is based on a hybrid processing method where an ANSA preprocessor handles the model and divides the surface grid while STAR-CCM+ divides the body grid. To minimize the difference between grids for teeth of the same screw rotor, the ANSA preprocessor processes a geometrical model of the screw rotor and divides the surface grid. This not only maintains consistent grid distributions for different teeth but also minimizes the grid difference in the same tooth range. The processing result is shown in Figure 1. Grid model processing should also focus on the effect of the feature line. Dividing the surface grid actually means representing the model surface via a grid with finite dimensions. If there is no feature line, a subtle feature in the model such as an arc with small curvature or chamfer will be replaced by a grid. The most important feature of the screw rotor is the feature of a rotor tooth curve. Therefore, the feature of the rotor tooth curve should be preserved as much as possible, as shown in Figures 2, 3 and 4. For example, in Figure 2(b), the highlighted line is a feature line of the rotor tooth. The diagram clearly shows that rotors with a preserved feature line are extremely similar in every tooth gap and very close to the original tooth profile. In Figure 2(a), the feature line is not marked, and features of the rotor tooth curve become distorted during grid division.

Female rotor mesh.

Feature line of male rotor tooth: (a) unlabeled feature line and (b) marked feature line.
Figure 5 shows the fluid model of the twin screw compressor. Figure 5(a) shows the grid model of the entire fluid model, which is divided into three parts: inlet fluid domain, intermediate fluid domain, and outlet fluid domain. Inlet fluid domain and outlet fluid domain are both based on polyhedron grid division. A polyhedron grid creation diagram is shown in Figure 5(b). On the model surface, first, the center of the triangle grid is defined as a vertex of the polyhedron grid; then, it diffuses and expands into the model to create a polyhedron grid. The tangent plane shape of the polyhedron grid can be adjusted adaptively based on the surface grid distribution. The tangent plane shape is not fixed, and it can be pentagon or hexagon or polygon with more edges. The polyhedron grid is very close to the surface. The intermediate fluid domain is based on the incision body grid, which significantly reduces the grid quantity and improves the model computing speed. The major reason for dividing the intermediate fluid domain via a hexahedron is to reduce the grid quantity and improve the computing speed. When the intermediate fluid domain is divided by 10 mm tetrahedrons, the number of grid cells is 5,899,578. When the same intermediate fluid domain is divided by 10 mm hexahedrons, the number of cells drops significantly to 752,011. After comparison, the second plan is selected to improve the computing speed.
Feature line of female rotor tooth: (a) unlabeled feature line and (b) marked feature line.

Mesh of the female and male rotors.

Fluid model of twin screw compressor: (a) mesh model, (b) polyhedral mesh generation process, and (c) fluid domain grid section of screw compressor.
Figure 5 shows a segment of the fluid domain model, that is, the internal body grid of the fluid domain model. The diagram shows that the intermediate fluid domain grid can be densified near the rotor surface to adapt to the slope variation of the rotor surface. In this way, the grid model is a more accurate approximation of the actual rotor surface. Table 1 lists the type and quantity of body grids for each part of the entire screw compressor fluid domain after final division. The table shows that the ratio of nodes to cells of the polyhedron grid is 6, while the ratio of nodes to cells of the hexahedron grid is less than 2, which indicates that the polyhedron grid significantly reduces the number of grids. In addition, note that the numbers representing the node quantity and body grid quantity of the intermediate fluid domain in the table will change when grid is reconfigured during computing.
Fluid domain mesh of the screw compressor.

Numeric computation model for the twin screw compressor
The compressor operation process apparently shows that physical model computing should be based on transient computing. In this article, CFD computation is still based on transient computing and the realizable
In this article, a numeric computation model for twin screw compressor internal fluid model is created based on the following assumptions:
The behavior of compressed gas is similar to that of ideal gas.
The operation medium is only in the computing model and will never leak into the external environment.
Lubrication oil will not affect the operation medium during operation.
Circulations at the inlet and outlet are isentropic.
The operation cycle in each primitive volume in the twin screw compressor is a theoretical operation cycle.
CFD solution process for the twin screw compressor
STAR-CCM+ can record user operations including all executable operations such as defining the boundary condition, modifying the initial condition, and modifying the physical model as the program control “macro.” Here, a macro is equivalent to an executable template. When a macro is applied to the computing model, all previously recorded operations are executed in sequence. If the operation sequence needs to be changed, the macro can be edited or modified to achieve the goal. In this article, CFD computation for the twin screw compressor is based on a macro. Figure 6 shows the complete process of the new CFD computation method for twin screw compressors in this article. Considering that when the screw rotor develops a deformation when passing through the rotational fluid domain, the step of “calculating the intermediate fluid domain via imprint + difference” is included in the computing process. The purpose of the imprint is to identify the position of the rotor on the cylinder end surface after rotation. “Substituting the rotor geometrical model” primarily solves the problem of the uneven gap between rotor teeth. The reason for “reconfiguring the intermediate fluid domain body grid” is because when the screw rotor rotates, or the rotor geometrical model is substituted, the intermediate fluid domain changes; thus, the body grid should be changed accordingly.
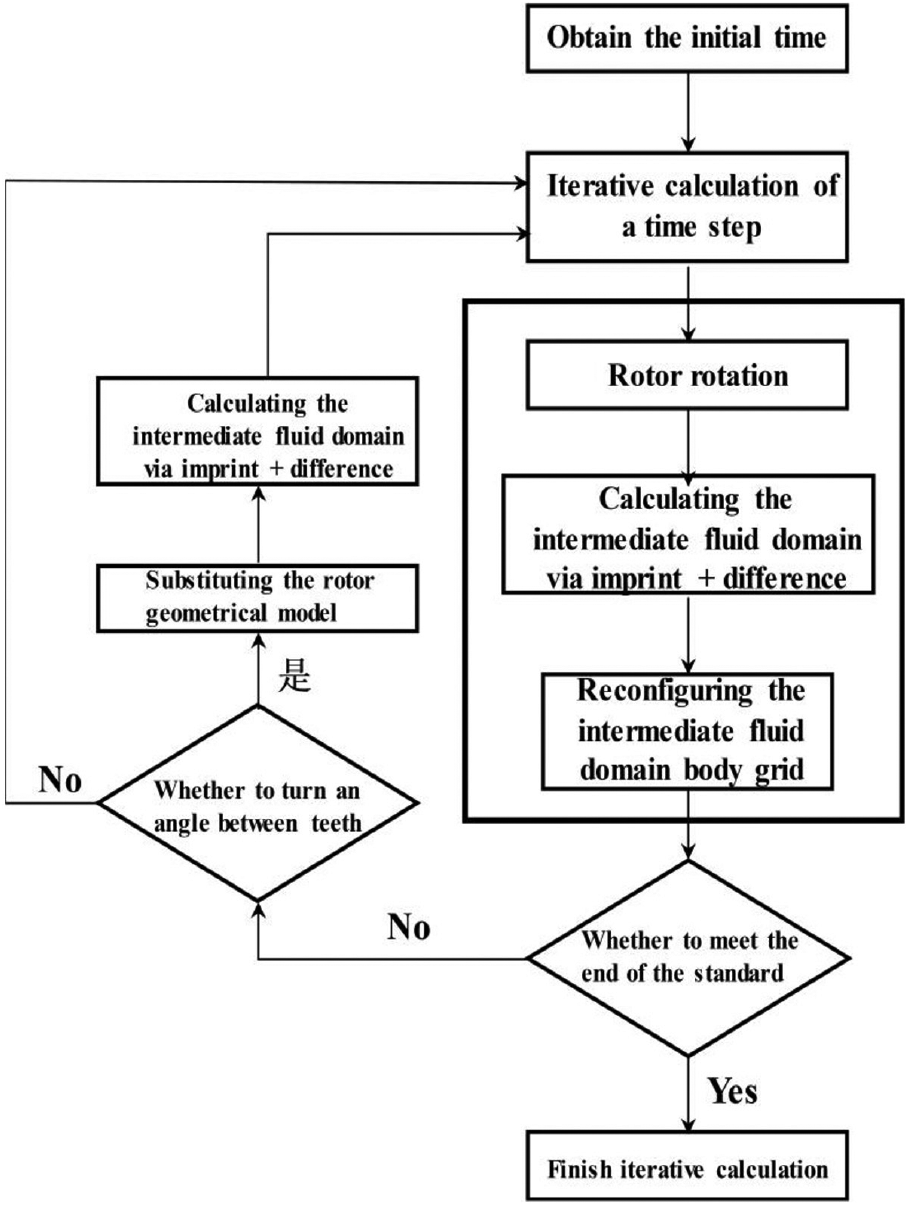
Macroprocess of the twin screw compressor CFD computation control.
During computing, the screw compressor fluid domain is divided into three parts, which reduces the computational complexity of the body grid reconfiguration and accelerates the computing speed. Hence, rotor rotation and rotor geometrical model substitution only affect the intermediate fluid domain. As the intermediate fluid domain is based on a hexahedron non-conformal grid, the body grid is independent from the surface grid, that is, only the hexahedron grid is reconfigured, and reconfiguration of the surface grid is omitted to achieve a substantial improvement in computing speed. In addition, each rotor rotation angle is calculated based on the rotor rotating speed and time step. Whether the rotor rotates over one inter-teeth angle and whether the stop criterion is satisfied are determined by macro execution and the calculated parameter values.
Although the screw compressor fluid domain is divided into three parts, the parts are actually connected. Therefore, a boundary between different parts in the model should be defined, as shown in Figure 7. There are three pairs of boundaries: boundary 1–1 and 1–2 constitute boundary 1, 2–1 and 2–2 constitute boundary 2, and 3–1 and 3–2 constitute boundary 3.
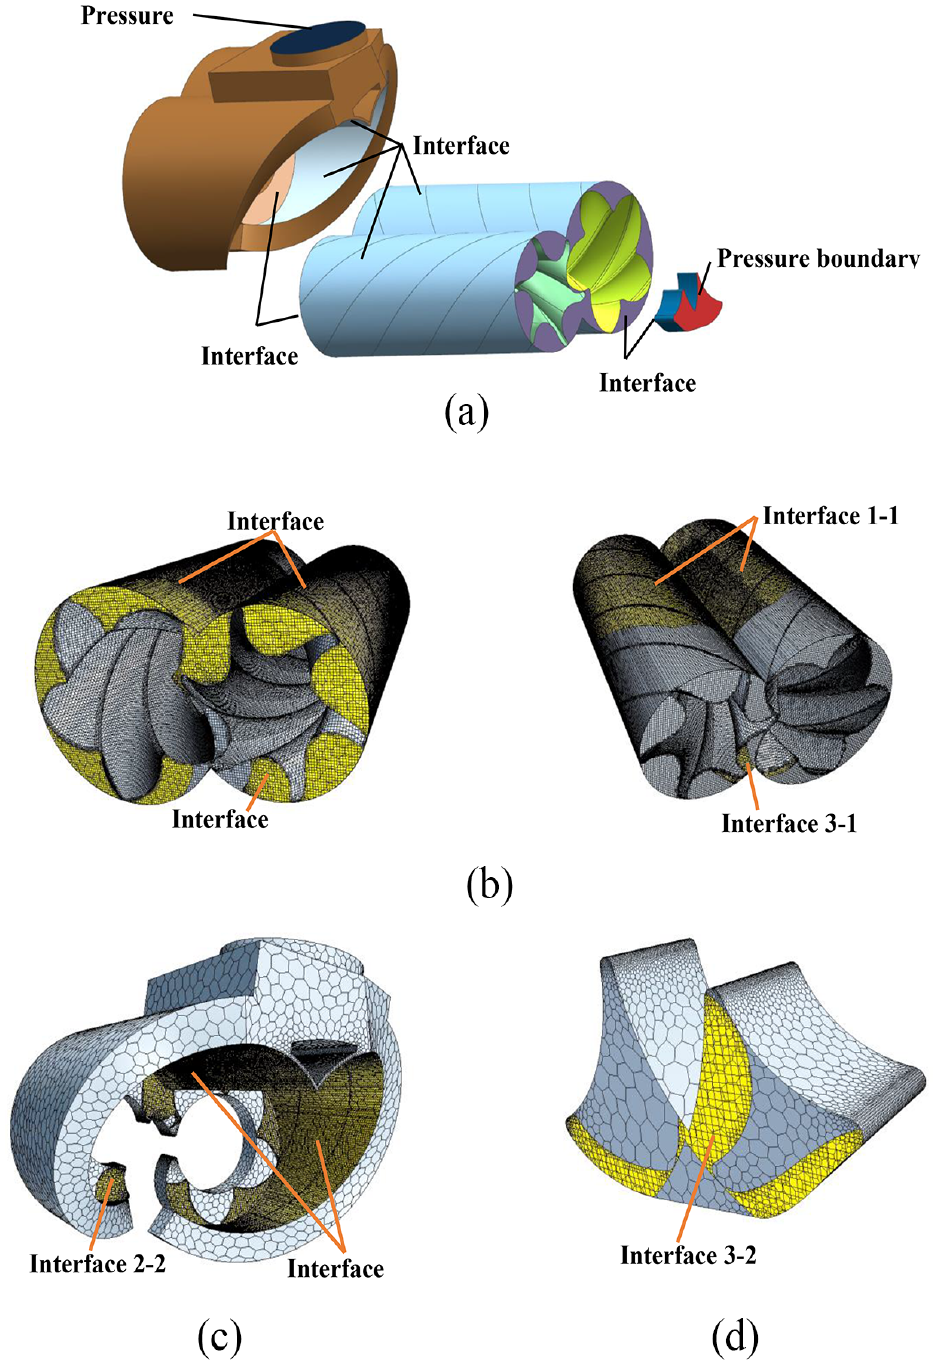
Diagram of the fluid domain boundary and pressure inlet and outlet positions and shapes: (a) the position of each interface and pressure boundary, (b) interface in the fluid domain of working cavity, (c) interface in the fluid domain of the inlet cavity, and (d) interface in the fluid domain of the exhaust cavity.
Reverse design of the screw rotor profile
Definition of the cubic B-spline curve segment meshing line
Figure 8 shows the cubic B-spline curve segment of a meshing line in the meshing line coordinate system, for which the parameter equation is obtained via derivative vector interpolation of predefined data points and two end points. In the diagram,
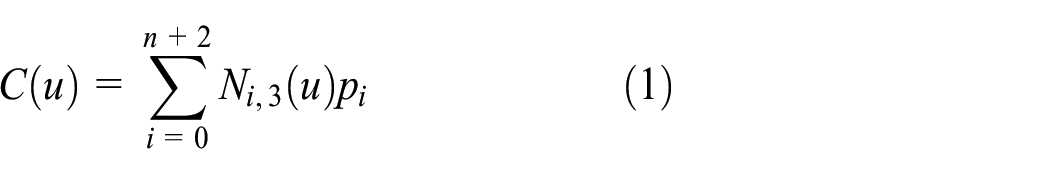

B-spline curve segment meshing line.
Derivation of the rotor profile from the B-spline curve
As data point

Then, meshing condition (3) in the reverse design process is converted to formula (4)

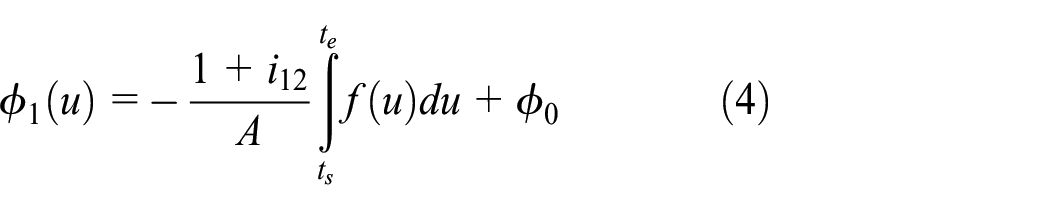
At this moment, the primitive function of integrand
When the meshing line passes through the
when

when

To summarize, the rotation angle parameter of each point in the meshing line is calculated, that is, a one-to-one mapping relationship between the male rotor rotation angle parameter and the spline curve parameter is created. Finally, the meshing condition formula, the formula for the conversion between female and male rotor rotational coordinate systems, and the meshing line static coordinate system are combined to obtain female and male rotor profiles based on the B-spline curve segment meshing line.
Effect of the meshing line on the rotor profile
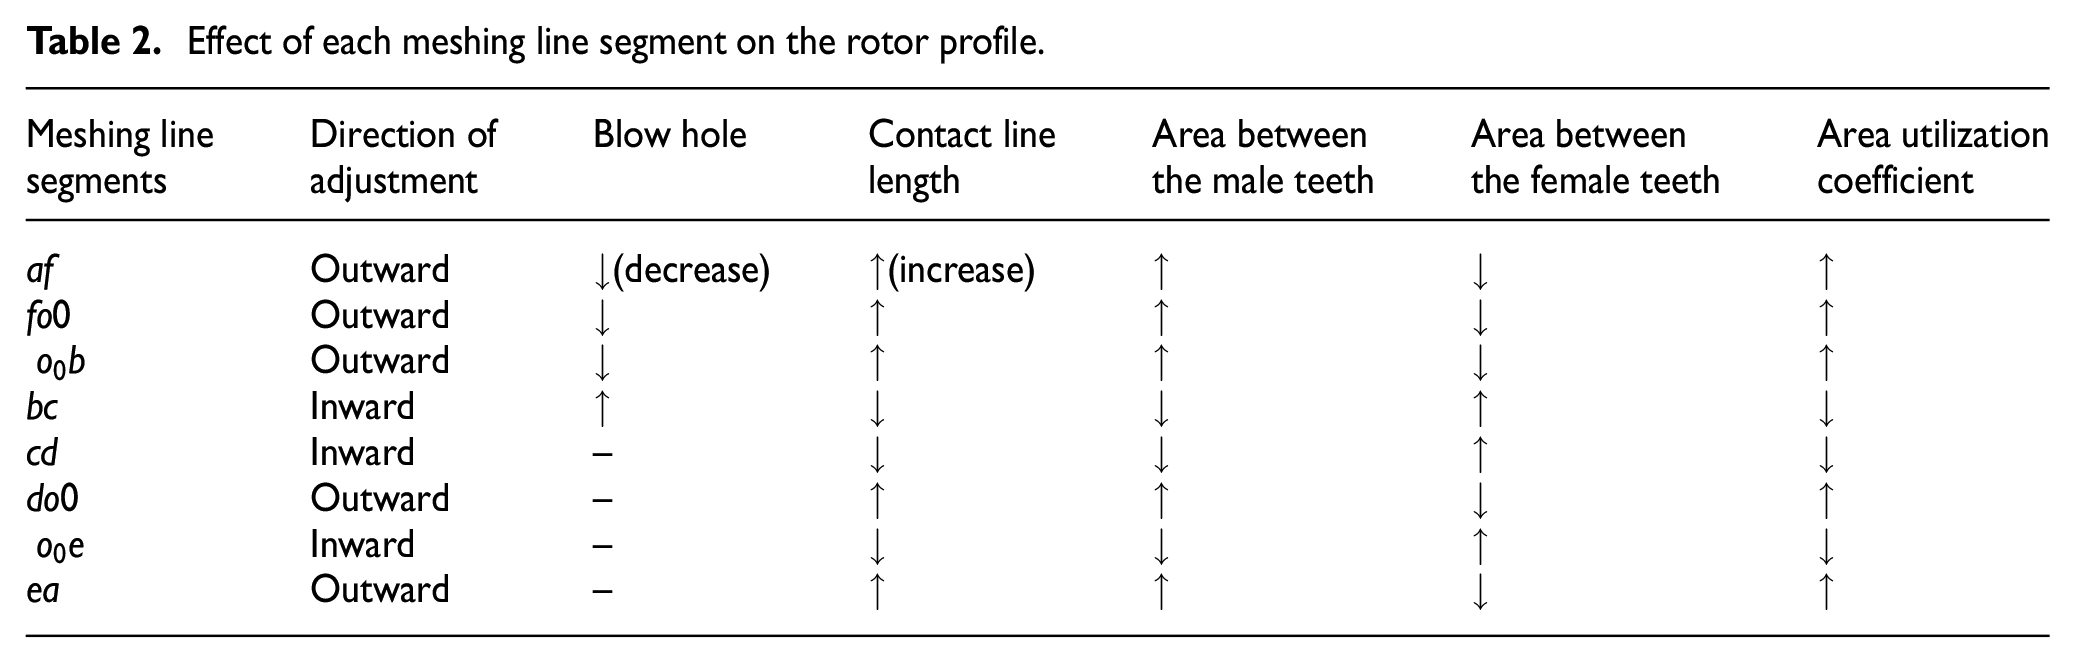
An analysis of an existing typical rotor profile and meshing line shows that the single edge profile meshing line exists only in the second and third quadrants of the meshing line static coordinate system, whereas the dual-edge profile meshing line is distributed in four quadrants. Figure 9(a) shows that the meshing line is divided into eight functional segments by six control points, a, b, c, d, e, and f plus the origin of the coordinate system. Among them, point a is the rightmost intersection point of the meshing line and the x0 axis; point b is the lowest point of the meshing line in quadrant

Meshing line segment and the corresponding rotor profile: (a) meshing line divided into 8 functional segments by 6 control points and (b) rotor tooth profile based on the meshing line.
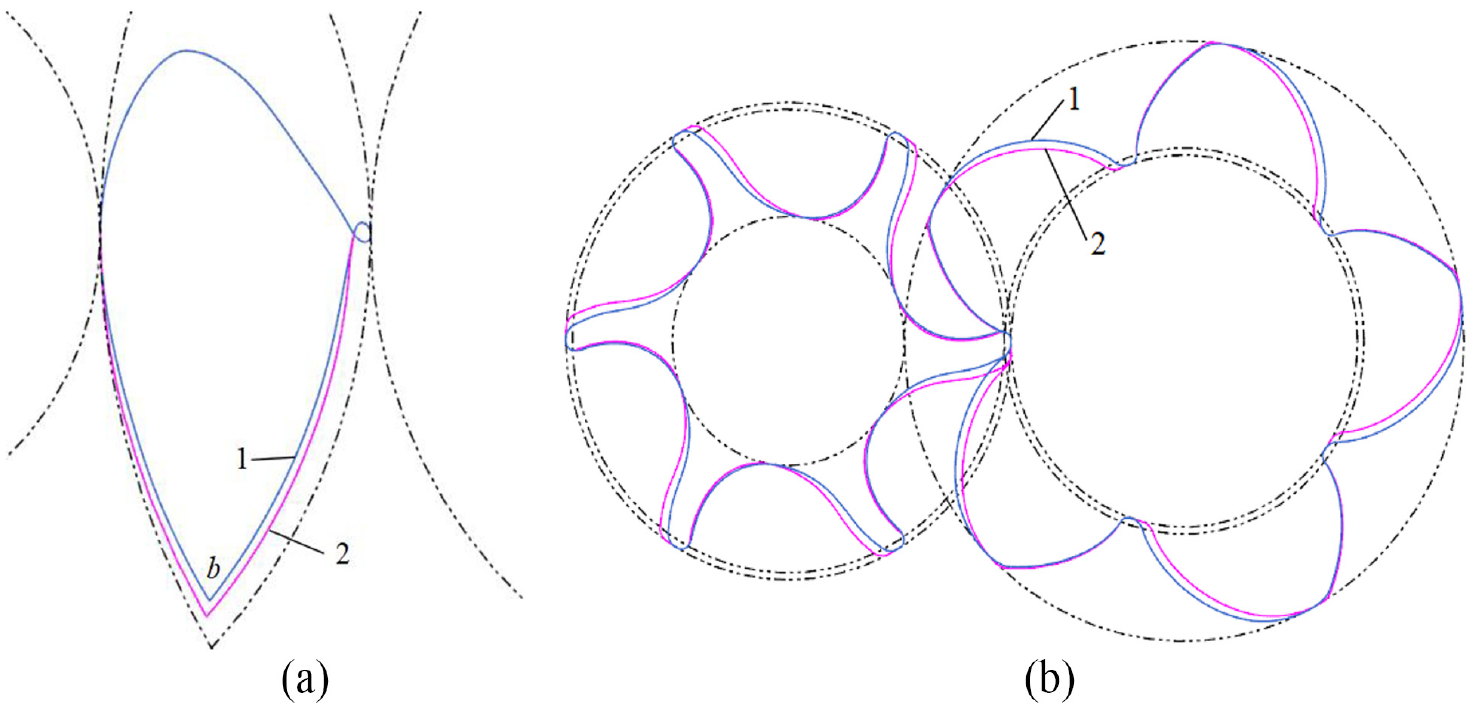
To investigate the effect of each segment of the meshing line on the rotor profile and performance parameter, the impact of each functional segment on the profile was investigated in the order of meshing line design a-f-O0-b-c-d-O0-e-a. All segments of the meshing line are based on cubic B-spline curve architecture, and a continuous tangent is guaranteed at the junction of adjacent meshing line segments. First, the effect of the af segment on the rotor profile was analyzed. Figure 10 shows the variation in meshing line shape and corresponding rotor tooth profile before and after af segment movement. In the diagram, other segments of the meshing line maintain the original shape; curve 1 shows the shape of the initial meshing line; curve 2 shows the meshing line after movement. Figure 10 shows that after the af segment of the meshing line moves toward the upper right, a high pressure profile near the female rotor addendum close to the interior wall of the case increases the addendum thickness. Furthermore, the curvature of this part of the tooth profile increases, and the area between teeth decreases. Similarly, when the af segment of the meshing line moves toward the upper right, a high pressure profile at the male rotor tooth slot base increases the tooth slot base width, and the corresponding male rotor tooth profile curvature increases. In addition, the area between teeth increases. Otherwise, if the af segment of the meshing line moves toward the bottom left, then the female and male rotor profiles evolve toward the opposite direction.

Variation in the meshing line and rotor tooth profile before and after af segment movement: (a) variation in the meshing line shape and (b) variation in the rotor tooth profile.
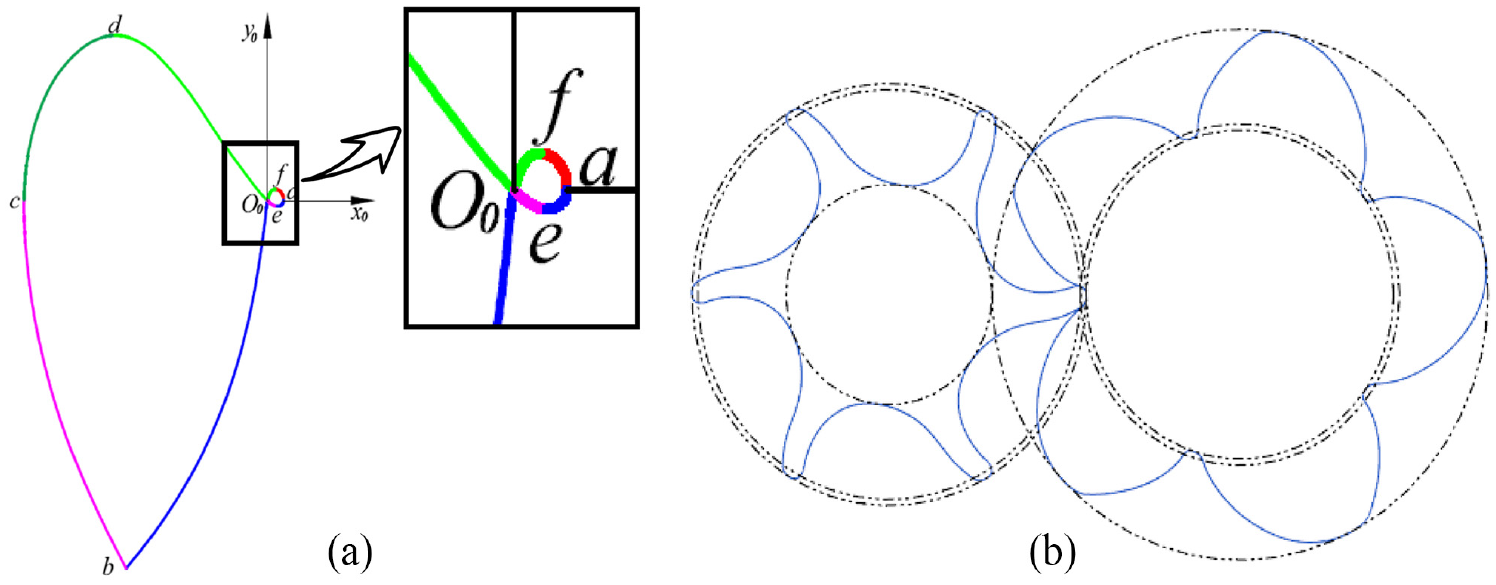
Similarly, seven other segments were investigated via the same method. If the trend of the enclosed area increases after the meshing line adjustment is defined as “outward,” then the opposite is defined as “inward.” Finally, the effects of each segment of the meshing line on the rotor profile performance parameters are listed in Table 2. Table 2 shows that the impact of each functional segment of the meshing line on the rotor profile is as follows: a change in the meshing line shape in quadrants
Effect of each meshing line segment on the rotor profile.
From the perspective of compressor rotor processing and operation, the rotor contact line length should be as short as possible, the leakage triangle should be as small as possible, the area between teeth should be as large as possible, and the closed volume should be as small as possible. However, as these factors interact with each other, the design value of each factor should be adjusted properly based on actual detailed requirements.
Example of the rotor profile reverse design
To prove the validity and reliability of the proposed reverse design of rotor profiles based on a B-spline curve, in this article, a screw air compressor produced by a Sino-German joint venture was used as the study subject; its rotor center-to-center spacing is H = 100 mm, transmission ratio is i = 5/6, and male rotor initial rotation angle is

Diagram of original product data: (a) rotor profile and (b) meshing line.
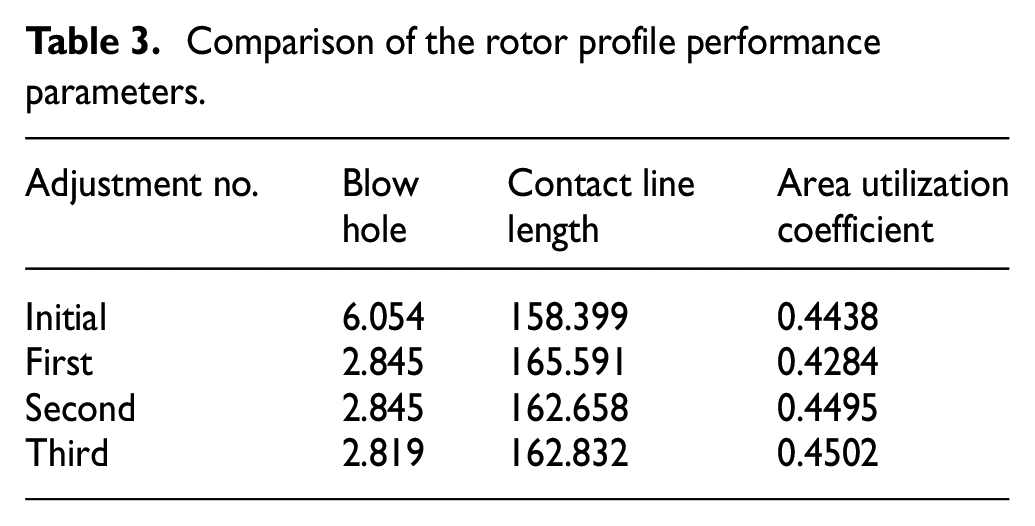
Based on the above meshing line data, the meshing line is divided into multiple functional segments. Based on an adaptive interpolation algorithm proposed in Ma, 16 the maximum error is defined, and the optimal control point is extracted. Meshing line data sufficiently close to the shape of this meshing line are obtained via cubic B-spline curve fitting. The architecture diagram is shown in Figure 12(a). The rotor profile is derived via the reverse design algorithm B-spline curve-based rotor profile proposed in this article, and the result is shown in Figure 12(b). A comparison of Figures 11(a) and 12(b) shows that the profile from the reverse design and the original profile are essentially consistent. In addition, the profiles corresponding to the meshing line segments are connected smoothly. Further analysis shows that the rotor profile from the reverse design satisfies the meshing transmission rule, and the transmission process has no interference. To reduce axial leakage through the leakage triangle, local adjustment is implemented based on the rules and the B-spline curve from the investigation above. The lowest point B of the meshing line moves toward the bottom right. The shapes of the meshing line and corresponding rotor profiles before and after adjustment are shown in Figure 13. This figure shows that although the leakage triangle area of the rotor profile decreases after adjustment, it also leads to a significant decline in the inter-teeth area utilization coefficient. To balance variations in the leakage triangle and area utilization coefficient, the cd segment moves toward the bottom right, and the de segment moves toward the bottom left. The meshing line after modification and the corresponding rotor profile are shown in Figure 14. To further improve the transmission performance of the transmission side profile, the OE segment moves toward the upper right, and the EA segment moves toward the top left. The meshing line and corresponding rotor profile before and after movement are shown in Figure 15. After adjustment, the rotor profile still satisfies the meshing transmission rule, and the transmission process has no interference. However, the overall performance improves significantly. Table 3 lists values of the rotor profile performance parameters before and after each adjustment.
Reverse design data: (a) meshing line and (b) rotor profile.
Comparison of the diagrams before and after the first adjustment: (a) meshing line and (b) rotor profile.

Comparison of the diagrams before and after the second adjustment: (a) meshing line and (b) rotor profile.

Comparison of the diagrams before and after the third adjustment: (a) meshing line and (b) rotor profile.
Comparison of the rotor profile performance parameters.
To summarize, the design example effectively proves that the algorithm proposed in this article is correct and reliable. A local curve can be adjusted to effectively change the profile structure parameters. As a leakage triangle, the contact line length and area utilization coefficient interact with each other; when adjusting the composite curve segment of the meshing line, changes in these items should be considered as a whole. The range in variation should be adjusted based on actual requirements. Furthermore, to ensure that the rotor profile generated from the meshing line is smooth and continuous, when meshing line is created, the continuity between meshing line segments should reach at least G1 continuity. For the lowest point b, the rotor processing performance and leakage triangle should be considered. In this article, the arc curve is selected for transition; however, the arc curvature radius should be minimized to avoid increasing the leakage triangle and horizontal gas leakage.
Numerical simulation of twin screw compressor operation
The twin screw compressor is a volumetric rotary gas compression machine. Compressed gas in an operational chamber rotates with two rotors, and the internal gas flow field is a typical three-dimensional unsteady flow field. In this article, the internal flow field of the compressor based on the rotor profile from a B-spline reverse design and internal flow field of a compressor based on the original profile are compared. The pattern of the internal flow field was analyzed via the new CFD analysis method proposed in this article to reveal the flow pattern of compressed gas in a case, providing reliable evidence for the feasibility of the reverse design of a B-spline-based rotor profile.
Pattern of the internal flow field under various pressures
To investigate compressor performance under various conditions, compressor internal flow fields under various discharge pressures and rotating speeds were simulated, and patterns of internal flow fields via old and new design methods were compared; this provides theoretical guidance for twin screw compressor design parameters and operational parameters. First, the suction pressure was fixed, the internal flow fields under conditions when the twin screw compressor rotor rotating speed is 2950 r/min and discharge pressures are 0.6 and 0.8 MPa were simulated to analyze the pressure distribution and fluid speed of the internal flow field. Figures 16 and 17 show the pressure distribution nephogram and velocity vector when the compressor discharge pressure is 0.6 MPa.

Pressure distribution when the discharge pressure is 0.6 MPa: (a) pressure nephogram of the rotor with the original profile and (b) pressure nephogram of the rotor with the new profile.

Fluid velocity when the discharge pressure is 0.6 MPa: (a) fluid nephogram of the rotor with the original profile and(b) fluid nephogram of the rotor with the new profile.
Figures 18 and 19 show the pressure distribution nephogram and velocity vector of a twin screw compressor when the discharge pressure is 0.8 MPa.
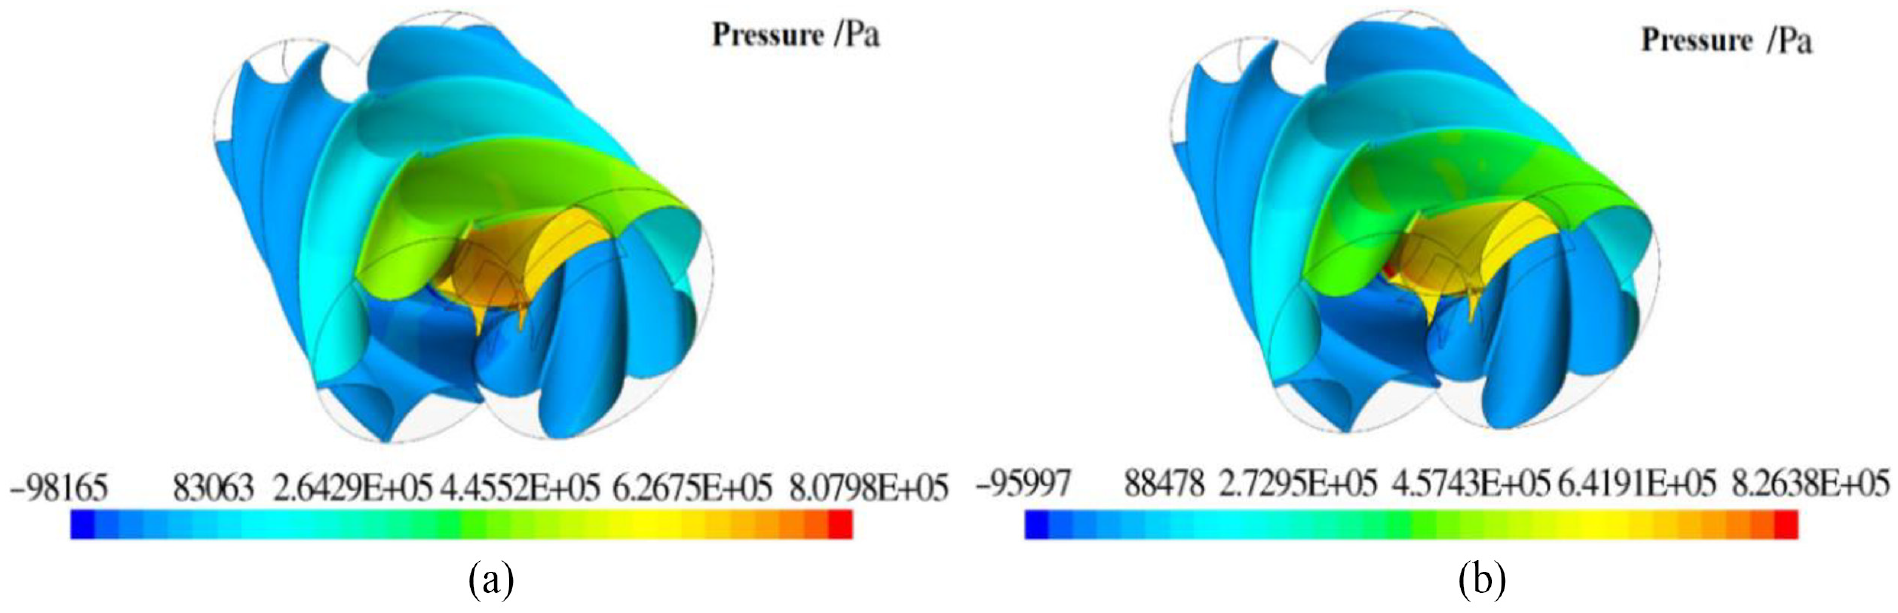
Pressure distribution when the discharge pressure is 0.8 MPa: (a) pressure nephogram of the rotor with the original profile and (b) pressure nephogram of the rotor with the new profile.

Fluid velocity when the discharge pressure is 0.8 MPa: (a) fluid nephogram of the rotor with the original profile and(b) fluid nephogram of the rotor with the new profile.
Figures 16 and 18 show that the pressure in the operational chamber in the discharge phase is essentially equal to the external discharge pressure, and the growth rate of the pressure between teeth at the high pressure side of the rotor based on a B-spline curve design along the axis from the air inlet to the air outlet significantly exceeds that of the compressor rotor based on the original profile design. This is because when the meshing line consists of free curves, a smooth connection of the tooth curve segments is guaranteed. The rotor rotation meshes between surfaces, which are more likely to form a line with good contact; this reduces the probability of high pressure gas leakage from the contact line to the suction chamber. This means that when a free curve is used as the rotor tooth curve for the profile design, the generated meshing line has better sealing performance. A comparison of Figures 17 and 19 shows that when the rotor rotating speed is fixed, the air flow speed increases with the rise in discharge pressure; the fluid velocity at the discharge end of the rotor based on the B-spline curve design exceeds the velocity at the discharge end of rotor based on the original profile design. This also means that the contact line generated by the new rotor profile has better sealing performance and effectively prevents leakage of high pressure fluid from the contact line to the low pressure side.
Patterns of internal flow fields under various speeds
When the discharge pressure is 0.8 MPa and the twin screw compressor male rotor rotating speeds are 2200 and 2950 r/min, the internal flow fields were simulated to obtain a pressure distribution nephogram and velocity vector of the internal flow fields, as shown in Figures 20 and 21.

Pressure distribution when the rotating speed is 2200 r/min: (a) pressure nephogram of the rotor with the original profile and (b) pressure nephogram of the rotor with the new profile.

Fluid velocity when the rotating speed is 2200 r/min: (a) fluid nephogram of the rotor with the original profile and(b) fluid nephogram of the rotor with the new profile.
A comparison of Figures 18–21 shows that when the discharge pressure is fixed, the flow speed near the addendum increases significantly with the increase in rotor rotating speed. This is mainly because the female and male rotor tooth surface line speed increases significantly when the rotor rotates. As the air enclosed in the chamber between teeth rotates with the rotor, the flow speed increases significantly. In addition, as the rotor rotating speed increases, the pressure in the operational chamber increases. This is mainly because under a high rotating speed, the leakage from the gap between the contact line and the addendum as well as the reflux from the discharge chamber to the operational chamber decrease.
The comparison above shows that the rotor based on the new profile has slightly better performance than the rotor based on the original profile. The meshing line segment based on the B-spline curve is adjusted continuously via reverse design to create a screw rotor with excellent performance. In actual operation, the compressor operation performance and processing performance should be fully considered, and the meshing line segment composition tooth curve should be improved continuously according to actual requirements to create a rotor profile with excellent performance.
Test verification
To verify the reliability and accuracy of the simulation results above, the performance indexes of a twin screw compressor under normal operation were tested and verified. In the test, the compressor operation conditions were consistent with the simulation boundary setting.
Test plan
During normal operation, the operational chamber of the twin screw compressor contains multiple identical primitive volumes comprising female and male rotor meshing teeth and an interior wall case. Each primitive volume follows an identical operational cycle consisting of suction, compression, and discharge. Therefore, measuring the pressure variation in operational chamber only requires the measurement of pressure variation in an inter-teeth volume. To completely measure the pattern of pressure variation in an inter-teeth volume versus the rotation of two rotors, the pressure sensor should rotate together with the rotor. Otherwise, the gas pressure variation pattern in a primitive volume in a complete operation cycle cannot be measured. Therefore, a pressure sensor was installed at the base of female rotor tooth slot. Figure 22 shows the test plan.
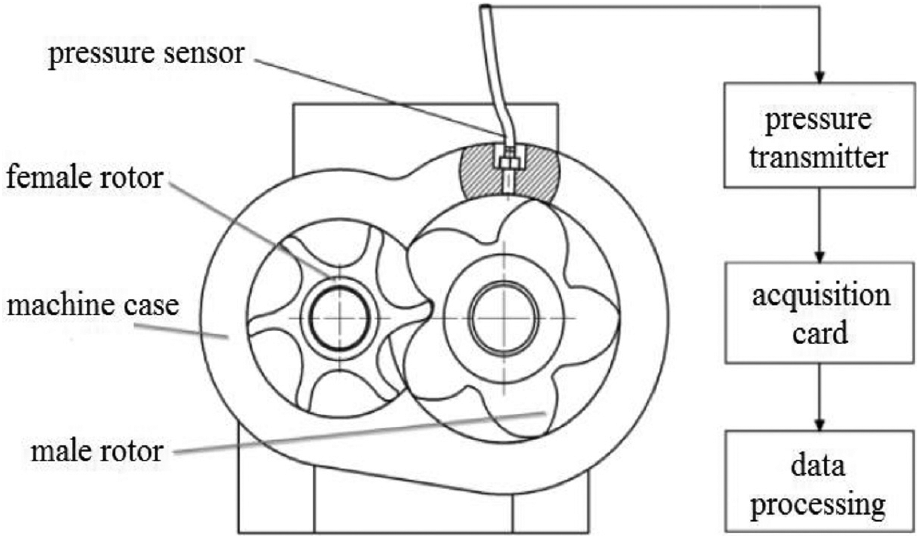
Twin screw compressor operational chamber pressure collection plan.
Before testing, the field ambient temperature and atmospheric pressure should be measured first. In addition, the assembly quality of the twin screw compressor modification should be inspected to ensure that the twin screw compressor can be tested successfully under normal conditions. Next, based on test conditions, the discharge pressure and motor rotating speed are adjusted. The internal pressure of the twin screw compressor in each condition is recorded. The pressure test site is shown in Figure 23.
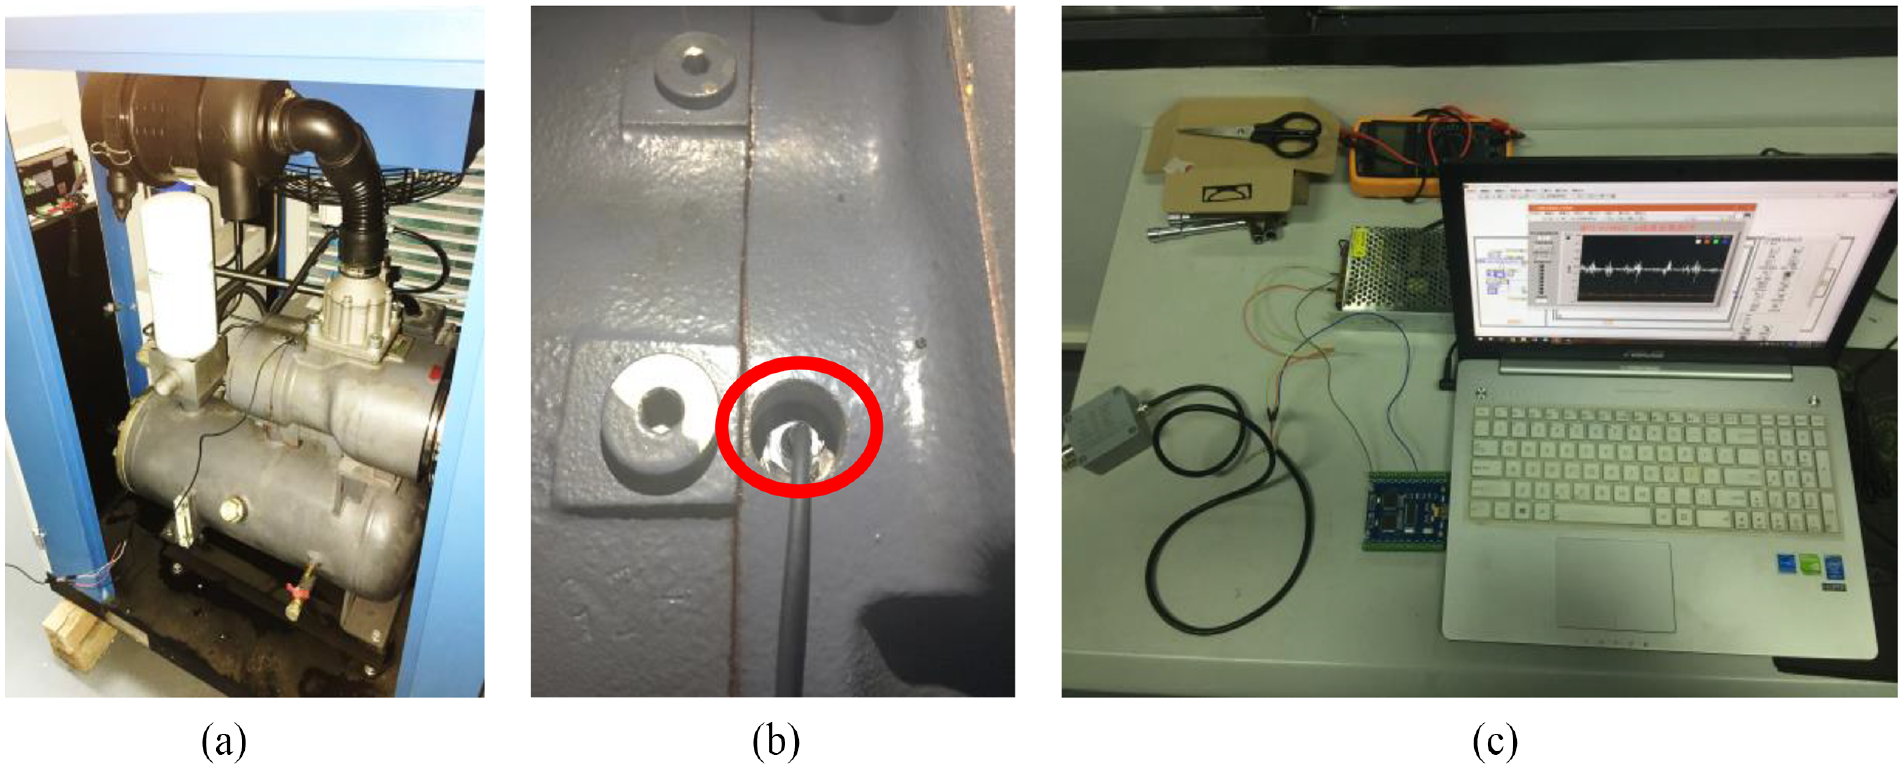
Pressure test site: (a) test equipment, (b) pressure sensor, and (c) data collection diagram.
Test results and analysis
Figure 24 shows the test results when the compressor rotating speed is 2950 r/min and the discharge pressure is 0.8 MPa.

Test measurement results.
Based on the relationship between male rotor rotation angle and time, the variation curve of the pressure in primitive volumes versus time at moments 6–17 in Figure 24 is converted to a variation pattern of pressure versus male rotor rotation angle. Then, based on the variation pattern of the primitive volume versus the male rotor rotation angle, the relationship curve of the pressure-versus-volume ratio is obtained. The test results and simulation results were compared for analysis, as shown in Figure 25. Despite different fluid simulation results and test measurement data, their trends are consistent. After the compression process starts, the pressure in the operational chamber rises rapidly until this primitive volume is connected to the gas outlet. Furthermore, the pressure fluctuates in the discharge phase. This means that the simulation results are reliable.

Comparison of the test measurement and simulation results.
Figure 26 shows a comparison of the test results and the simulation results for the compressor when the male rotor rotating speed is n = 2950 r/min and the discharge pressures are Pd = 0.8 MPa and Pd = 0.6 MPa. The diagram shows that under two different discharge pressures, the pressures at the initial stage of internal pressure are the same in a wide range. This is mainly because the operational chamber is far away from the blow hole, and the impact of discharge pressure on the pressure in the primitive volume is small during the initial stage of compression. When the operational chamber approaches the blow hole, the pressure in these operational chambers under high discharge pressure is lower than that under low discharge pressure. The main reason is that when internal pressure ratio rises, the gas leakage rate increases and the gas flow rate declines, leading to declining gas pressure in the operational chamber.

Comparison of the test and simulation results under various discharge pressures.
Figure 27 shows a comparison of the test results and simulation results for the compressor when the discharge pressure is Pd = 0.8 MPa and the male rotor rotating speeds are n = 2950 r/min and n = 2200 r/min. The diagram shows that as the rotor rotates faster, the gas pressure under high rotating speed exceeds the gas pressure under low rotating speed when other conditions are the same. This is mainly because the gas reflux from the discharge chamber to the operational chamber and the gas leakage via the gap between the contact line and addendum decrease as two rotors rotate faster.

Comparison of the test and simulation results under various rotating speeds.
To summarize, the test result data and simulation data are essentially consistent, effectively demonstrating the reliability of the simulation. This simulation result can be used as a reference for the operation state of actual twin screw compressors. Hence, simulation calculation replaces the method of developing a prototype for accurate measurement of actual operation performance parameters after each profile design, which significantly reduces the cost and cycle of designing twin screw compressors. This further proves the feasibility and superiority of B-spline curve-based screw rotor profile reverse design proposed in this article, which helps to expand the form of the rotor tooth curve and design rotor profile with excellent performance.
Conclusion
A hybrid method was employed to divide the surface grid of a twin screw compressor fluid domain model via ANSA and divide the body grid via STAR-CCM+. A CFD simulation for twin screw compressor was implemented by combining JAVA macro control in STAR-CCM+ with Morphing technology. The actual meshing gap between rotors and the gap between the rotor and cylinder interior wall are no larger than tens of micrometers, while model gap is magnified to a millimeter scale to draw a high-quality body grid in fluent dynamic grid computing. The new CFD computation method overcomes this limitation and reduces the gap in the fluid domain model for CFD computation to the millimeter or even zero scale, which effectively improves screw compressor simulation accuracy and the reliability of analysis results.
The B-spline curve was integrated into the composition curve of a rotor meshing line. Based on the effect of each functional segment of the meshing line on the rotor profile and performance parameters, fast local adjustment of rotor tooth profile was implemented, which helps to control the shape of the meshing line. Based on an existing rotor profile, a meshing line was designed based on the B-spline curve. Female and male rotor profiles were derived reversely. Fluid simulation for the final rotor profile under various conditions was performed via new CFD analysis method. The analysis of the internal flow field pattern shows that it has better gas compression performance than the original profile. The method of guiding the creation of rotor profiles from free curves based on simulation results effectively reduces the design cycle and improves the efficiency of profile design.
Footnotes
Handling Editor: James Baldwin
Declaration of conflicting interests
The author(s) declared no potential conflicts of interest with respect to the research, authorship, and/or publication of this article.
Funding
The author(s) disclosed receipt of the following financial support for the research, authorship, and/or publication of this article: This study was supported by grants from the National Natural Science Foundation of China (Grant Nos 51605193 and 51975251), the Natural Science Foundation of Jiangsu Province (Grant No. BK20160181), the Fundamental Research Funds for the Central Universities (Grant No. JUSRP11716), and the Open Research Fund of Jiangsu Key Laboratory of Advanced Food Manufacturing Equipment & Technology (Grant No. FM-201607).