
Abstract
Pipeline transportation is the major way to transport natural gas. How to reduce energy dissipation and retain the gas delivery capacity are the main problems of pipeline transportation. In this article, a new drag reduction agent named CPA is synthesized. An experimental investigation on the roughness-reducing effect of CPA on the inner surface of the pipeline is carried out. The effect of CPA on natural gas flow regime in the near-wall region of the pipeline is researched with Fluent software. Field tests for calculating the drag reduction rate of CPA are performed. The results show that CPA can reduce the roughness of the inner surface effectively, and the maximum roughness-reducing percentage is 38.74%. Meanwhile, CPA can reduce the frictional drag and thereby improve transportation capacity of pipelines. After injecting CPA, the streamline of the natural gas in the near-wall region is more consistent. The velocity fluctuation decreases by 93.2%. The mean turbulence intensity decreases by 53.01%. The pipeline pressure further decreases the roughness of the inner surface of the pipeline. The field test shows that the maximum drag reduction rate of CPA is 25%, and it is suitable for application in gathering and transportation pipelines of high flow velocity and turbulent rough region.
Introduction
As a kind of clean and efficient high-quality energy resource, natural gas is the first choice to improve energy structure and to protect environment worldwide. Pipeline is the major way to transport natural gas. National and transnational large-scale gas supply system of natural gas pipeline has been formed in North America, Europe, and Asia. However, the gas compressor station accounts for about 50% of total operation cost of transportation, and about 50%–70% of cost of gas compressor station is spent in the compressor set which is used to overcome the frictional resistance and keep the gas transmission volume. 1 The frictional resistance is the main reason of energy loss. How to reduce the frictional resistance and retain the gas delivery capacity are the main problems in the pipeline transportation.
One of the effective ways to reduce the frictional resistance is to inject drag reduction agent (DRA) into the pipeline, which was first studied by the American Petroleum Institute in 1956. 2 In the 1990s, efficiency of polyethylene oxide used for drag reduction in hydraulic capsule pipeline was measured, and the scheme of a test facility for studying polymer drag reduction was presented. 3 Then, basic structures of DRA molecule were proposed by Atlantic Richfield Company. 4 At the beginning of the 21st century, two types of drag-reducing mechanisms of DRA were proposed. One was drag reduction by the elastic membrane 5 which can absorb the turbulent kinetic energy (TKE) of the natural gas near the inner surface of the pipeline, subsequently release the TKE into natural gas, and reduce the degree of turbulence. 6 The other one can reduce the roughness of the pipeline, weaken the swirl strength caused by roughness, and also reduce the energy consumption. 7 The effect of DRA on annular gas liquid flow was researched in a horizontal 0.0953 m pipe, and the results indicated that the effectiveness of the DRA was sensitive to the method of injection and the concentration of polymer solution. 8 In 2010, a drag reduction equation of a three-parameter relationship between drag reduction and polymer concentration, which was the most useful equation for correlating drag reduction data, was proposed by CA Kim et al. 9 In recent years, effects of natural drag reduction of Basella alba L were tested using a transparent polyvinyl chloride closed loop fluid circulation system in a horizontal 1.5-in pipe. 10 The aforementioned research have promoted the development of gas drag reduction technology.
In order to further reduce the frictional resistance and improve gas delivery capacity, based on the aforementioned research, a new DRA named carboxylate polymer agent (CPA) was synthesized, and the effects of CPA on roughness of the inner surface of the pipeline, natural gas flow regime in the near-wall region, and drag reduction of natural gas pipeline transportation are researched in this article.
The new DRA—CPA
The new DRA, called CPA, is an organic carboxylate polymer generated by the chemical reaction of secondary amine, morphine, acetaldehyde, and succinic acid. As shown in Figure 1, R1 and R2 of the molecular chain are alkyl. Each alkyl has more than three carbon atoms. They have multipolar terminals, and they can closely combine with metallic iron. Besides, it is easy to dissolve in the familiar organic solvent of oil, alcohol, acetone, or toluene.

Ball-stick model and charge distribution model of CPA.
The physical parameters of CPA are measured by the YP1002N electronic balance, NDJ-5s digital viscometer, DP-610 pen type tester, and so on (Table 1).
Physical parameters of CPA.

Effect of CPA on roughness of the inner surface of the pipeline
Drag-reducing effect of CPA is related to the degree of influence on the roughness of the pipeline wall. The lower the roughness of the pipeline wall, the better the drag-reducing effect. To analyze the roughness-reducing effect of CPA on the inner surface of the pipeline, the experiments related to roughness test and electron microscope analysis 11 are carried out as follows.
Materials and equipment
The main materials and equipment used in the experimental investigation are as follows: test specimens taken from the pipeline in the Changqing Oil Field in China, TR100 Roughness tester (Beijing, China), FEI Quanta450 Environmental Scanning Electron Microscope (Hillsboro, OR, USA), and CPA.
Experimental process
The experimental investigation is concerned with how CPA affects the roughness and microtopography of the inner surface of the pipeline. A summary of the test process is as follows.
Use the TR100 Roughness tester to test the mean roughness of the untreated specimens.
Use abrasive cloth to remove the rust of the inner surface of the specimens. Then, clean these specimens by water and ethanol. We refer to the specimens at this case as “the cleaned specimens,” and then, the mean roughness of the cleaned specimens is measured by the TR100 Roughness tester.
Ten kinds of DRA solutions are prepared by dissolving CPA into ethanol solvent with concentrations of 200, 400, 600, 800, and 1000 ppm, respectively.
The inner surface of the cleaned specimens is sprayed with different concentrations of CPA solution as shown in Figure 2. Let these specimens dry naturally for 2 days at room temperature, which is about 20°C–25°C. We refer to these specimens as “film-forming specimens.”
The roughness of the film-forming specimens is measured by the TR100 Roughness tester.
The microstructure of the inner surface of the untreated and film-forming specimens is examined by the FEI Quanta 450 ESEM.

Film-forming specimens with different CPA solution concentrations.
Experimental results and analysis
Roughness data and analysis
The result of the roughness of inner surfaces of specimens is listed in Table 2:
CPA can reduce the roughness of the inner surface of the pipeline effectively. Compared with the roughness of untreated and the cleaned specimens, the mean roughness-reducing percentage (RRP) of film-forming specimens with CPA is 90.91% and 29.26%, respectively.
The concentration of CPA has a suitable value. The roughness of the film-forming specimens decrease first and increase later with the increase in CPA concentration. The best value of CPA concentration is 600 ppm with the maximum RRP of 38.74%.
The roughness of different specimens with different concentrations of CPA.

Microstructures of inner surfaces of different specimens
The microstructures of the surface of the untreated and film-forming specimens are observed by an environmental scanning electron microscope (ESEM). In Figure 3(a) and (b), the microstructures of the inner surface of untreated specimens consist of heterogeneous particles, holes, and gullies. The asperity of the surface is large and irregular. After applying with 600 ppm CPA, as shown in Figure 3(c), CPA not only fills the holes and gullies of the inner surface but also renders the inner surface dense, smooth, and uniform. It can be seen from Figure 3(d) that CPA can form a “continuous layer” on the inner surface and render the surface smooth. The height and width of the asperities of the inner surface of film-forming specimens have decreased. The shapes of the asperities are turned into cone as shown in the circles of Figure 3(d).

The results of the experimental investigation for the roughness-reducing effect of DRAs on the inner surface of the pipeline: (a) the microstructure of the inner surface (MIS) of untreated specimens, magnified 5000×, from the front view. (b) MIS of untreated specimens, magnified 5000×, from the side view. (c) MIS of film-forming specimens, magnified 5000×, from the front view. (d) MIS of film-forming specimens, magnified 5000×, from the side view.
Effect of CPA on natural gas flow regime in the near-wall region of pipeline
In this section, to analyze the micro drag-reducing effect of CPA, micro 3D models of the inner surface of the pipeline are constructed based on the probability theory and the test results of roughness and microstructures of the inner surface of the pipeline. Then, the natural gas flow regimes before and after injecting CPA are analyzed by Fluent software. 12
Construction of micro 3D simulation models of the inner surface
Physical model building
According to the aforementioned experiments, the diameter of the pipe is at least 1000 times the average height of the asperity, and the size of the simulation model is of the micron scale. At this scale, it is reasonable to simply model the inner surface of the pipeline as a plane rather than a curve surface.
According to the basic theory of friction and wear,13,14 the asperity height distribution is close to a normal distribution; the smaller the roughness, the closer the actual distribution approximates the normal distribution. The standard deviation of asperity height is given in equation (1). The probability density function (PDF) of asperity height is provided in equation (2)
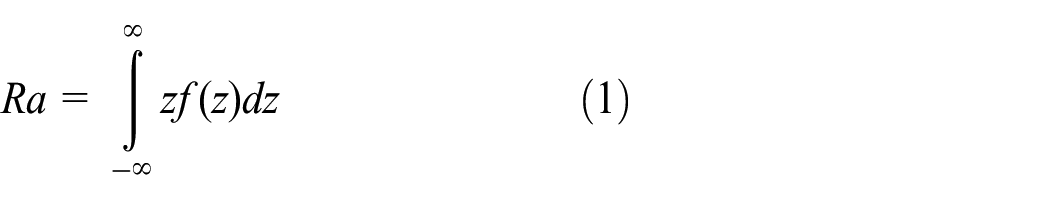

where Ra is the mean value of asperity height and z is the height of asperity.
According to Table 2, the Ra of asperity height of the untreated specimens and the film-forming specimens with 600 ppm CPA are 39.95 and 3.10 μm, respectively. Besides, the standard deviation of asperity height can be seen as “1.25 × Ra” according to the tribology theory. 15 Then, the asperity height of the untreated and film-forming specimens approximately obeys the normal distribution N1 (39.95, 49.942) and N2 (3.10, 3.882), respectively.
Take the roughness heights of untreated specimens as an example. The 100 height values which follow the distribution N1 are generated by MATLAB16,17 software. As shown in Figure 4, the 100 asperity heights are divided into 15 intervals. These 100 heights can be approximately expressed as the center values of the 15 intervals and the frequency of center values, as shown in Table 3.

PDF of the asperity height of untreated specimens.
The asperity height and its occurrence frequency of the untreated specimens.

In Table 3, the 15 heights and their frequency obey the normal distribution N′ (39.9623, 48.89022). The related errors of N′ to N1 are 0.031% (mean value) and 2.10% (standard deviation). So the data in Table 2 can be used as a unit to express the asperity heights of the untreated specimens.
Typically, the shape of asperity can be divided into spherical, cylindrical, and conical models. The spherical model is easy to be described mathematically because the contact stress peak does not appear. The structure of the cylindrical model is simple and easy to build. The conical model is the closest model to the real situation. To build as accurate a model as possible, the asperity model is simplified as the conical model by smoothing the top and bottom of the cone. With the Pro ENGINEER software, 18 the 15 asperity models are constructed as shown in Figure 5.

15 asperity models on the untreated surface of specimens.
Then, the unit consisting of the 15 different types (Figure 3) of asperities can be constructed by random organizing. The unit has 100 asperity models as shown in Figure 6.

The unit with the 100 asperity models.
Combining 10 units, the 3D micromodel of the inner surface of untreated specimens, which has 1000 asperities, is constructed as shown in Figure 7.
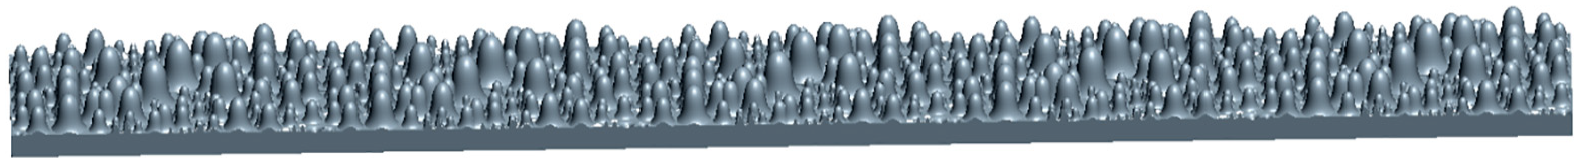
3D micromodel of the inner surface of the untreated specimens.
The final physical model of untreated specimens, which represent the microscopic simulation model (MSM) of the original pipeline, is shown in Figure 8. The final physical model of the film-forming specimens, which represents the MSM of the injecting CPA pipeline, can be obtained by the same modeling approach as shown in Figure 9.
The microscopic simulation model of untreated specimens.

The microscopic simulation model of film-forming specimens.
Mathematical model
Fluid motion needs to follow the conservation law. The basic conservation law includes the law of conservation of mass, the momentum conservation law, and the energy conservation law. Besides, the system of the fluid motion must follow the component conservation law if the fluid has different components. There are also turbulent transport equations that need to be followed if the fluid motion is in the turbulent state.19,20
In this article, the fluid motion is only single-phase flow, and the heat exchange and temperature variations are not considered. Therefore, the conservation equations of energy and component are excluded. The flowing state of natural gas can be described as the following equations.
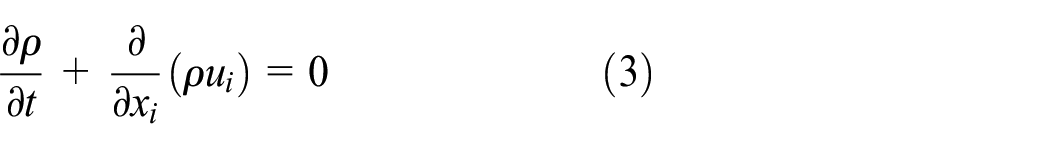
Mass conservation equation 21
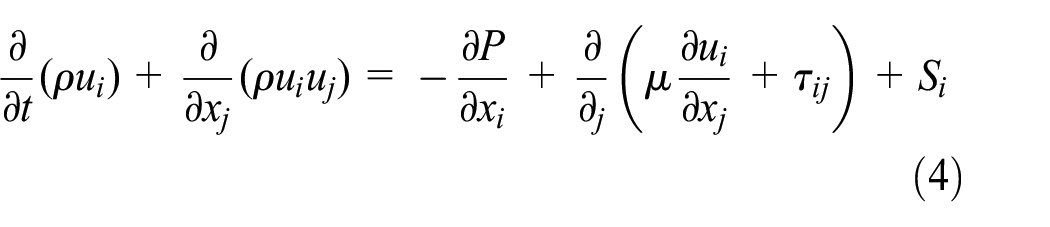
Momentum conservation equation
Transport equation of TKE, k

Transport equation of turbulent dissipation, 22 ε

In equations (7)–(10), ρ is the density of natural gas; t represents time; u is the velocity vector; x is the direction vector; P is the pressure on the microunit of natural gas; τij is the Reynolds stress tensor; Si is the body force of microunit; μ is the fluent dynamic viscosity; μt is the turbulent viscosity; Gk is the generation item of TKE k caused by mean velocity gradient; Gb is the generation item of TKE k caused by buoyancy force; and YM represents the contribution of pulse expansion in compressible turbulent flow. C1ε, C2ε, C3ε are the empirical constants; σk and σε are Prandtl number of TKE k and turbulent dissipation ε, respectively.
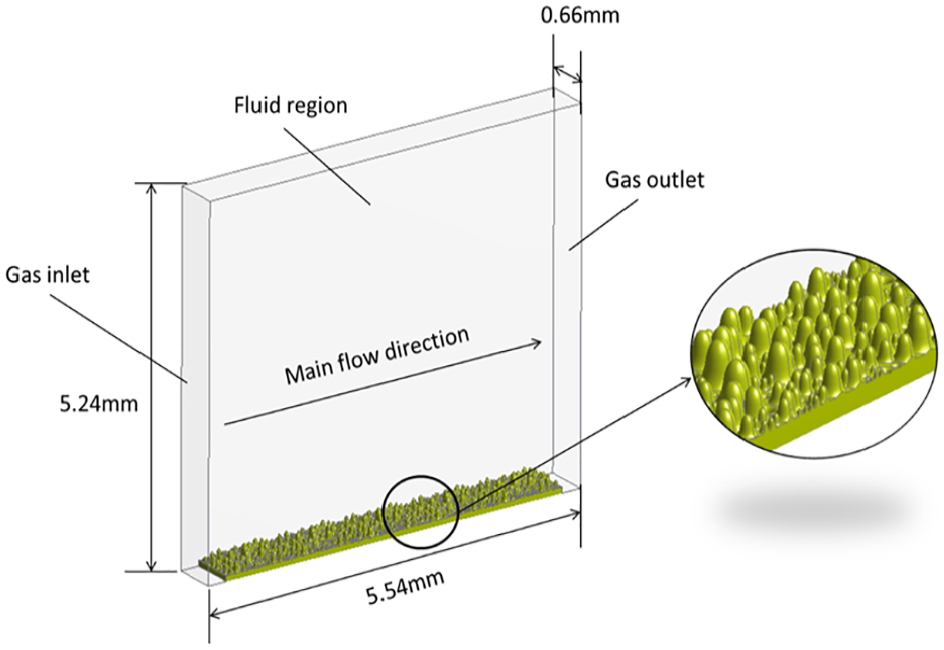
Simulation model settings
Import the aforementioned model into Fluent software in Workbench 23 (ANSYS Company; Pittsburgh, PA, USA). Then, define the mesh division, set boundary conditions, and run simulations, all of which are performed within Workbench. The calculation domain of fluid is meshed by tetrahedral grid (Figure 10). The number of grids of the original pipeline and the injecting CPA pipeline is 5, 253, 498 and 2, 571, 897, respectively. “Velocity-inlet” is selected as the inlet boundary condition, and the velocity is set to 5 m/s. “Pressure-outlet” is selected as the outlet boundary condition. The wall boundary condition is set to “wall,” and the shear condition is set to “no slip.”

Meshing of the fluid domain.
Flow regime analysis and discussions
Streamline
Figure 11(a) shows that most of the streamlines in the original pipeline present obvious irregular curves. Most streamlines near the asperities span back and forth between the asperity region and the upper part of the asperity region. The direction of streamline does not always parallel to the main flow direction. This motion will dissipate a part of gas transport energy. After applying CPA, the streamline presents more regular and linear state as shown in Figure 11(b). Also, almost all the streamlines’ direction is parallel to the main flow direction.

Status of streamline: (a) the original pipeline and (b) the injecting CPA pipeline.
Velocity vector and turbulence intensity
The circles in Figure 12(a) show that there is a velocity saltation at the top of the asperities in the original pipeline because the fluid needs more transport space when encountering asperities. The velocity saltation disappears in the injecting CPA pipeline, and the velocity basically remains constant as shown in Figure 12(b).

The results of simulations: (a) velocity contour for the original pipeline, (b) velocity contour for the injecting CPA pipeline, (c) partial velocity vector in the original pipeline, (d) partial velocity vector in the injecting CPA pipeline, (e) velocity fluctuation, and (f) turbulence intensity distribution.
The velocity vector in the original pipeline is disorderly, as illustrated in Figure 12(c). The circles are defined as vortexes. These phenomena will lead to large energy consumption near the inner surfaces. The vortex is drastically and obviously reduced after the injection of CPA in Figure 12(d). The ability for flow and transport is enhanced because the direction of the velocity vectors is more consistent.
Furthermore, as shown in Figure 12(e), the velocity exceeds the initial velocity of 5 m/s in the original pipeline, and the maximum velocity is 8.84 m/s (the red curve). But it does not mean that the pipeline transportation capacity is increased. In fact, the velocity suddenly drops below 5 m/s when the natural gas is transported 4.1 mm. The standard deviation of velocity is 0.8658, and the large velocity fluctuation will cause large frictional drag. In long-distance transport, there will be a great energy consumption and it further causes the decline of velocity. After injecting DRA, the velocity gradient becomes small, and the standard deviation of velocity is only 0.0589 which has decreased by 93.2% compared with the velocity fluctuation in the original pipeline. This greatly reduces the resistance of natural gas transmission.
In Figure 12(f), the turbulence intensity reaches 0.8755, and it has a large range of fluctuations in the original pipeline. After injecting CPA, the mean turbulence intensity decreases by 53.01%. This indicates that CPA can reduce the friction drag of the boundary layer and thereby reduce energy consumption.
Effect of natural gas on the CPA film
As shown in Figure 13, the deformation of the CPA film is small at the bottom of asperities and large at the top of asperities. This illustrates that the pressure of the natural gas further drives the CPA film becomes smooth and flat and further decreases the roughness of the inner surface of the pipeline.

Deformation of the CPA at the bottom of asperities (area in yellow circle) and at the top of asperities (area in red circle).
Drag-reducing effect of CPA in field tests
Field test method
A field test for CPA was carried out in the Shanxi–Beijing pipeline in China. The coverage area was from Fugu to Daheizhuang, and the total distance was 86.1 km as shown in Figure 14(a). The purpose of the test was to test the application effect of CPA on the long-distance pipeline. The performance parameters such as drag reduction rate, effective duration, friction coefficient were tested. In order to let the CPA cover the inner surface of the pipeline tightly, the pigging operation was performed 4 days before the CPA injection. The total injection time was 43 h. The total injection dosage was 3.3 m3. The pipeline pressure was 5 MPa when CPA was injected. The velocity of the injection of CPA was 76 L/h. Figure 14(b) presents the CPA injecting process. Figure 14(c) shows the CPA packaging barrel and injection equipment, and there were at least two people to monitor the injecting process.
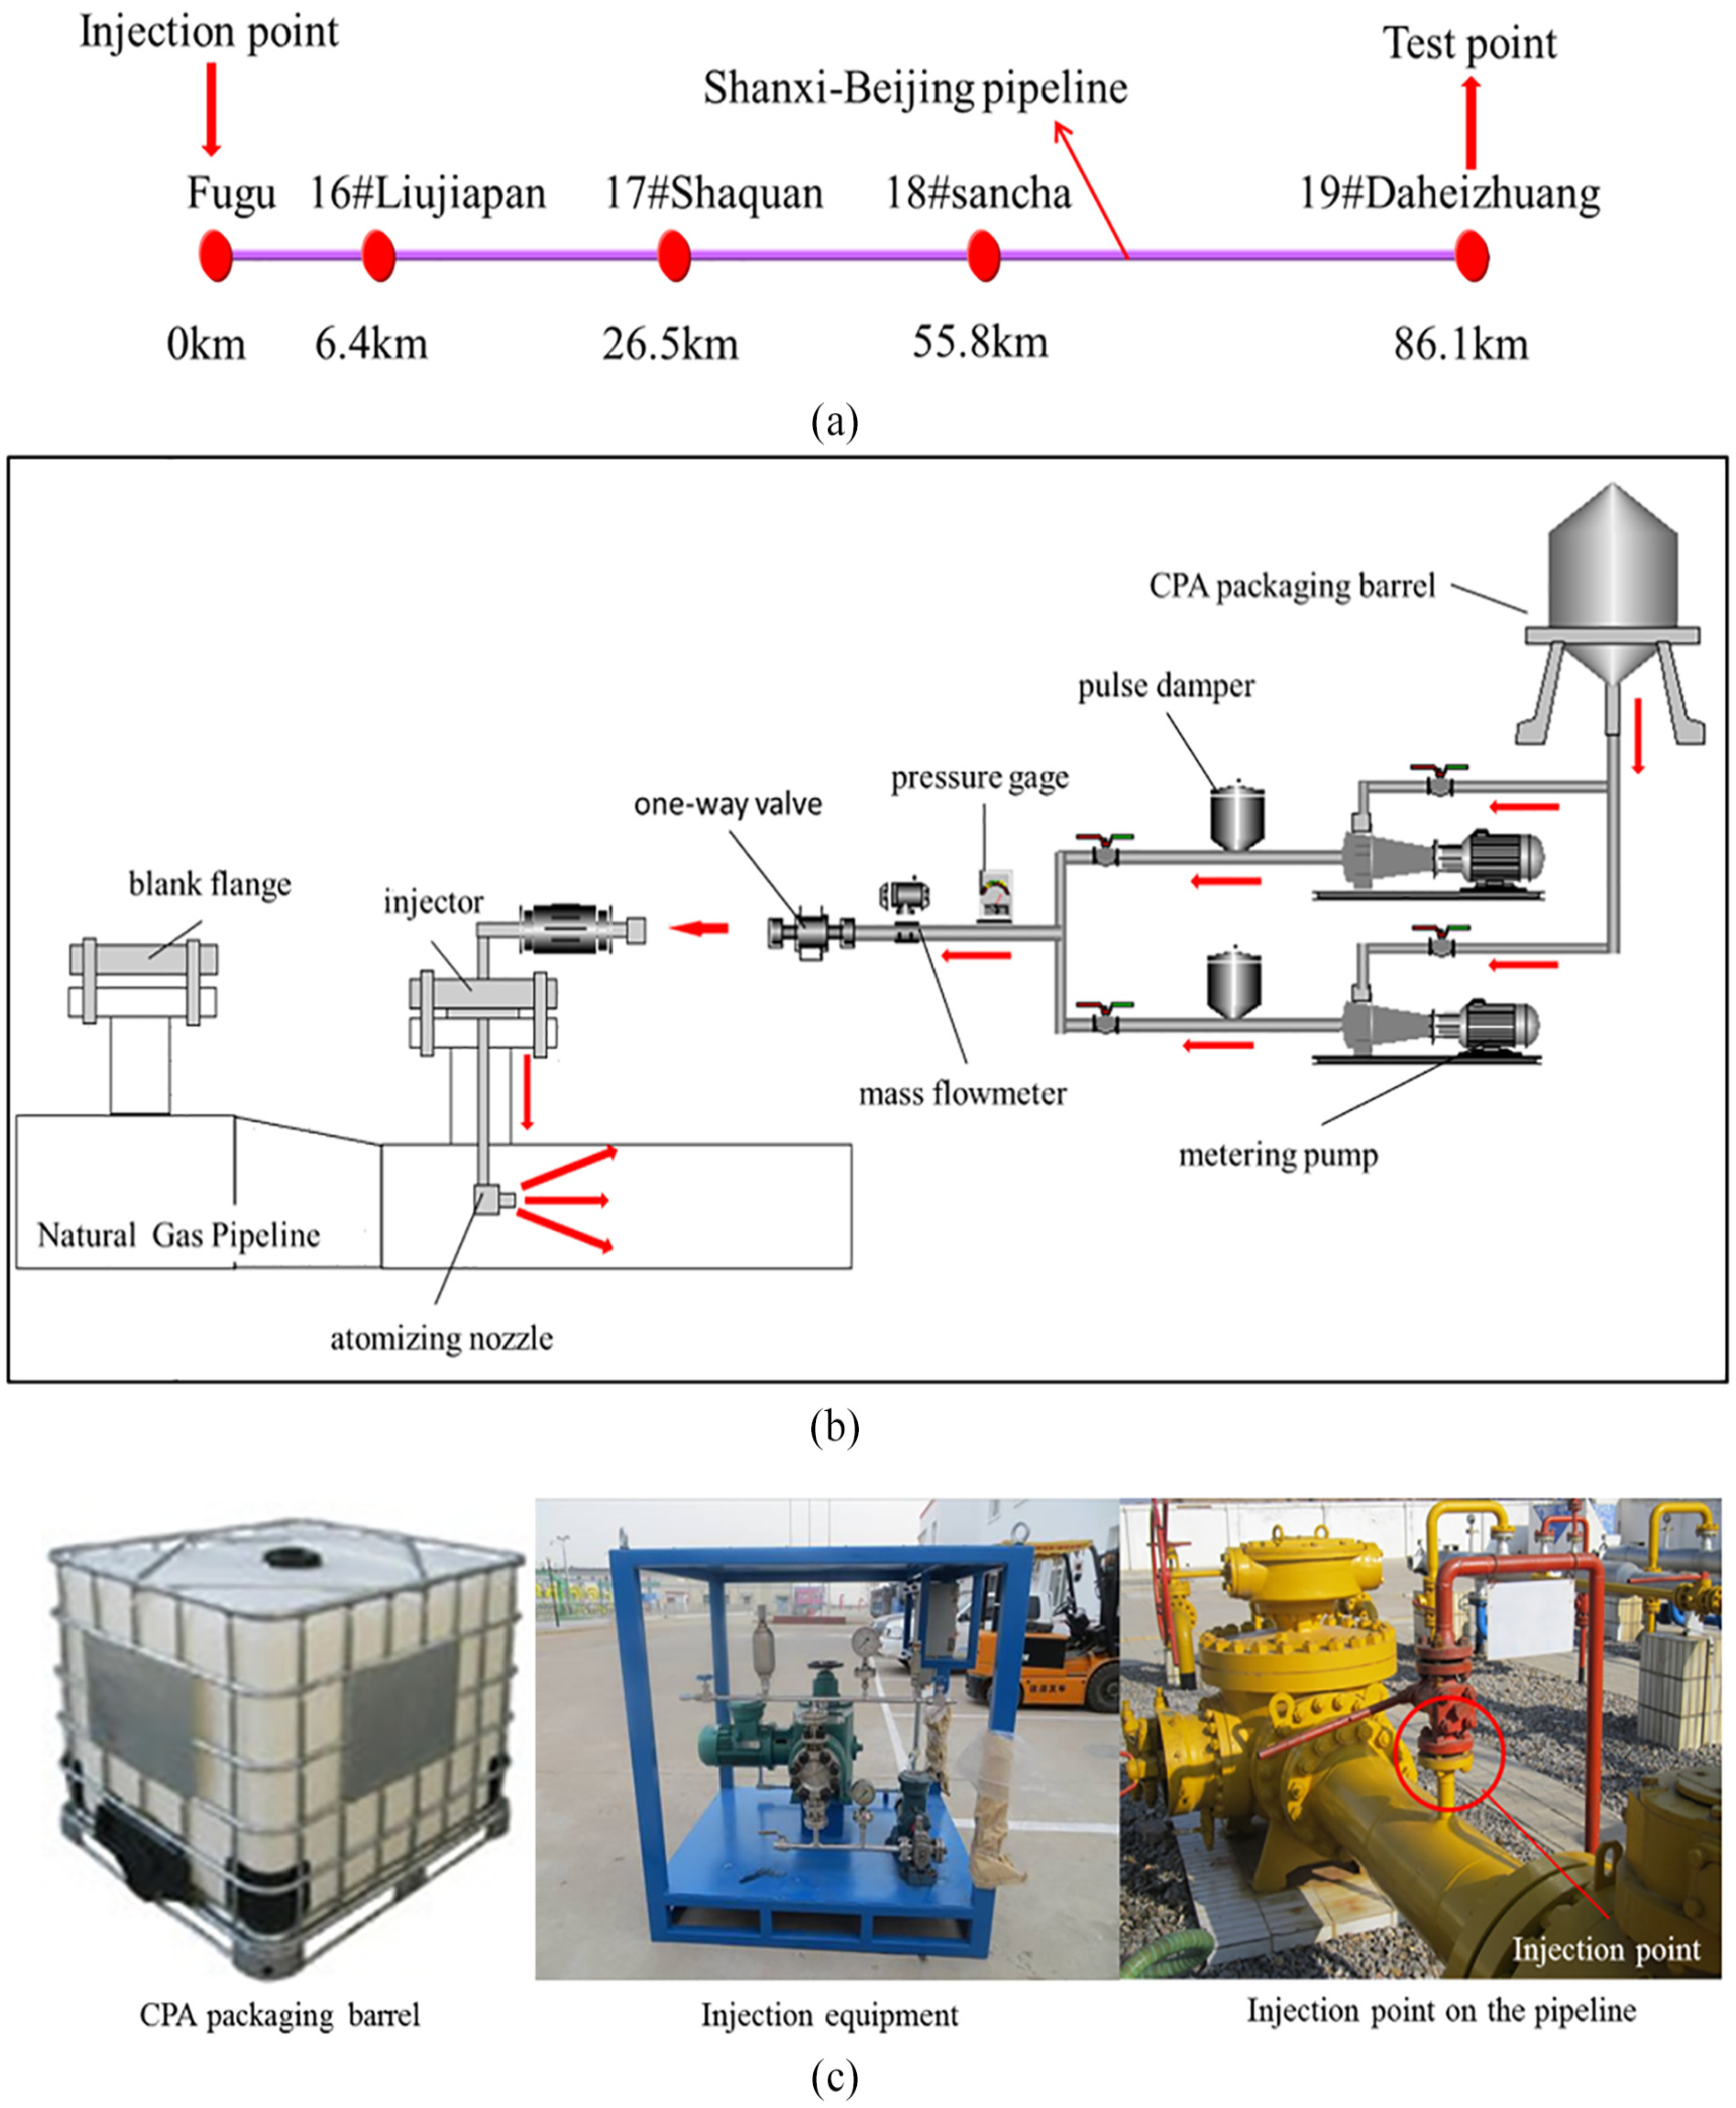
The field test of CPA: (a) coverage distance of CPA, (b) CPA injecting process, and (c) CPA packaging barrel and injection equipment.
Analysis of field test result
The hydraulic friction coefficient and drag reduction rate can be calculated according to the discharge pressure of Fugu station, the inlet pressure of Daheizhuang station, and the volume of natural gas transmission.
Figure 15(a) and (b) shows that after the injection of CPA, when the gas transmission volume is higher than 500 × 104 m3/d, the drag reduction rate can reach 10% and keep this value for more than 1 month. In the second month, it still has the drag-reducing effect, and the effect of CPA on the pipeline and equipment is very small. However, the CPA cannot reduce the transport resistance when the actual volume of natural gas transmission is small.
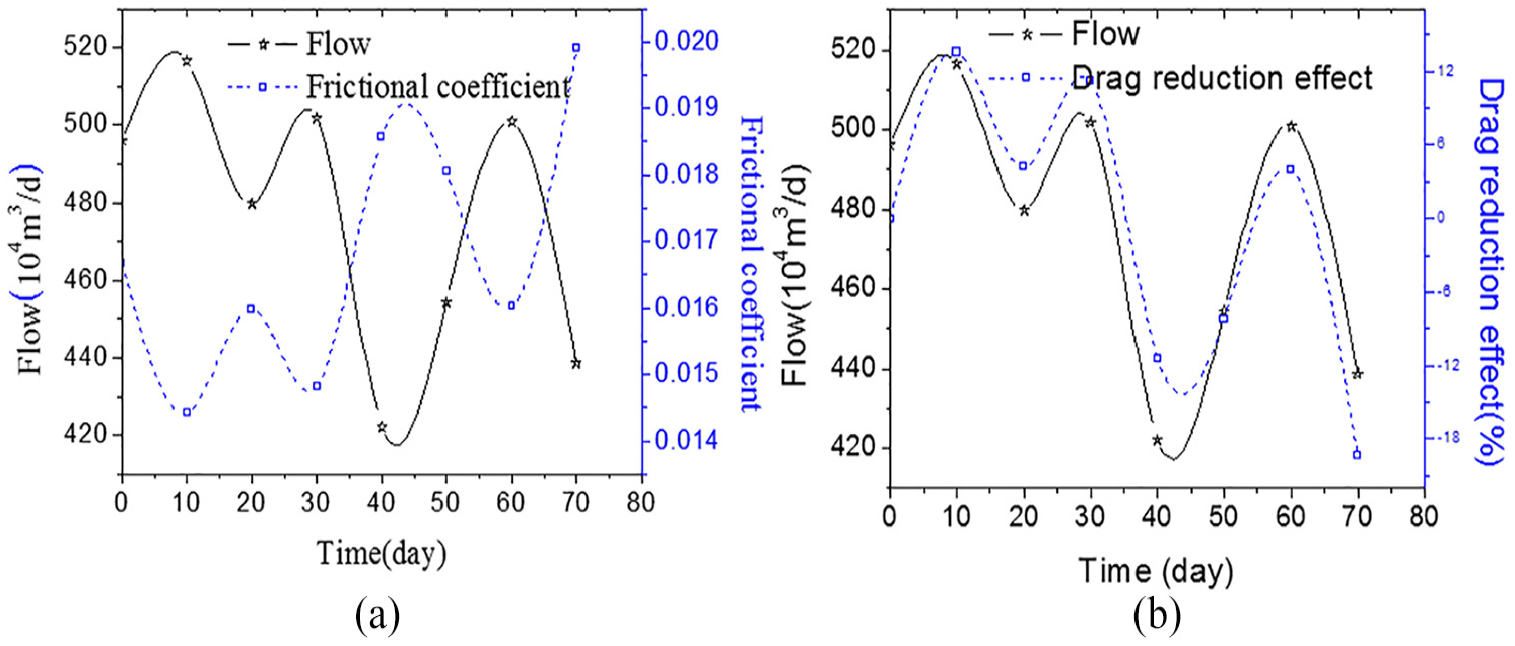
The application effect of CPA on the pipeline: (a) flow and frictional coefficient and (b) drag-reducing effect.
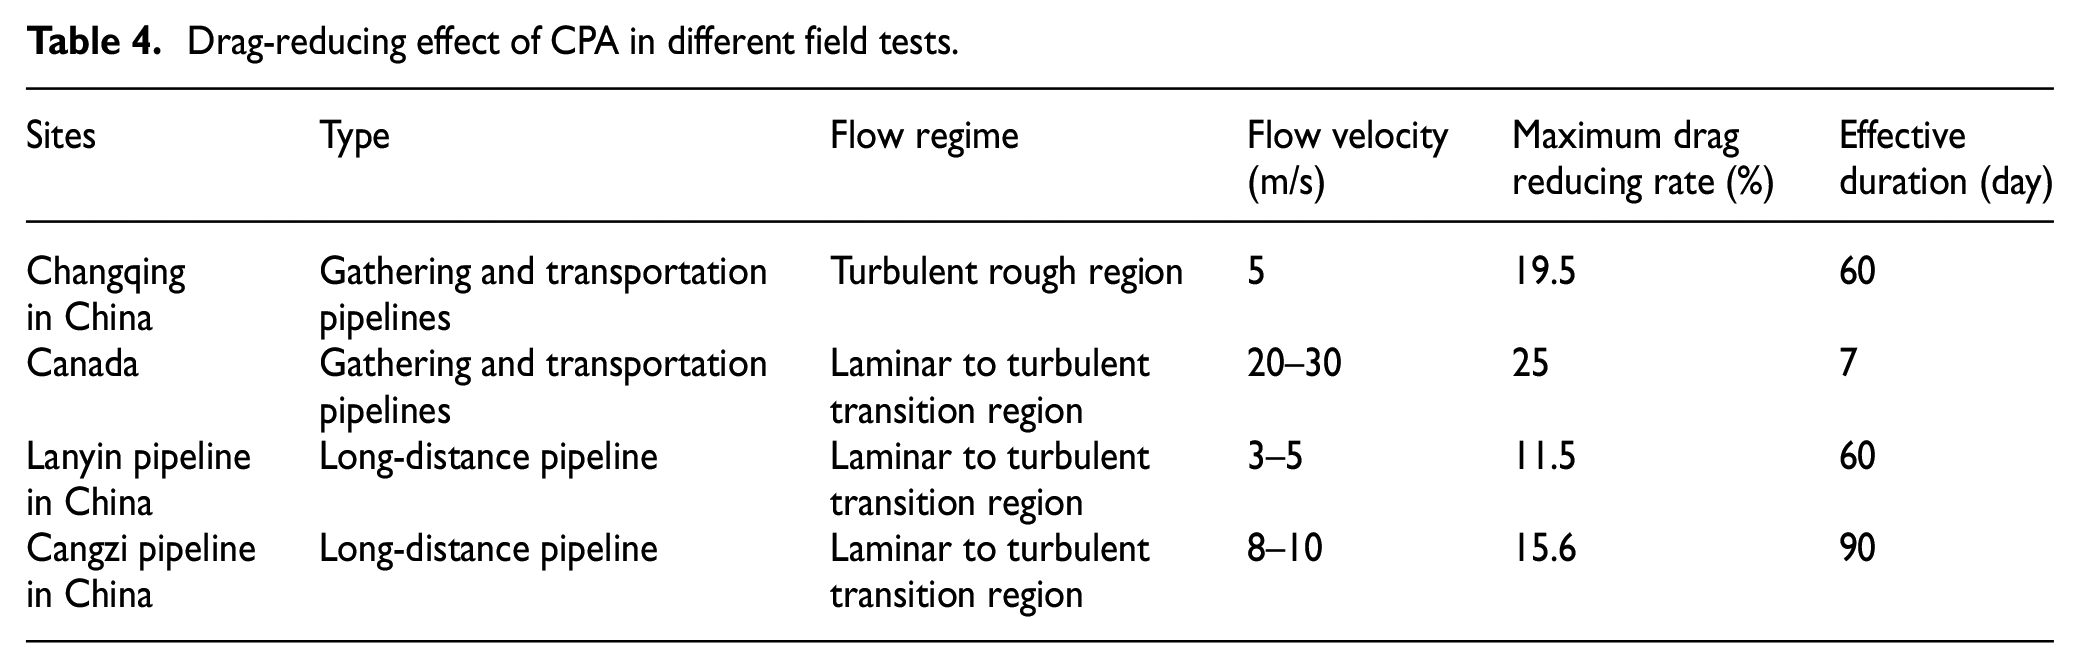
Adopting the same test approach, a series of experiments related to the effect of CPA reducing resistance were carried out in different pipeline transportation sites. The field test data are shown in Table 4, which reveal the following three important conclusions.
The drag-reducing effect of CPA in pipelines of the turbulent rough region is better than that of pipelines of laminar to the turbulent transition region.
The drag-reducing effect of CPA in pipelines of high velocity is better than in pipelines of low velocity.
The drag-reducing effect of CPA in gathering and transportation pipelines is better than that of the long-distance pipeline.
Drag-reducing effect of CPA in different field tests.
CPA can reduce the operating pressure of the pipeline and even increase the gas delivery volume. To enhance the drag-reducing effect of DRAs, it is suggested that the gathering and transportation pipelines matching with DRA should be set up with small diameter and high flow velocity.
Conclusion
In this article, an experimental investigation on the roughness-reducing effect of CPA on the inner surface of the pipeline is carried out. The flow region of the boundary layer of the pipeline is simulated using computational fluid dynamics software Fluent. The field tests for drag reducing of CPA are performed. The main conclusions are as follows:
A new DRA named CPA is synthesized by the chemical reaction of secondary amine, morphine, acetaldehyde, and succinic acid. CPA has two alkyl groups with multipolar terminals which can closely combine with metallic iron. Meanwhile, it is easy to dissolve in the familiar organic solvent of oil, alcohol, acetone, or toluene. The decomposition temperature of CPA is 400°C.
CPA can significantly reduce the roughness of the pipeline. Compared with the roughness of cleaned specimens, the mean RRP of the DRAs generated by different concentrations of CPA is 29.26%. The maximum RRP is 38.74%, and the corresponding CPA solution concentration is 600 ppm. Under the microscope’s observation, CPA can form a “continuous layer” on the inner surface of the pipeline. It not only fills the holes and gullies on the inner surface of the pipeline but also renders the inner surface dense, smooth, and uniform.
CPA can reduce the turbulent state and flow resistance of natural gas in the near-wall region of the pipeline. After injecting CPA, the streamline of the natural gas is more consistent with the main flow direction. The vortex decreases drastically and obviously. The velocity fluctuation range of natural gas decreases by 93.2%, and the mean turbulence intensity decreases by 53.01%. Furthermore, the pressure of the natural gas further makes the CPA film develop toward a smooth surface and decreases the roughness of the inner surface of the pipeline. This indicates that CPA can reduce the friction drag of the boundary layer and thereby reduce energy consumption.
The field tests show that the maximum drag reduction rate of CPA can reach 25% and the drag-reducing effect can last for 90 days; CPA is suitable for application in gathering and transportation pipelines of high flow velocity and turbulent rough region. To improve the drag-reducing effect and pipeline transportation capacity by using drag-reducing agent, small diameter pipelines with high flow velocity characteristics can be used to construct new gathering and transportation pipelines.
Footnotes
Handling Editor: James Baldwin
Declaration of conflicting interests
The author(s) declared no potential conflicts of interest with respect to the research, authorship, and/or publication of this article.
Funding
The author(s) received no financial support for the research, authorship, and/or publication of this article.