
Abstract
The particle size distribution of granular blasting materials has a vital influence on the filling quality of earth-rockfill dams. The engineering experience-based method used to evaluate the particle size distribution has shortcomings at both the theoretical and practical aspects. This article proposes a new evaluation method based on the fractal theory. Grading sieve tests on granular materials, mass fractal analysis of particle size distribution, and a probability distribution model test of the characteristic parameters are used to revise the functional relationships between the fractal dimension D and the uniformity coefficient/curvature coefficient (Cu/Cc) of the grading curve. The feasibility of using D to evaluate the particle size distribution and the optimal fine grain content is then analyzed and determined. According to the results, the geometric shapes of the granular blasting materials have fractal characteristics, and their particle size distribution has a fractal distribution. The ranges of D where the rockfill and transition materials have a good particle size distribution are D = 2.254–2.529 and D = 2.358–2.559, corresponding to optimal fine grain content of 1.953%–11.805% and 10.268%–23.123%, respectively. Fractal dimension has a solid theoretical basis and strong practical applicability as an evaluation index for the particle size distribution of granular blasting materials.
Introduction
Earth-rockfill dams have significant advantages over other dam types and are an important component of large-scale water conservancy projects in mountainous regions.1–3 Rockfill and transition materials account for the largest proportion of the dam materials. Their particle size distribution directly influences dry density, permeability, shear strength, and other physical and compaction properties4–6 and therefore influences the quality and safety of dams. The particle size distribution of a granular material is commonly expressed by its particle grading curve and the related characteristic parameters of uniformity coefficient Cu and curvature coefficient Cc. 7 At present, the evaluation of particle size distribution is mainly based on engineering experience; however, a series of problems arise in field applications such as broad evaluation standards and strong human subjectivity. In view of this, this article proposes a new method for evaluating the particle size distribution of granular blasting materials based on the fractal theory, which might provide several significant implications for practical applications from a more sound theoretical basis.
Rockfill, transition material, and other large-particle granular materials used in earth-rockfill dams are quarried mainly by means of blasting.8,9 As some countries adopt relative density as a rolling control index for granular materials,10,11 there are strict requirements for the particle size distribution of granular materials. At present, the relevant codes only specify the fine grain content in rockfill, transition material, and other large-particle dam materials. For instance, they limit the content of fine grains (<5 and <0.075 mm in size) to a maximum of 30% and 5% of the overall composition, 12 respectively, but do not impose any explicit requirements for grains of other sizes or the particle size distribution. In practice, the first step is to determine the upper and lower envelopes of the grading curve under the guidance of engineering experience. Cu and Cc are then used to define the grading characteristics of the granular materials. Cu > 5 and Cc = 1–3 are considered to reflect good gradation. 12 However, Cu and Cc can only quantitatively describe the width and continuity of the grading curve; they cannot characterize the granular components of various particle sizes and their macroscopic or microscopic collocations.
Since the creation of the fractal theory by BB Mandelbrot,13,14 the particle size distribution of granular materials has been studied by many investigators based on either geometric fractal dimension or statistical fractal dimension. Among these extensive studies, only several very relevant and representative works are reviewed herein. Mandelbrot 15 built a two-dimensional (2D) spatial fractal model for particle size distribution and took the lead in using the fractal theory to investigate the particle size distribution of granular materials. Tyler 16 and Tyler and Wheatcraft 17 extended the three-dimensional (3D) spatial fractal model for particle size distribution and established a mass fractal model for particle size distribution, thus forming a theoretical foundation for exploring the fractal distribution of granular materials. Perfect 18 comparatively studied three fractal models (i.e. mass, quantity, and size) for particle breakage but failed to touch upon engineering application. Xie et al.19–21 probed into the relationships between fractal characteristics and mechanical properties in rock breakage and claimed that rock breakage would result in clear fractal characteristics. Zhang 22 and Bagde et al. 23 created a damage model for calculating rock blasting fragmentation and calculated the fractal dimension. Wu et al. 24 and Zhao et al. 25 introduced the fractal theory into the evaluation of the grading of granular materials and studied the scale effect of rockfill; Liu et al. 26 developed a 2D fractal model to investigate the particle size distribution of heterogeneous geomaterials; however, their work employed only indoor experiments. Bi et al. 27 took the approach of acquiring fractal dimensions from four different types of particle size grading curves and further enriched the mass fractal model for particle size distribution proposed by Tyler et al. Goktepe and Sezer 28 and Chen et al. 29 studied the relationships between the fractal dimension of particle size distribution and the relative density and permeability of particles. Zhu et al., 30 Xu et al., 31 and Zhang et al. 32 investigated the relationships between the fractal dimension of particle size on the one hand and the dry density and shear strength of rockfill on the other. Ying et al. 33 explored the influence of the particle size fractal dimension of rockfill on its compaction properties. In brief, the above studies employing the fractal theory to investigate the particle size distribution of granular materials mainly focus on tests of material properties but have not attempted to modify or replace the existing evaluation method.
To sum up, while existing fractal studies on granular materials mainly stress the relationships between particle size distribution 34 and physico-mechanical properties,35–37 few theoretical or applied studies have been carried out regarding the evaluation of the particle size distribution of granular materials. In engineering practice, the upper and lower envelopes of the grading curves of granular materials used in earth-rockfill dams are primarily determined and evaluated based on analogies from experience. However, with the continuous increase in rockfill particle size, the existing method can no longer satisfy the demands of engineering applications. This article introduces the fractal theory into study of blasting-derived rockfill and transition materials. By analyzing the fractal characteristics of granular blasting materials and revising the functional relationships between fractal dimension and characteristic parameters of the grading curve, it enables an assessment of the feasibility for using the fractal dimension D and its reasonable intervals to evaluate the particle size distribution of blasting rockfill and transition materials in earth-rockfill dams. The study, thus, provides a new approach applicable in engineering contexts and offers reference information for blasting fragmentation prediction, 38 performance testing, and field construction with granular materials.
Materials and methodology
Sampling and measurement
The granular blasting materials used in this study were collected from the Changhe Dam project. Located in Kangding County, Sichuan Province, Southwest China, the Changhe Dam Hydropower Station is the 11th level hydropower station in the cascade hydropower development of the mainstream of the Dadu River. 39 The 240-m high dam is rooted in the deep overburden layer of a steep and narrow valley with the seismic fortification grade of 9. Thus, the deformation of this huge dam under seismic loadings is one of the greatest concerns of this project. For this reason, strict requirements have been imposed on the particle size distribution of granular materials used for dam filling. A total of 34,175,000 m3 of granular materials are used in this project, over 75% of which is rockfill and transition materials. There are 12 zones in the dam from upstream to downstream, in which different types of granular materials of different particle sizes are adopted; see Figure 1 for the dam zoning. This study collected a total of 145 groups of granular materials from different sites in the field: 32 groups of rockfill from the upstream area, 22 groups of rockfill from the downstream area, 21 groups of transition material from the right bank of the upstream area, 26 groups of transition material from the left bank of the upstream area, 23 groups of transition material from the right bank of the downstream area, and 21 groups of transition material from the left bank of the downstream area. Particle grading was then detected through sieving (sieve pore size: 0.075–800 mm).

Zoning of granular materials in Changhe Dam: (a) profile; (b) planar graph.
Mass fractal model for particle size distribution
The self-similarity of fractal characteristics can been found extensively in natural materials. Mandelbrot, 14 Tyler, 16 and Tyler and Wheatcraft 17 have successively built and developed fractal models for the particle size distribution of granular materials. Assuming that materials of different particle sizes have the same density, the volume V(r > di) and mass M(r > di) of a material with the size greater than a characteristic value di can be calculated from equations (1) and (2)
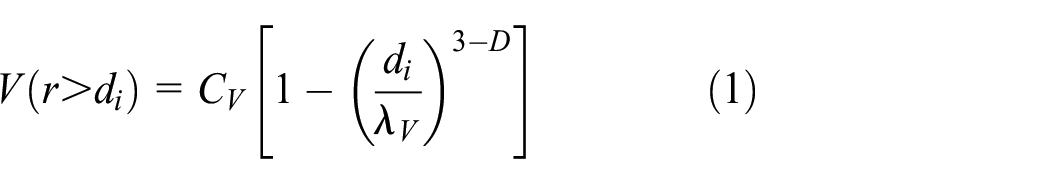

where r and ρ, respectively, represent the particle size and density of the granular material; CV and λV are two constants, of which the magnitudes depend on material shape and size; and D denotes the fractal dimension of the particle size distribution.
In equation (2), if di = 0, M(r > 0) will be the total mass MT of the granular material; if di is equal to the largest particle size dmax of the granular material, M(r > dmax) = 0. Substituting the above two conditions separately into equation (2) results in


Through simultaneously solving equations (2)–(4), the fractal functional relationship between mass and particle size can be established for the granular material
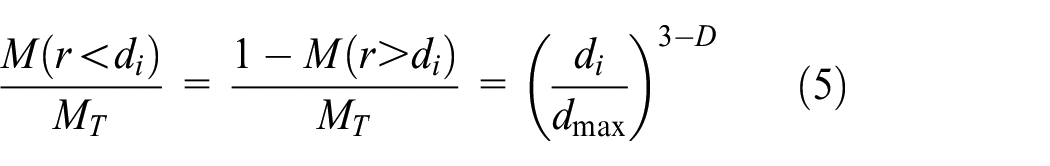
Taking the logarithm on both sides of equation (5) results in

In equation (6), M(r < di)/MT represents the cumulative percentage of undersize rock when the particle size is smaller than a characteristic size. The value of this term can be determined via a sieve test. After plotting the scatter diagram in a log–log coordinate system, the least square method can be adopted for data fitting (the slope of the line: 3−D) so as to determine the fractal dimension D of the particle size distribution of the granular material. The curve given by equation (6) is referred to as a particle size fractal curve, that is, when the particle size distribution of the granular material satisfies fractal distribution, its particle size fractal curve is a straight line.
Fractal distribution of granular blasting materials
Fractal characteristics of granular blasting materials
A heap of granular blasting materials was collected randomly from each of the two blasting stockyards of the Changhe Dam; the two material types are shown in Figure 2(a) and (c). It is difficult to accurately describe the geometric shapes and sizes of each individual granular blasting material. However, there are some similarities among them.

Geometric characteristics of granular blasting materials: (a) granular blasting material #1, (b) projection shape of granular blasting material #1, (c) granular blasting material #2, (d) projection shape of granular blasting material #2, (e) statistics on the projection shapes of granular blasting materials, (f) rose diagram of the interior angle distribution of quadrilateral projections, and (g) rose diagram of the interior angle distribution of pentagonal projections.
Photographs of the granular materials were imported into CAD to gather statistics on their projection shapes, as shown in Figure 2(b) and (d). According to the statistical results shown in Figure 2(e), 58.7% and 32% of the 75 projection shapes recorded are quadrilaterals and pentagons, respectively, while triangles and hexagons both account for low proportions. This suggests that the projection shapes of granular blasting materials are mainly quadrilaterals and pentagons. In other words, although different granular blasting materials have different geometric shapes, their projection shapes show some statistical regularities. The maximum and minimum interior angles of these projection shapes were also measured; rose diagrams of interior angle distribution are shown in Figure 2(f) and (g). When the projection shape of a granular material is a quadrilateral, its maximum interior angle lies within the range of 97°–126° and its minimum interior angle ranges from 55° to 75°; when it is a pentagon, its maximum and minimum interior angles range from 126° to 145° and 76° to 93°, respectively. The distribution of the maximum and minimum interior angles of granular materials is consistent to some extent.
The statistics on the projection shapes and distribution of interior angles of granular blasting materials indicate that, regardless of the size, the geometric shapes of the granular blasting materials always show statistical self-similarity. This means that these granular blasting materials obey two important principles of the fractal theory, that is, self-similarity and scale invariance. Thus, the fractal theory is applicable to the investigation of the particle size distribution of granular blasting materials.
Fractal distribution of granular blasting materials
The mass fractal model for the particle size distribution of granular materials is adopted to study the grading curves and particle size fractal curves of rockfill and transition materials and gather statistics on the grading and fractal parameters on various curves. As shown in Figure 3(a) and (c), the particle size distribution of rockfill material is concentrated in 10–1000 mm and the particle size distribution of transition material is concentrated in 1–100 mm. The particle size of rockfill material is obviously larger than that of transition material, while the distribution law of grading curves of different granular materials is similar. In Figure 3(b) and (d), the particle size fractal curves of 145 groups of granular materials all show a good linear correlation, with a correlation coefficient R2 of above 0.95. This suggests that the particle size distribution of rockfill and transition materials satisfies the fractal distribution.

Grading curves and fractal curves of rockfill and transition materials: (a) grading curves of 54 groups of rockfill material, (b) fractal curves of 54 groups of rockfill material, (c) grading curves of 91 groups of transition material, and (d) fractal curves of 91 groups of transition material.
Probability distribution models for particle size distribution parameters
Investigating the form of the probability distribution of particle size distribution parameters offers another perspective on the relationship between particle size distribution and fractal distribution for granular materials. For a set of given sample data, a reasonable, practical, and simple probability distribution model can be selected from the common probability density functions to calculate the statistical characteristic parameters (such as the mean value µx and standard deviation σx) so that the graph of the distribution function is a good approximation of the frequency distribution histogram of the dataset. In this way, the probability distribution models for the characteristic parameters of Cu and Cc on the particle size grading curves and for D on the particle size fractal curves are calculated for rockfill and transition materials, respectively, as shown by the results in Figure 4. Table 1 provides the Kolmogorov–Smirnov test results of various parameter indexes.

Histograms of probability distribution of characteristic parameters of rockfill and transition materials.
Kolmogorov–Smirnov test results regarding normal distribution.

In Figure 4, the frequency distribution histograms and output distribution curves of all parameters are bell shaped. And the p value of all parameters in Table 1 are greater than 0.05. According to the statistical results, these particle size distribution parameters, Cu, Cc, and D, of rockfill and transition materials all have a normal distribution. On the whole, normal distribution is a power-law distribution and is approximate to fractal distribution, which indicates, from another angle, that the particle size distribution of rockfill and transition materials satisfies fractal distribution.
Results
Fractal dimension and grading characteristic parameters
When the particle size distribution strictly satisfies fractal distribution, Cu/Cc of the grading curve and D of the fractal curve have the following functional relationships

where d60, d30, and d10 represent the particle sizes of rockfill when the cumulative percentages of undersize rockfill reach 60%, 30%, and 10% in the particle sieve test, respectively.
However, in practice, the particle size distribution of granular materials does not satisfy fractal distribution in the strict sense, and there is usually only statistical fractal distribution. Thus, when studying the relationships between D and Cu/Cc, correction coefficients Ku and Kc are introduced to revise Cu and Cc in equation (7), respectively

Fitting analysis was performed on the field grading sieve data for 54 groups of rockfill and 91 groups of transition material from the Changhe Dam project according to the functional relationships given by equation (8). The data plotted in Figure 5 suggest that Cu and Cc both increase with an increase in D. The correction coefficients Ku are obtained to be 1.066 and 1.128 (both greater than 1) for rockfill and transition materials, respectively, and the correction coefficients Kc are 0.483 and 0.374 (both smaller than 1) for rockfill and transition materials, respectively.

Correlation fitting for the relationships between D and Cu/Cc.
Fractal dimension as an evaluation index for particle size distribution
As demonstrated by equations (7) and (8), when the particle size distribution of granular materials satisfies strict fractal distribution and statistical fractal distribution, Cu/Cc and D have functional relationships. In terms of characterizing the particle size distribution of rockfill, transition material, and other granular materials, D is equivalent to Cu and Cc. Thus, when strict fractal distribution and statistical fractal distribution are satisfied, D and Cu/Cc have the functional relationship curves shown in Figure 6.

Relationships between D and Cu/Cc: (a) relationships between D and Cu/Cc when strict fractal distribution is satisfied and (b) relationships between D and Cu/Cc for rockfill and transition materials when statistical fractal distribution is satisfied.
Referring to the standards that there is good gradation when Cu > 5 and Cc = 1–3, 12 it can be deduced that when strict fractal distribution is satisfied, the intervals over which rockfill and transition materials have a good particle size distribution fall within the range of D = 1.887–2.392; when statistical fractal distribution is satisfied, the interval for rockfill falls within the range of D = 2.254–2.529, while that for transition material falls within the range of D = 2.358–2.559.
Fractal dimension and optimal fine grain content
Currently, the standard for the construction of earth-rockfill dams only requires that the content of fine grains smaller than 5 mm in size must be less than 30% 12 but does not suggest explicitly any limits on the optimal range in fine grain content. Scatter diagrams of D and fine grain content were plotted, respectively, for rockfill and transition materials, and curve fitting was then carried out. In Figure 7, D increases with an increase in the fine grain content in both cases, showing an obvious positive linear correlation. Combining this result with the requirements for the fractal dimension of a good particle size distribution when statistical fractal distribution is satisfied indicates that the optimal fine grain content of rockfill material is 1.953%–11.805% and that of transition material is 10.268%–23.123%.
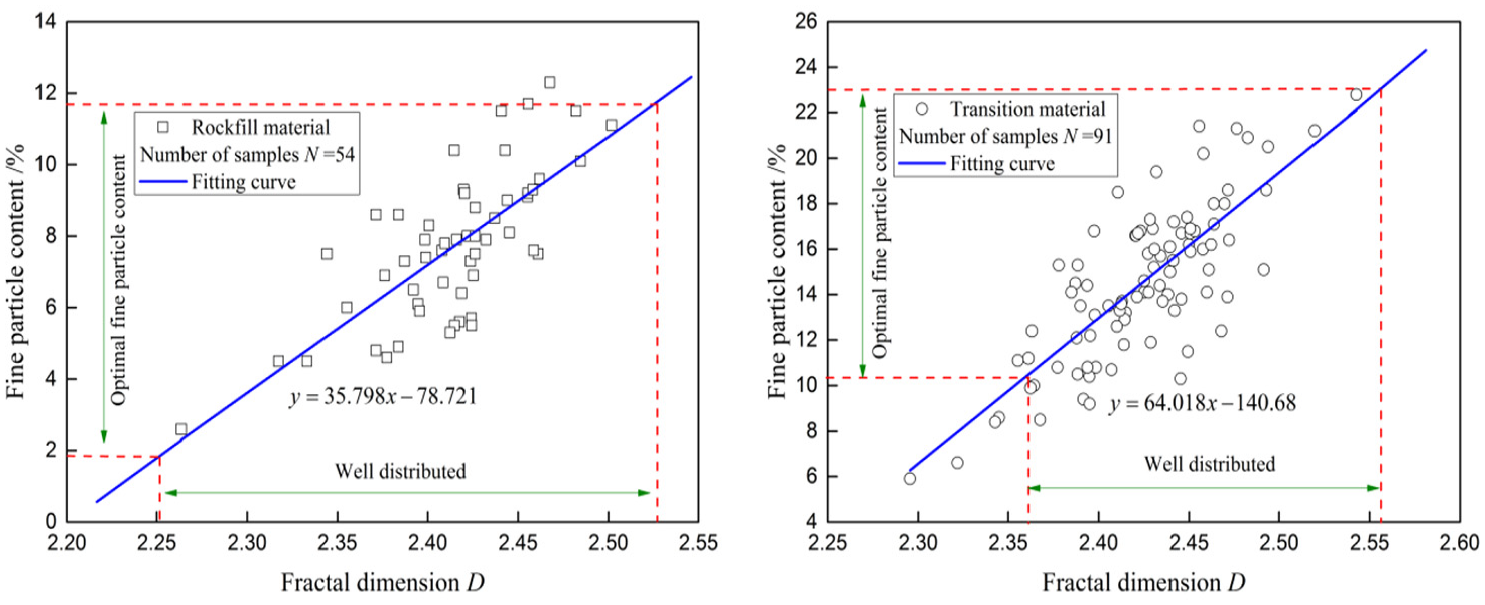
Correlation between D and fine grain content.
Discussion
1. The self-similarity of geometric shapes in Figure 2 and fractal curves in Figure 3 shows that the particle size distribution of granular blasting materials satisfies the fractal characteristics and the fractal distribution. Considering blasting load as a kind of impact load, this is consistent with the findings by Hou et al. 40 and Cai et al. 41 However, there are some differences in using fractal dimension to evaluate the particle size distribution between rockfill and transition materials.
First, in Figure 5, for both rockfill and transition materials, the revised functional relationships between D and Cu/Cc give correction coefficients Ku for Cu that are greater than 1, and the correction coefficients Kc for Cc are smaller than 1. This suggests that, in practical engineering, Cu determined via the sieve test is greater than that calculated according to the strict fractal distribution theory, while the contrary is true for Cc. This, to some extent, makes up for the deficiency of pure theoretical formula in practical application. Given that Cu reflects the composition of granular materials of different particle sizes, a greater Cu value means that the granular material has a higher uniformity in terms of collocation. Cc reflects the steepness of the particle size grading curve, so a smaller Cc value means the grading curve is flatter and the particle size distribution has a higher continuity. Therefore, the modified functional relationships can better ensure that the particle size distribution of the granular materials meet the actual requirements.
Second, in Figure 6, adopting fractal dimension D as an evaluation index for the particle size distribution of granular materials, the fractal dimension intervals over which the particle size distribution is good are consistent when rockfill and transition materials satisfy strict fractal distribution; this is because the requirement of Cu and Cc of the grading curve for evaluating particle size distribution of different dam-building materials is the same at present, 12 but the difference of particle size is neglected. When statistical fractal distribution is satisfied, the value of the fractal dimension interval of good particle size distribution is smaller for rockfill than for transition material, and their respective intervals show stability. This is because a higher fractal dimension means a higher percentage occupied by smaller granular particles after rock breakage.40,41 This is consistent with the observation that the particle size of rockfill is generally greater than that of transition material in practice. In the same vein, when adopting the fractal dimension to study optimal fine grain content in Figure 7, the optimal fine grain content of rockfill material is lower than that of transition material. Compared with the results given in Zhu et al. 42 and Ying et al., 33 it is more reasonable and accurate to use the revised functional relationships between D and Cu/Cc to separately determine the range of fractal dimension when rockfill and transition materials have a good particle size distribution.
2. If the requirements for the fractal dimension of a good particle size distribution when satisfying the statistical fractal distribution are used to analyze the particle size distributions of 145 groups of rockfill and transition materials in the Changhe Dam project, the following results can be reached. All 54 groups of rockfill material satisfy the criterion, so the proportion with a good particle size distribution is 100%; 89 of the 91 groups (97.80%) of transition material satisfies the criterion, and the fractal dimensions of the remaining two groups of transition material are also approximate to the requirements. Furthermore, the optimal fine grain ranges determined according to the fractal theory for the 145 groups of samples all satisfy the requirements of the current code (<30%). 12 In addition, according to subsequent field detections, the settlement of the dam 1 year after the completion of dam construction was less than 1%, so the quality of granular material filling is effectively confirmed. Referring to the application of fractal dimension in evaluating particle size distribution of other granular materials, 43 it is thus clear that D can be adopted as an evaluation index for the particle size distribution of rockfill and transition materials used in earth-rockfill dams and that it has a solid theoretical basis and strong practical applicability. Moreover, the optimal fine grain content (particle size smaller than 5 mm) of rockfill and transition materials for earth-rockfill dam construction is given accurately in the proposed method and for the first time, which provides an improvement on the existing experience-based evaluation index. 12
3. This study collected 54 groups of rockfill material samples and 91 groups of transition material samples from different elevations in the earth-rockfill dam. The samples are representative, and the sample volume is sufficient. However, the deficiency might be that they all come from the same project. Thus, in future, samples collected from different earth-rockfill dams should be used for a comparative study. When analyzing the relationship between fractal dimension and fine grain content for granular materials, the pore size of sieve tools imposes practical limits, and the optimal content of particles smaller than 0.075 mm in size still needs to be further investigated. In addition, it is also necessary to probe into the relationships between fractal dimension and compaction parameters (such as dry density, porosity, and moisture rate) in a field rolling test, so as to provide further guidance for engineering applications. Meanwhile, it is also commonly observed that joints in natural rock mass are also a kind of fractal distribution.44–46 At present, it is a major difficulty to study the particle size distribution of rock mass containing joints after blasting. In this article, the fractal dimension range of two kinds of blasting granular materials, rockfill material and transition material, which meet the requirements of earth-rock dam filling, is obtained. The blasting mechanism and blasting scheme can be further studied by blasting numerical simulation and field test, taking into account the fractal distribution of joints in rock mass before blasting and the fractal distribution of granular materials after blasting.
Conclusion
This article first analyzes the geometric shapes of granular blasting materials and performs field sieving tests of the gradation of granular materials. Then, a mass fractal model is used to analyze the particle size distribution of the materials, with the characteristic parameters of particle size distribution being obtained. The revised functional relationships are proposed between D and Cu/Cc. Appropriate ranges for D and fine grain content are finally suggested, separately, for rockfill and transition materials with a good particle size distribution. The main conclusions are as follows:
The particle size distribution of granular blasting materials satisfies the fractal distribution. Quantitative evaluation index of the good particle size distribution can be obtained by the revised functional relationships between fractal dimension D and Cu/Cc. A good particle size distribution in rockfill material has an interval of D = 2.254–2.529, and its optimal fine grain content is 1.953%–11.805%; transition material has a good particle size distribution interval of D = 2.358–2.559 and an optimal fine grain content of 10.268%–23.123%.
Fractal dimension D can completely replace the two indexes Cu and Cc used to evaluate the particle size distribution of granular blasting materials in earth-rockfill dams and is more accurate in determining the good particle size distribution range and the optimal fine particle content. The fractal dimension D has a strong theoretical and practical significance.
Footnotes
Handling Editor: James Baldwin
Declaration of conflicting interests
The author(s) declared no potential conflicts of interest with respect to the research, authorship, and/or publication of this article.
Funding
The author(s) disclosed receipt of the following financial support for the research, authorship, and/or publication of this article: This study is supported by the National Key R&D Program of China (Grant No. 2018YFC1508501, 2018YFC1505402, and 2018YFC0406800), and the National Natural Science Foundation of China (Grant No. 51809188). The financial supports are gratefully acknowledged by the authors.