
Abstract
The fatigue life prediction model cannot accurately predict the service life of coiled tubing operations, resulting in waste and accidental fracture of coiled tubing. This article introduces the fatigue life prediction model of coiled tubing and a detection system developed using weak magnetic detection method and eddy current detection method. The detection device is used to detect accurate defect dimension, wall thickness reduction, and diameter deformation to improve the accuracy of fatigue life prediction. Furthermore, the actual defect dimension is included in the fatigue life assessment calculation to eliminate the influence of the existing model on the immobilization of defects and corrosion influence factors. By analyzing field operation cases and measured values, the effects of defects, wall thickness reduction, and diameter growth on fatigue life are studied to improve the accuracy of parameters and the integrity of basic data in the calculation process. The influence of reverse bending and weld on fatigue life is discussed. The residual life can be predicted more accurately by combining field testing technology and fatigue life evaluation method. Field measurement input of fatigue life prediction model is the main means to improve its accuracy and practicability.
Introduction
Coiled tubing (CT) is a pipe made of low-carbon alloy steel. It is a revolutionary technology in the petroleum field. It is called a universal working machine and is widely used in oilfield logging, workover, and drilling operations. In actual conditions, CT is wrapped around the guide arch and the drum, causing the bending and deformation. In addition, CT is also subjected to internal pressure. These factors have led to low-cycle fatigue damage in CT, resulting in limited use. 1 The CT contains three bending actions when it is taken out or lowered into the well. And, the CT undergoes six bending plastic deformations during each start-up operation, which is also the main reason for its failure. 2
The most widely used method is establishing a theoretical fatigue life model to predict the fatigue life of CT, which is based on the bending and straightening fatigue test data of CT under different CT sizes and pressure by fatigue tester. After years of development, the CT fatigue life model has three main fatigue calculation models: the Tipton model developed by S Tipton (Tulsa University), the Avakov model developed by V Avakov (Haliburton), and the Coiled tubing simulation software provides life prediction (CIRCA) model developed by BJ/Nowsco.3–5 All three fatigue models are applied to the life prediction of CT in field operations, which reduces fatigue failure to some extent.
In fact, CT has various failure modes, and most of the failures are caused by mechanical damage, corrosion (storage corrosion, downhole corrosion, microbial corrosion), manufacturing defects, erosion, and so on, which cause a sharp decline in life. 6
The size parameters of CT often change with the use of CT. These changes will affect their fatigue life, but the changes in these parameters cannot be accurately predicted. Therefore, relying solely on theoretical models for life prediction cannot meet the requirements of engineering applications. 7 In order to more accurately predict the remaining life, the best means is to monitor these parameter values in real time by means of detection tools and to input monitoring values into the fatigue life prediction model for prediction.
In recent years, the CT field service business has undergone great changes and has gradually moved into new service areas. For example, multi-stage segmental fracturing of horizontal wells requires larger diameter and internal pressure. 8 This puts forward higher requirements for CT materials and manufacturing technology. Meanwhile, safety of CT field operation and the accuracy of fatigue life prediction are also put forward for higher requirements. The current fatigue life prediction model still needs to be greatly improved. 9
In order to effectively utilize the service life of CT and improve the safety of CT services, researchers need to improve CT detection technology and increase the real-time accuracy of the fatigue life model input parameters. In this article, the author’s team developed an online detection device of CT and an installation device adapted to various diameter measurements using weak magnetic detection method (high-precision fluxgate sensor) and eddy current detection method, and compiled the collection and processing software system. 10 Field measurement values are input into the fatigue model software for calculation to improve the prediction accuracy of the fatigue model.
Fatigue model
There are many parameters that affect the accuracy of the current fatigue model prediction: the accuracy of the fatigue model itself, the accuracy of the input parameters, the integrity of the CT operation duration record, and the tracking method used for the fatigue model. The typical low-cycle fatigue model calculation process for CT is shown in Figure 1. The basic parameters for CT input include CT outer diameter, wall thickness, and material type. Among them, state characteristics of CT include fatigue damage, diameter growth, wall thickness reduction, stress, strain, and reverse stress. Most current fatigue life models directly input a predicted wall thickness reduction value and apply it to the entire pipe segment. This method has great drawbacks to the accuracy of fatigue calculations. The reason for doing this on the spot is that the wall thickness reduction obtained by the fatigue test is linearly thinned in many ideal conditions. However, this only considers the relationship between wall thickness reduction and different types of operations. In practice, many factors will lead to wall thickness reduction in the process of operation. For example, different operators often input different thinning amounts for this column in the next operation, which also leads to the contradiction of fatigue calculation. The most serious problem is to set the wall thickness reduction value as a fixed value and apply it to the entire pipe section, which has great drawbacks. Therefore, through the traditional fatigue life prediction method, the predicted value of the CT wall thickness is difficult to meet the accuracy requirements.

CT fatigue calculation process.
Through the study of the working process of the CT, the CT experienced six bending plastic deformations in each start-up operation. This is the main cause of low-cycle fatigue damage in CT. It can be seen from Figure 2 that a 2/3 bending cycle occurs at the gooseneck, but not 2/3 of the fatigue damage occurs in the gooseneck. It is worth noting that all the fatigue damages occur on the equipment above the wellhead, not in the well. The CT in the well is in the elastic range, and the fatigue damage is neglected. Based on the plastic deformation process of CT, a low-cycle fatigue life prediction model is established. The CT online detection device and the acquisition processing software system studied by the author’s research group are used for real-time online detection of CT, and combined with the fatigue prediction model to improve the fatigue life prediction method.
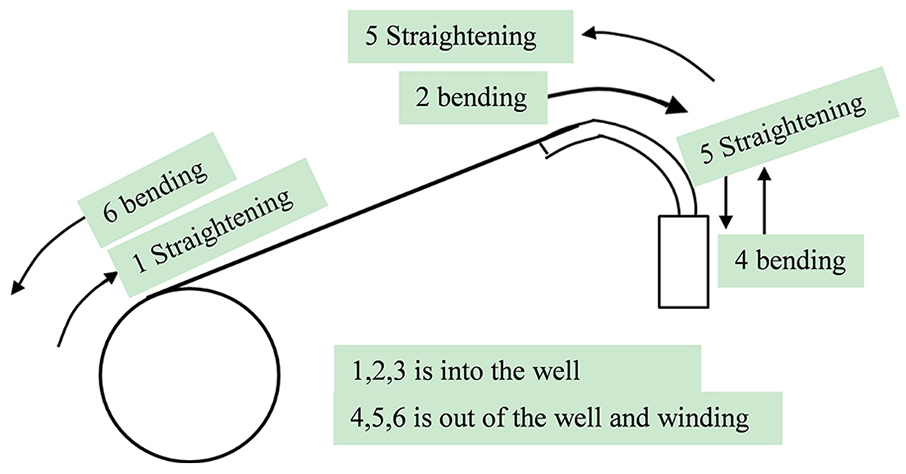
CT up-and-down well bending diagram.
The low-cycle fatigue model obtains basic data through the fatigue tester. These basic experimental data are fitted to obtain the relation curve between pressure and fatigue. The Manson-Coffin equation calculates the theoretical fatigue life based on these basic data. In this article, the fatigue model is improved. Considering plastic strain fatigue curve part, the tubing bending process is in the plastic strain state, and the cycle number is less than 1000. It can be simplified to represent the fatigue life curve by the plastic strain fatigue curve

According to the test data and the above formula, the fitted curve is shown in Figure 3. “Index” represents the index of the curve fitting formula. The plastic fatigue life curve is given by the relationship between the number of fatigue cycles and strain. The baseline fatigue life curve considers the influence of the circumferential stress. Once the baseline strain life curve is established, the remaining range of fatigue life data can be calculated, which is the data of unmeasured range at the testing time. 11

Regression curve of strain fatigue life under different circumferential stresses.
Field data collection and fatigue life prediction are shown in Figure 4. The detection system can measure wall thickness, diameter, and defect online in real time. These measured values can replace the theoretical values of wall thickness and diameter. The researchers compared the test data with the data from the standard tube test to ensure that the data from the field test was correct. The detected data can be processed and analyzed by data processing software to obtain CT-related parameters. These parameters can be directly imported into the fatigue life prediction model software to improve the real-time accuracy of the input parameters. At the same time, it can input damage defects to increase the actual influence factors and improve the accuracy of prediction.

Field data collection and fatigue life prediction diagram.
Influence of defect on fatigue life
CT has many mechanical damages on the surface during operation, but these damages do not meet the scrapping standard. Such CT can continue to be used, but the outer surface defects will reduce the service life of the CT. Micro-cracks caused by mechanical damage on the outer wall will cause serious plastic deformation of the tubing. These micro-cracks constitute the initial fatigue cracks, which reduce the safe fatigue life of the tubing by 48%–75%. At the same time, scrapping the defective CT directly will result in a great waste of assets, which is unwilling to be accepted by the service providers. In addition, it takes several months to change a new CT in some places, so it is necessary to scientifically evaluate the defective tubing.
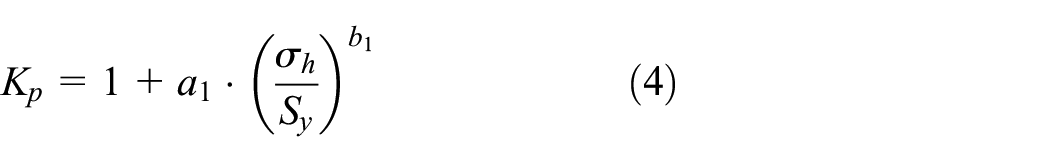
Many commercial fatigue life prediction models have ignored the effects of CT surface defects on the CT fatigue life, such as cracks, grooves, scratches, cuts, and corrosion pits. The life tracking model assumes that the CT is in an ideal state and does not consider the damage effects of local defects. With the development of non-destructive testing technology, the geometric information of the defect signal can be obtained. The fatigue cycle number of CT is generally less than 1000 cycles. If the outer surface has a defect, it will inevitably lead to a decrease in fatigue life. 12 In addition, the impact of mechanical damage on the CT fatigue life has also been studied. CTMRC Tulsa University has developed some quantitative models of mechanical damage for fatigue life prediction. Based on the geometrical sizes of the defect, the model defines the defect sensitivity factor Q, which is reflected in the calculation of the equivalent strain amplitude by the form of the formula. Defect sensitivity factor Q is based on the relationship between the ratio of the defect to the wall thickness, the aspect ratio, and the area of the defect13–15

where d, w, and x are the depth, width, and length of the defect (mm); and t is the wall thickness (mm) of the CT; Ap and Ac are, respectively, expressed as the projection area of the defect in the CT cross section and the projection area of the bearing capacity of the CT in good condition at the defect (m2). Q indicates the severity of defects. The greater the value of Q, the greater the impact on the life of CT. According to different defect types, material grades, and pressure levels, Q has a certain relationship with fatigue life. The influencing factors of fatigue life include the shape and size of the defect, the size of the tubing, the working condition, and the cause of the defect.
Plastic deformation plays a dominant role in the process of CT bending. Due to the existence of surface mechanical damage defects, strain concentration will occur at the damage area. The local strain at the strain concentration area is much larger than the nominal strain. The original strain calculation formula for fatigue calculation has not met the requirements. Therefore, the strain concentration factor is used to express the severity of the defect, and the relationship between the strain concentration factor and the defect sensitivity factor Q is found, and the relationship of the equivalent strain amplitude is obtained. This provides a theoretical model to reflect the influence of defects on the prediction of tubing fatigue life. The real-time detection system of CT is used to detect the position and size of defects in real time, reflecting the influence of defects on the life in the life model. It can more accurately predict the remaining life and avoid accidental failure. Defect sensitivity factor Q has a certain relationship with the strain concentration factor Kε. Equations based on the statistical regression of the test data are expressed as follows

where a2 and b2 are curve constants.
According to the pressure concentration factor and the strain concentration factor, the fatigue life prediction procedure of the CT with surface defects is as follows:
According to the given pressure range, denoted by
Based on the geometrical sizes of the surface defects, the defect sensitivity factor Q is obtained and then the strain concentration factor

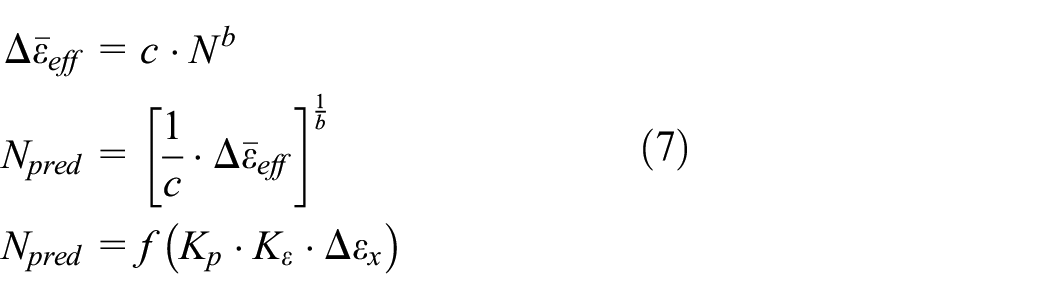
The equivalent strain amplitude of the defective tubing can be calculated by the following formula

The fatigue life N can be calculated by the equivalent strain amplitude curve
Use Miner’s law to calculate total fatigue damage and life.
According to the geometry of the defect obtained by the in-line detecting device, it is input into the fatigue life prediction model with defects.
Influence of wall thickness reduction on fatigue life
The testing device developed by the author’s team can detect the diameter of the CT and the thickness reduction of the wall. The detection device provides continuous and accurate wall thickness reduction measurements. Based on field measurements, it can be used to calculate the fatigue life of the entire tube. The predicted wall thickness reduction values and field measurements are used to track and compare the life damage. Figure 5 shows that the fatigue life of the whole pipe is predicted by the predicted value of wall thickness reduction.16,17 The blue part represents the part of the fatigue life that has been used, and the ordinate represents the percentage of the fatigue life used in the total life. The abscissa represents the length of the CT being tested. Figure 6 shows the fatigue life calculated using wall thickness measurements. From the comparison of the two figures, according to the predicted wall thickness reduction value, it is found that the fatigue life of the entire working pipe is large. According to the actual on-site measurement, it is found that only in the part where the wall thickness is actually reduced, the fatigue life damage is large. Moreover, life damage is lower than the fatigue damage calculated by the predicted value. At the same time, it can also represent the characteristics of different life damages of the working pipe section.
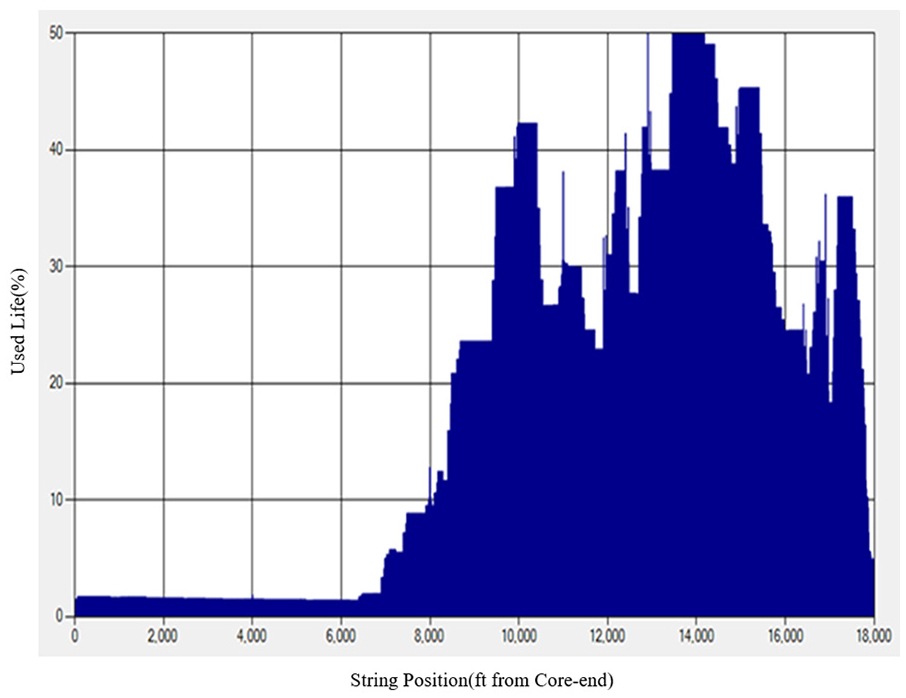
Fatigue life calculated by predicting wall thickness reduction.

Fatigue life calculated by measuring wall thickness.
Through the above analysis and comparison, it is found that calculating the life based on the predicted wall thickness reduction value will overestimate the loss in some pipe segments. But in some pipe segments, the wall thickness reduction will be underestimated. If CT has an abnormal phenomenon, such as accidental thinning in some areas, if the measured value is not input, the fatigue calculation cannot obtain an accurate value. Therefore, it is difficult to find an abnormal portion where the wall thickness of the pipe section is thinned. The use of estimated values and nominal wall thickness does not account for the surge in fatigue life of abnormal pipe sections, which may result in failure of CT operations and economic losses. According to the wall thickness value measured by the on-site real-time detection system as the parameter of the fatigue model calculation, it can improve the accuracy and reliability of the calculation.
Effect of diameter growth on fatigue life
The increased reliability of CT is due to a more reliable manufacturing process and a more accurate low-cycle fatigue life prediction. At present, large-diameter CT and high internal pressure operation have become more serious, such as drilling and completion, drilling bridge plugs after fracturing, cleaning, and the like. The 50.8-mm CT operation in China has been very common, and now the 60.3-mm CT is gradually applied to the actual site. Diameter growth should be a key factor in life prediction.18–21 Several factors affecting diameter growth are as follows: (1) diameter growth rate accelerates with the increase in the internal pressure; (2) diameter growth of large-diameter CT is faster than that of small diameter CT; (3) diameter growth of high-strength steel grade CT is slower; and (4) too large bending strain will not accelerate diameter growth, but will accelerate fatigue life damage. With the increase in the bending times, not only the diameter of tubing increases but also the wall thickness decreases, and the material of CT changes. 22
The tubing diameter has certain limits on site operations. Excessive diameter increases do not meet the passability of rollers, goosenecks, injectors, packers, and blowout preventers.23,24
The outer diameter of the CT was measured when the tube emerged from the well. The measurement results are shown in Figure 7. The blue curve indicates the predicted diameter growth, which has exceeded the nominal diameter of 4.8 mm. The red dotted line indicates the warning value for the diameter increase setting. The actual measured values are shown in the yellow area in the figure. The measured value is less than the diameter increase predicted by the fatigue model. It can be seen that the difference between the diameter growth value predicted by the theory and the diameter measured in the field is large. Therefore, the theoretically calculated diameter value is used to calculate the fatigue life, and the result has a certain error with the actual fatigue life.

Comparison between the predicted diameter of coiled tubing and the actual measurement on site.
The fatigue model predicts the increase in the diameter by directly predicting added value or linearly increasing by percentage. It can be seen from this analysis that the diameter value predicted by the model differs from the actual use. Using the real-time measured value of the developed on-site inspection system to calculate the fatigue life of the pipe section will obtain more accurate and reliable calculation results. It can create greater safety benefits and economic value for customers under the premise of ensuring the safety of the tubing operation.
The influence of other factors onfatigue life
Reverse bending
The sagging of the tubing between the drum and the injector causes a reverse bend of the tubing. Reverse bending will increase the strain of the CT and will greatly shorten fatigue life. Accurate prediction of fatigue damage life is the key to evaluating CT operations and scrapping. Fatigue life of CT is mainly determined by the bending strain. Type of CT work machine and the geometry of the well site location determine the bend radius and the location of each job bend. A specific curved shape is shown in Figure 8. Traditional bending includes rollers and goosenecks. If there is a long distance between the roller and the injector, it will cause the CT to sag, causing reverse bending of the CT and aggravating fatigue damage.

Curved geometry above the well site.
If a straightener is not installed, this bending strain is mainly generated by the drum and the gooseneck. In most cases, there is a straightener on the injector, and the straightener uses reverse bending to eliminate the involvement of bending of the CT. However, if a straightener is used, it will cause reverse bending, which will expand the range of strain and seriously affect the fatigue life of the CT. The entire CT changes from the downhole to the exit, and the curvature of the bend changes as shown in Figure 9. It can be seen from the figure that the reverse bend of the droop is much smaller than the reverse bend of the straightener.
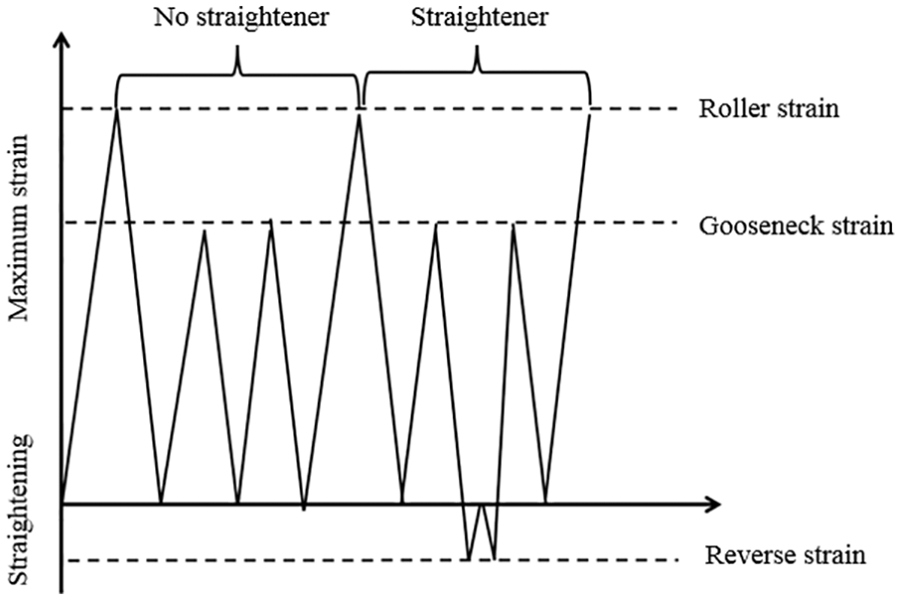
Change history of coiled tubing bending strain.
As can be seen from Figure 9, there is a reverse strain in the straightener. The inverse bending strain can be obtained by calculating the curvature radius of the reverse bend. Tipton et al. 25 describe this problem and give the effect of the straightener on the life. As shown in Figure 10, the straightener reduces life by nearly 30%. However, this degree of influence also requires experimental verification. The reverse bending is also in the elastic strain range, so the fatigue damage is relatively small. And, the straightener can also be removed. At present, many working machines do not recommend the straightener.

Effect of straightener on fatigue life of coiled tubing.
The influence of welds
Welds also have an effect on fatigue life. At present, several major manufacturing factories continue to improve the processing technology, heat treatment technology, and testing technology of the weld seam, the fatigue performance of the weld is improved, and the fatigue failure of the weld is continuously reduced. With the continuous improvement of the CT weld processing technology, the fatigue data of the weld seam need to be tested more, so that the latest weld fatigue basic data are obtained for the fatigue calculation of the weld seam. At present, the fatigue damage of the tubing by manual butt welding is reduced by about 35%. There is almost no need for butt welding to connect pipes in the domestic field, mainly because the on-site welding process cannot meet the requirements. Inclined welds reduce the fatigue life of CT by 80%, so it is important to study the effect of welds on fatigue.
Conclusion
The measured values are utilized to replace the calculated wall thickness and diameter values, and are input into the fatigue calculation model. The field detection system and the fatigue life prediction model are used to evaluate the service status of CT. It can be conveniently applied to the fatigue life assessment of actual defects, eliminating the artificial factors in the existing defect assessment schemes and making it possible for online detection of CT defects and comprehensive fatigue assessment after work.
The method considers the internal pressure and the local strain of the defect, and proposes that the two influence factors of the pressure concentration factor and the strain concentration factor are different from those of the traditional local stress and strain calculation method. At the same time, according to the definition of defect sensitivity factor Q proposed by Tipton, the function relationship between strain concentration factor and defect sensitivity factor Q is established. Combined with the coiled-line online detection system developed in this article, the fatigue life prediction of the defective oil pipe is more accurate by inputting the defect parameters in real time.
This article proposes a hybrid evaluation method for CT service status using field testing system and fatigue life prediction model. At present, the fatigue life diameter growth prediction model and the wall thickness reduction prediction model are only monotonous linear predictions. The actual size of CT under various working conditions can be accurately and quantitatively obtained by calculating on-site test values, which makes the calculated fatigue life become more accurate and reliable. At the same time, this article discusses other factors affecting fatigue life. Combining with detection technology, the accuracy and reliability of fatigue life evaluation are improved, CT is utilized to the greatest extent, and the risk of early scrapping and economic loss is reduced.
Footnotes
Handling Editor: Jie Zhang
Declaration of conflicting interests
The author(s) declared no potential conflicts of interest with respect to the research, authorship, and/or publication of this article.
Funding
The author(s) disclosed receipt of the following financial support for the research, authorship, and/or publication of this article: This work was funded by the Scientific Research Starting Project of SWPU (No. 2018QHZ014) and the National Natural Science Foundation of China (No. 51504207).