
Abstract
In regard to the parameter and tolerance design of an assembly, a previous assumption has been that the structure of an assembly is not subject to any geometrical deformation under application. However, the realized deformation of the structure may well have an impact on the appropriate performance of the assembly. The impact may become even greater when the geometric magnitudes are distributed over an uncertain range. The magnitudes of structure geometry can be represented by the associated parameter and tolerance values. In this regard, this study aims to have the optimal parameter and tolerance design determined all together under the impact of structure deformation through a probabilistic method and mathematical programming formulation. An example of an assembly with mechanical loading for uncertain magnitudes of geometry is chosen for demonstrating the proposed approach.
Introduction
As the industrial sector is currently facing rigorous competition, cost and quality are the major elements of concern. Therefore, manufacturers have thrived when preparing cost-effective methods with the requirement of satisfying customer quality needs. Lately, as the view of simultaneous engineering has been broadly acknowledged, product and process engineers have looked for the achievement of product design and process planning at the same time during the early stage of product progress.1,2 The aims are to cut down the time duration necessitated for initiation initiating a new product into the marketplace, and to reach the least lowest manufacturing cost for a peak quality product.
Since the existence of quality variation is an inevitable phenomenon in the actual production process, it is necessary to take into account the need to maintain low quality variation to ensure an economical product design and process planning.3–5 One possible way of reducing the quality variation and production cost is by means of tolerance design. Besides tolerance values, the mean values also affect the quality and cost of production systems. Because of the dependency between the mean and tolerance of parameter values, these values need to be determined simultaneously in order to guarantee that process manufacturability and performance functionality can be effectively achieved.
However, in some cases, product quality values may change when working under varied environments and factors, such as changing temperatures, human resources, force applied, and so on.6,7 Thus, for example, the structure of a product may be displaced and recovered because of the load and unloading during operations. The parameter values must be assigned in such a way that the product can be dealt with appropriately, according to its functionality. This task becomes even more the most important factor under the combined impacts from structure deformation, quality value variation, and parameter dependency.8–10 Jeang’s recent works2,3 include parameter decisions for assembly. The parameters and tolerance design determined simultaneously will be discussed in the next section on “Background information.” However, their work still does not contain the factor of geometrical deformation under application. This may ultimately still create a quality problem. In this regard, the present approach intends to have the optimal parameter and tolerance design determined all together under the impact of structure deformation through a probabilistic method and mathematical programming formulation.
This study comprises five sections: first section is the introduction; section “Background” describes the relevant background of parameter and tolerance determination needed in this study, and further presents the estimated resultant dimension and resultant tolerance; section “Relationships among stress, strain, and stress–strain” presents the problem formulation of the relationships among stress, strain, and stress–strain, and the application is presented in section “Application.” Finally, a summary is given in the last section.
Background
Concurrent parameter and tolerance determination
In manufacturing, engineers need to set an appropriate product target value T and product tolerance value S to perform tasks appropriately. With the process capability limits, process design engineers must make the process tolerance values t no greater than the product tolerance values so that the capability in producing the workpiece is realized. In other words, a design tolerance which is smaller than the process tolerance will make the production pointless because the completed product will not meet the functionality requirements. 3 Generally speaking, when a producer makes the effort to accomplish high process capability with a narrow process tolerance, a higher production cost is a common consequence. However, when the product tolerance exceeds the process tolerance, extra space for process flexibility makes process deviation available. Thus, the mean value u may be located at various positions within an allowable interval, S–t, which can further cause quality enhancement and the cost to drop. Equations (1)–(3) illustrate the above discussions

The tolerance value t is limited by tL and tU, which denote the upper and lower process bounds, correspondingly. The mean value u is also enclosed within an acceptable range, uU and uL. They are


Let known values tL, tU, UU, UL, S, and T be given ahead of time. Because of equation (1), flexible production planning through the combinations with mean and tolerance values will result. As a result, quality enhancement and cost reduction can be realized. Based on the above discussion regarding equation (1), reliance exists between mean and tolerance on the quality characteristics of interest. The level of reliance is further increased as a result of the effect of design function being varied according to different working environments.
The estimated resultant dimension and resultant tolerance
Owing to an assembled product consisting of components produced by numerous processes, the component mean and tolerance values are decided to make certain that the stack up dimensions of an assembled product occur within adequate quality limits. Because of uncertainty resulting from mean and tolerance values, the stack up assembly dimensions are dispersed probabilistically.
The design functions for an assembly characterize the link between the dependent variable Y and independent variable X. By this connection, the stack up t dimension values can be anticipated from the component mean and tolerance values. Because of the nonlinear design functions in most applications, the approximation functions in estimating UY,
Relationships among stress, strain, and stress–strain
The maximum displacement (strain) δmax results when the maximum stress σmax occurs at given design parameters and due to material properties. 11 The maximum stress σmax or the maximum displacement δmax of a structure is used to evaluate whether the structure under force is in a linear or nonlinear elastic range before permanent deformation (displacement or deflection) results.
Stress for deflection or displacement analysis of structure
Under the condition when the maximum stress (stress) σmax of a structure falls below the yield strength (Ys), the structure deflection or displacement behaves within a linear elastic range. In other words, the deformation will disappear when the mechanical load is removed. Thus, to avoid permanent deformation of a structure, the maximum stress σmax should be less than the material’s yield strength Ys. When the stress at a particular location becomes superior to the strength of the material, there is a danger when the safety factor ratio is below 1. It tells us that under certain areas of the model, the stress is higher than the strength at which the material can be loaded. When the stress in the model is still much lower than the strength of the material, the safety factor remains better than 1 and the model is safe. However, if the safety factor is better than any position in the model, this also indicates that your part may be over-engineered. In this case, this is also undesirable because it only wastes material resources and increases costs. In this study, it has no high-risk needs; it is considered equal to 1, that is

where
That is,

Strain for deflection or displacement analysis of structure
As in the previous discussion, within the elastic range
The parameter values designed for product functionality under a load
However, during a real exercise under loading, there is the possibility that the resulting displacement, δmax, will cause product malfunction because of the dimensions exceeding product specifications, or will cause permanent deformation. As is known, δmax is a function of the design parameter values. Thus, for product parameter design, such as mean and tolerance value determination, there is a need to consider the effects of structure deflection or displacement under loading.
Application
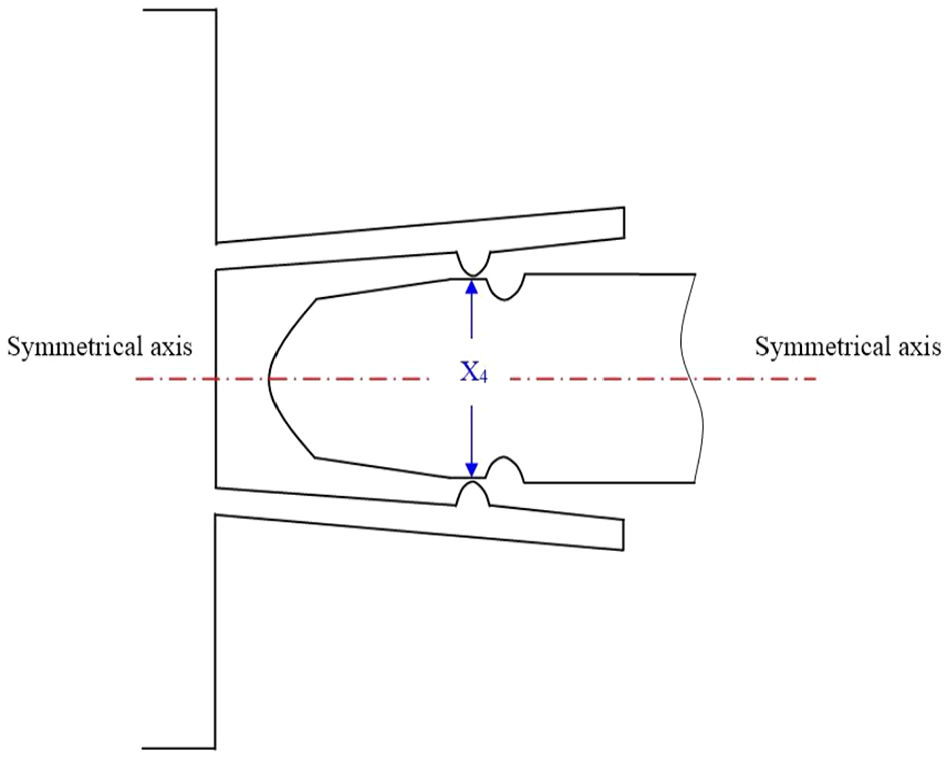
The male and female components, as shown in Figures 1 and 2, respectively, are designed for assembly. The assembly is completed under the stipulation that the structure can be deformed temporarily and recovered thereafter without permanent deformation within the elastic range. Let conditions be: Ys = 400 M (Pa), E = 70 GPa, Poisson ratio ν = 0.33, and density ρ = 2700 kg/m3. The associated parameters, X1, X2, X3, X4, and X5 of the male and female components are depicted in Figures 2 and 3, respectively, and the width and thickness of components exposed are b and h, respectively. The expression h is further defined as X2, as shown in Figure 3. The distance between the two flanges is X1–2X2–2X3. The maximum height at the points B1 and B2 of the male component B is X4. Whenever the points where A3 touches B1 and A4 touches B2 are actualized, the displacement, X6, results. The X6 is the maximum displacement needed for the flange of the structure to complete the assembly. By referring to Figure 3, X6 is


Three-dimensional diagram of component A.
Components A and B are assembled through loading and unloading.

The relative diagram of components A and B before and during assembling.
The standard deviations,


However, the maximum displacement


Let y be defined as the difference between the maximum allowable displacement υmax and the maximum displacement, δmax. To avoid permanent deformation, the displacement δmax of X6 should not exceed the maximum allowable displacement, υmax, that is

The expected value of y is


Assume that
Process ranges for tolerance.

Feasible process ranges for parameter.

Product targets Ti and production tolerances Si for parameter i.


The probabilistic normal distribution of

The probability signifies product successfully performs its functionality.
Maximize


where
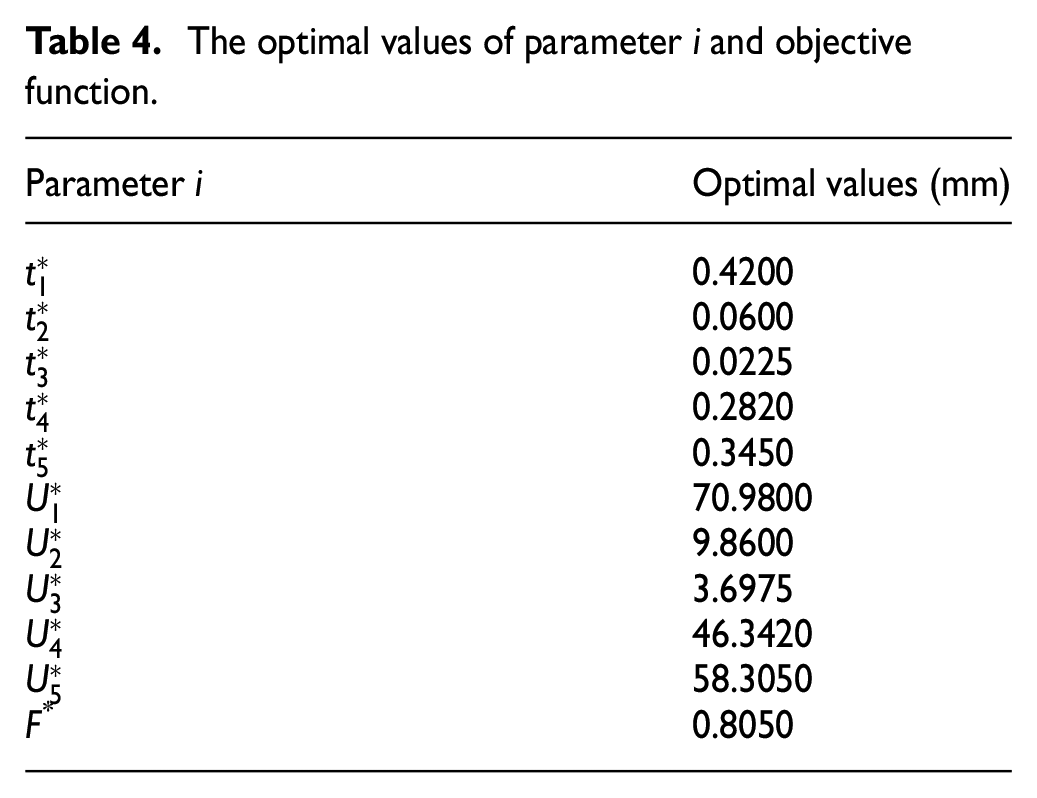
The optimal parameter values and maximum probabilistic F of the proposed approach are shown in Table 4. The problem can be solved by generalized algebraic modeling system (GAMS) without difficulty. 16 The example demonstrates the optimal parameter determination for mean and tolerance design values for assembly under quality uncertainty and mechanical loading.
The optimal values of parameter i and objective function.
Because the offered approach is employed during design engineering courses, it becomes possible to foresee the exact problems of production process, design defects, and fault material provision prior to realizing the production process. In addition, the deficiencies can be identified sufficiently near the beginning to considerably diminish the progress expenses, and the time span from product inception to marketing. Thus, the proposed approach is vital for successfully completing the product design and process planning at the same time in the early stage.
To help the reader apply it in the proposed method, the relevant steps are as follows:
Step 1: Provide information on the design drawings of product.
Step 2: Determine the product quality characteristics and associated measured quality values of interest.
Step 3: The quality characteristics of the controllable variables of interest and the associated measured quality values are determined.
Step 4: The mathematical programming model is developed to derive the optimal parameter and tolerance design determined together under the impact of structural deformation.
Step 5: An example is chosen to demonstrate the proposed approach.
Step 6: The optimization model can be solved. This study used the commercial computer numerical analysis software GAMS to find optimal solutions.
Step 7: Check results and get the optimal process mean and process tolerance.
Summary
Most structures deform under mechanical loading. Hence, stress impact for a product design must be considered for a load. In addition, the produced parameter values are also distributed for uncertain ranges. The controllable design parameters are mean and tolerance determination. Because of the strong relationship between mean and tolerance values, under uncertainty, the loading on product performance turns out to have a more significant impact on the determined parameter values. Thus, the simultaneous optimization of parameter mean and tolerance values under various loads is needed. Because of loading for uncertain parameter designs, the objective function is formulated as the successful probabilities of achieving product functionality with the constraints of process capability and flexibility. The parameter values found in this presented approach are robust against the effects of uncertain variations in achieving product functionality during its life application.
In some cases, physical experiments may become impractical, especially in the early stages of product design and process planning. As computers and software for computer-aided engineering applications continue to expand, it can sometimes replace physical experiments in product design and process planning. Regarding these aspects, the 3D dimension chain can also be extended. It may offer the benefits of reduced experiment costs and rapid product design. Furthermore, in this study, an optimization was developed to have the optimal parameter and tolerance design determined all together under the impact of structure deformation through a probabilistic method and mathematical programming formulation. The objective function is maximizing probabilistic. However, other goals, such as the production cost, will become a multi-objective problem if we want to increase our consideration. Those parts are offered as future research direction.
Footnotes
Appendix 1
Appendix 2
Handling Editor: Ka-Veng Yuen
Declaration of conflicting interests
The author(s) declared no potential conflicts of interest with respect to the research, authorship, and/or publication of this article.
Funding
The author(s) received no financial support for the research, authorship, and/or publication of this article.