
Abstract
The actuation technique of a surface acoustic wave motor with nanometer scale linear motion was experimentally investigated in this study. The surface acoustic wave motor comprised a stator made of a Y+128° cut, X-propagation lithium niobate substrate with silicon sliders and an array of pillar projections manufactured using semiconductor fabrication techniques. Two sets of interdigital transducers deposited on the substrate were used to generate Rayleigh waves with a driving frequency of up to 9.7 MHz. The surface acoustic wave motor was driven by friction exerted on the contact area between the slider and the surface acoustic waves in a retrogressive elliptical locus. The stepping motion of the surface acoustic wave motor was measured directly using a fiber-optic Michelson interferometer through demodulation with a digital signal processing method. A displacement of several nanometers was achieved at each step during the experiment.
Keywords
Introduction
With advances in the fields of science and technology, components have become smaller and more accurate. Peripheral equipment, therefore, also requires constant improvement so that the equipment can continue to work effectively with those enhanced components. Micrometer technologies must be upgraded to nanometer scale to fulfill the demand for high-precision positioning, measurement, and processing. Due to their long-range precision positioning, linear ultrasonic motors can satisfy the need for nanometer-level long-range positioning. The primary components of ultrasonic motors are acoustic waveguides and sliders. Acoustic waveguides are fabricated from piezoelectric materials, and their advantages include high precision, high rigidity, low volume, low weight, high power, high-frequency response, and low energy consumption. Waves transmitted through an acoustic waveguide should have a short wavelength and high frequency to allow nanometer-level actuation.
When surface acoustic waves (SAWs) are transmitted on the surface of a substrate, dielectric surface particles move in an elliptical trajectory. Moreover, the forward-moving acoustic waves exhibit a retrograde motion, which is different from the prograde motion of waves on liquid dielectric surfaces. The basic principle of a SAW motor pertains to the friction exerted by a stator and sliders. This friction allows the sliders to move in the direction opposite to that of wave propagation. The contact force determines the travel rate and thrust of the sliding platform.
Kurosawa et al. 1 successfully manufactured a linear ultrasonic SAW motor in the X–Y plane by using a lithium niobate (LiNbO3) substrate with a Y+127.8° cut. The driving frequencies in the x- and y-axis directions were 9.6 and 9.1 MHz, respectively. Three contact equilibrium sliders were fabricated using 1 mm ruby, steel, and tungsten carbide balls to control the driving voltage and change the travel rate to up to 20 cm/s. Kurosawa et al.2,3 and Chiba et al. 4 used an electromagnet to generate controllable preload on sliders made from 0.5-, 1-, and 2-mm balls. Those researchers examined the optimal forward preload and tangent output between sliders and a stator and used the Hertzian theory of contact to explain basic actions. Morita et al. 5 established an analytical model based on Newton’s laws of motion and conducted numerical analysis to simulate the acting forces exerted between spherical sliders and a stator. Takasaki et al. 6 applied a miniaturization design to a SAW motor and fabricated a 50-MHz-frequency SAW motor with sliders with a travel rate of up to 0.7 m/s. Shigematsu et al. 7 proposed a novel SAW motor design with a minimal stepping distance of 2 nm and improved the precision of the stepping movement. The stepping movement in the proposed model was considered an open-loop control system. Kurosawa et al. 8 introduced semiconductor processing technology and manufactured a silicon slider-based SAW motor with the highest output power yet seen. The silicon sliders had dimension of 4 × 4 mm2, and their surface comprised multiple circular patterns. The maximum output power reached 7.6 N.
A SAW motor is produced by coating a piezoelectric substrate surface with interdigital transducer (IDT) electrodes and applying an appropriate periodic voltage. SAWs are generated due to the electromechanical transformation characteristics of piezoelectric materials. A SAW component normally includes two sets of IDTs with sliders placed between them; sliders can move forward and backward. SAWs generated by each IDT set can be transmitted forward and backward. In practice, sliders are usually driven by SAWs propagating in one direction. SAWs transmitted in the opposite direction can be eliminated using an embedded absorber 9 or a novel two-phase drive design. 10
Shigematsu and Kurosawa11–15 developed and analyzed a contact friction model of a linear SAW motor. Based on the measurements conducted using two sets of laser Doppler vibrometers, the stepping movement of the SAW motor ranged between 10 and 20 nm under a preload of 15 N and driving frequency of 9.61 MHz.
In this study, a 1-mm-thick lithium niobate substrate with a Y+128° cut was used. Moreover, 400-µm stepped interdigitated electrodes (IDEs) and a material with an alternating voltage of 9.7 MHz were employed to generate SAWs transmitted in the x-axis direction. Consequently, the objective of nanometer-level stepping actuation was achieved. The most crucial decision of nanoscale experiments is the selection of a measurement system. In this study, a fiber-optic Michelson interferometer 16 was used to measure the stepping movement. Interference signals at certain intervals were demodulated to solve issues related to micro-step observation.
Basic theory and surface acoustic motor design
Delta function model
The delta function model of IDTs was proposed by Tancrell and Holland 17 and further developed by Royer and Dieulesaint. 18 The model helps to evaluate the frequency response of an IDT, which is important to the preliminary design of a SAW component. The delta function model can be considered in two ways—the central charge impulse of each electrode and the impulse of the electric field between electrodes. The second method was used in the explanations in this study (Figure 1). By assuming that the inter-electrode distance d is not a fixed value and the electrodes are distributed non-periodically, each impulse can be considered as a wave source. The direction of the electric field determines whether the direct ratio of amplitude An generated by the nth wave source to the electrode overlap length w is a positive or negative value. The impulse response of an IDT with Ns wave sources is equal to the following

where Sn represents the sign of the electric field direction and is equal to (−1)n and time tn is the time of a wave path from the impulse to the observation point. The frequency response can be obtained using the Fourier transform


Pulse function analysis model.
The IDT dimensions can be substituted into equation (2) in accordance with the substrate material characteristics (Table 1). The model can be used to estimate the frequency response of an IDT.
Material properties of lithium niobate.

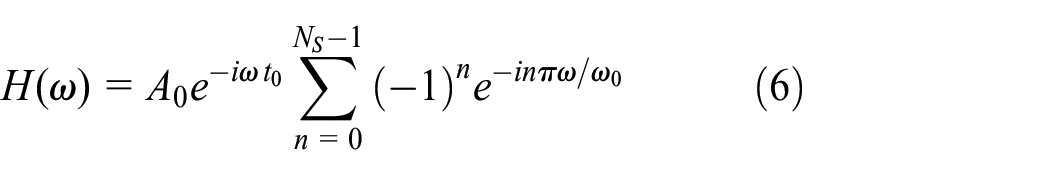
As presented in Figure 2, a single-phase IDT only considers SAWs propagating to the left. If the IDT step is fixed, then we have the following


Schematic diagram of a single-phase IDT.
Because

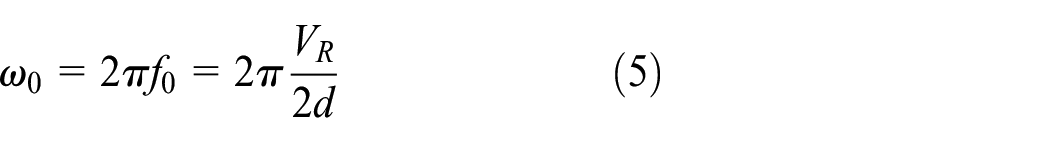

where VR is the SAW phase velocity and ω0 is the angular frequency. The model just described enables simulation of the frequency response of SAWs generated by IDTs through different numbers of electrodes. Figures 3–5 show the frequency responses corresponding to 5, 5.5, 10, 10.5, 15, and 15.5 electrodes. The maximum frequency response can be obtained when the driving frequency of an additional alternating voltage is similar to the center frequency (10 MHz) of the IDT. The center frequency response is proportionally related to the number of electrodes; the amplitude of side lobes also increases proportionally. Moreover, as presented in Figure 6, a high-frequency response can be obtained when the driving frequency is an odd multiple of the center frequency (e.g. 30 MHz). In practice, an x.5 IDT produces an odd number of electric field impulses on the piezoelectric component surface and can generate pairs of SAW crests and troughs; therefore, such IDTs are often used.

Simulation results of the frequency response of IDTs with 5 and 5.5 pairs of electrodes.

Simulation results of the frequency response of IDTs with 10 and 10.5 pairs of electrodes.
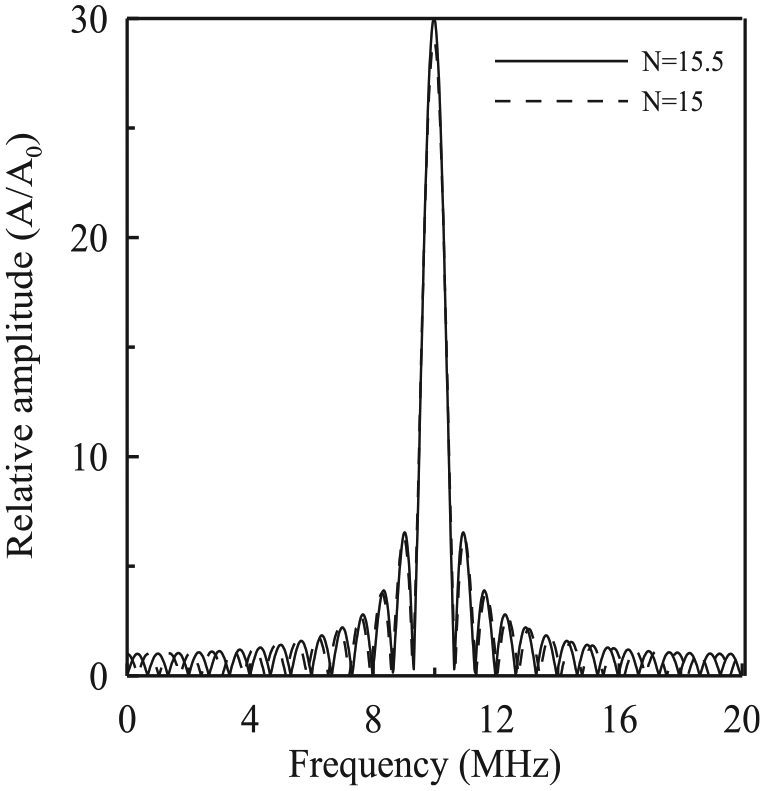
Simulation results of the frequency response of IDTs with 15 and 15.5 pairs of electrodes.

Simulation results of the expanded frequency response of IDTs with 10.5 pairs of electrodes.
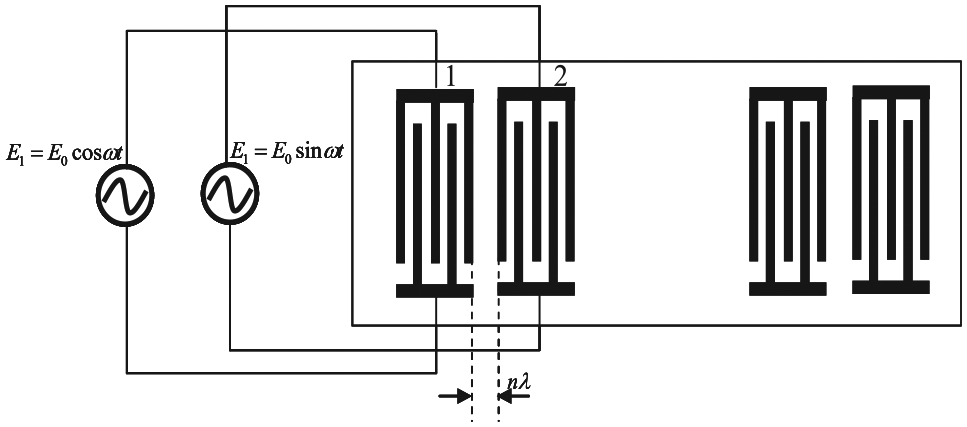
IDTs require SAWs to be transmitted in one direction. However, a single-phase IDT can generate SAWs in two directions. Thus, in this case, the SAWs in one of the directions are unnecessary. Backward waves at the substrate edge may interfere with directly propagated SAW signals. Thus, two-phase IDTs were developed (Figure 7). The two sets of IDTs have different drive sources. In the case of an appropriate time delay of the driving voltage, an appropriate interval is maintained between the two sets of IDTs. Such IDTs remove SAWs transmitted in the opposite direction, thus retaining only the SAWs transmitted in one direction.
Schematic diagram of a two-phase IDT.
Assume that two sets of IDTs are separated by one wavelength (or a multiple of wavelengths) (Figure 7) and waves are propagated to the right. Then, the second set of IDTs lags behind the first set by 1/4 of the cycle

where
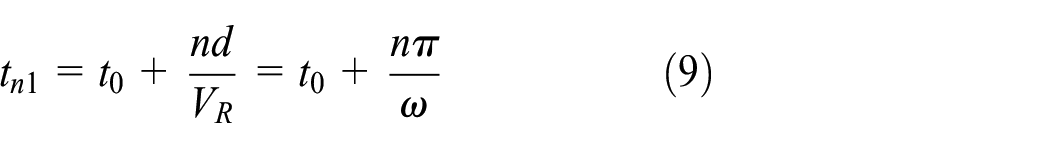
and

where the difference between tn1 and tn2 represents the phase time difference between drive sources.
The delta function model was used to simulate two-phase IDTs. Each IDT set had 5.5 pairs of electrodes. The interval between the two sets was one wavelength (nλ), where n is a positive integer that is greater than 0. A frequency response figure similar to Figure 8 was obtained. The highest energy level was observed at approximately 10 MHz. A comparison between the two-phase IDTs with 5.5 pairs and the single-phase IDT with 10.5 pairs, shown in Figure 4, revealed that the two-phase IDTs exhibit greater side-band loss.

Simulation results of frequency response of a dual-phase IDT with 5.5 pairs of electrodes.
IDE design and testing
Semiconductor processing was used to manufacture IDTs. A photomask was applied to determine the shape of the transducers. The accuracy of photomasks produced using quartz glass is a linewidth of 3–4 µm or greater. In this study, the linewidth of the IDTs in the SAW motor was 100 µm. The use of a plastic shadow mask to produce electrodes can lower the manufacturing costs and increase the linewidth accuracy up to 15 µm.
Figure 9 and Table 2 present the figure and parameters of the IDE photomask design. The number of electrodes (N) was 10.5 pairs, as presented at the top of Figure 9. The bottom of Figure 9 illustrates the design described in the previous section, which reduces interference from marginal reflections and is applicable to SAW motors without absorbers. The SAW motor in this study was designed on a lithium niobate surface with a Y+128° cut. The thickness of the base material was 1 mm, the width of the IDEs was 100 µm, the length of the SAWs was 400 µm, and the center frequency was approximately 10 MHz. The use of a thicker lithium niobate enabled production of IDEs with lower center frequencies, which generate SAWs with longer wavelengths.

Design of the IDT electrode mask.
Design parameters of the pulse function model.

Figure 10 presents an IDT manufactured using a plastic shadow mask. The SAW device was fixed on an acrylic plate. IDTs on the two sides were connected to a 50-Ω cement resistor. The actual quality of IDTs should be assessed because their accuracy could be lower than that obtained when a photomask is used. In designing an IDT, its operating frequency is usually estimated based on the wave velocity on a lithium niobate surface in a certain direction. In practice, this wave velocity value may be inaccurate. Frequency shifts caused by wave propagation loss and electrode reflections should be considered during experiments. In this study, the theoretical value of the surface phase velocity in the SAW device was 3.906 mm/µs, and the corresponding operating frequency was 9.765 MHz.

Exterior photo of an IDT with a finished plastic evaporation mask.
The ratio of the output and input signal amplitudes in the SAW device with IDEs is defined to be S21

Schematic diagram of the measurement architecture of the frequency response S21 of the IDT.

Full-range decibel map of the simulation results of frequency response of the single-phase IDT with 10.5 pairs of electrodes.

Partial decibel map of the simulation results of frequency response of the single-phase IDT with 10.5 pairs of electrodes.

Measurement results of the S21 frequency response of the SAW component.

Wavelet conversion result of the S21 frequency response simulation of a SAW component.

Comparison of the measurement results and wavelet conversion results of the S21 frequency response of a SAW component.
Analysis of wavelet transform signals
Wavelet transform is a widely used method for performing time–frequency analysis that is suitable for expanding transient continuous functions. A wavelet transform is performed by utilizing a mother wavelet function as a kernel function. The mother wavelet function shares a generalized cross-correlation with transient signals, and signal components that are similar to the mother wavelet can be extracted. These components have different levels of resolution under different frequencies. The continuous wavelet transform is expressed as follows

where
In practice, a wavelet transform maps the transient signal, f(t), to the wavelet transform coefficients of each frequency component. Moreover, the b value corresponding to the peak of the signals envelope is the wave path time at which the frequency wave packet arrives at the receiving point. In this study, the Gaussian pulse wave was used as the mother wavelet function, and its mathematical form is presented as follows

where

Mother wavelet function of the Gaussian pulse wave.

Correspondence diagram of the output signal of the SAW component and the envelope after wavelet transform (9.725 MHz).

Correspondence diagram of the output signal of the SAW component and the envelope after wavelet transform (9.0 MHz).
Measurement results of the surface acoustic motor
SAW component driving method
The instrument for estimating the characteristics of the SAW motor is displayed in Figure 20. A 50-Ω high-power resistor was connected in parallel with the IDT input to match the output impedance of the waveform generator to avoid having the IDT bear all the power consumption. Based on the measurement result of the signal, if the sine wave voltage driver was used, the output of the IDT had the largest amplitude at the center frequency, which was slightly lower than the frequency calculated using the pulse theory model. Moreover, applying toothpaste to the edges of the SAW component as an energy absorber of the acoustic wave led to optimal results, as presented in Figures 21 and 22.
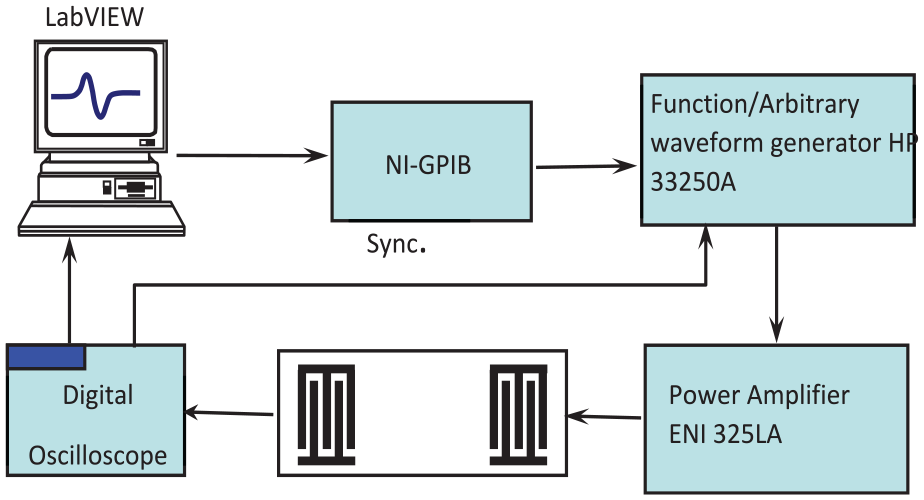
Schematic diagram of the test device for the SAW motor.

Receiving end signal of IDT without an absorbing coating.

Receiving signals of IDT with two absorbing coated edges.
The burst function of the arbitrary waveform generator, as displayed Figure 23, was used to make the stepping movements of the slider. The amplitude of the SAW and the magnitude of stepping movements can be adjusted by changing the number of sine waves and the magnitude of the applied voltage. The burst cycle duration should be greater than the product of the number of sine waves and the sine wave cycle, and the two values should not be too similar. Otherwise, continuous signals are generated. This study employed an NI-GPIB card to connect to an arbitrary waveform generator, write the NI-LabVIEW program, set the burst function, and control the operation of the overall measurement system.

Driving signal of the SAW motor.
The magnitude of the tangential force applied to the slider by the SAW is based on the friction between the substrate of the SAW component and the slider and the magnitude of the preload applied to the slider. According to one study, 4 the magnitude of the force must be maintained at a certain value. If the value is too large or small, the movement of the slider is hindered. To apply a precise preload, a load cell LTS-500GA (Kyowa Electronic Instruments Co., Ltd, Tokyo, Japan) was used as the sensor to form an adapter mechanism at the force end for connecting the slider and the load cell. To stabilize the system, a fixed structure was made to join the load cell and slider tightly. However, a disadvantage was that the slider surface and the surface of the component substrate could not be joined completely because the slider surface was not coplanar with the substrate surface. The design of the adapter element is displayed in Figure 24. By applying a preload, the slider and the adapter element could be joined tightly, as displayed in Figure 25. As shown in Figure 26, the load cell was placed on a linear mobile platform, and the position of the platform was adjusted to apply the preload to the slider. After the force was applied, a Wheatstone bridge inside the load cell converted the resistance change of the load cell into a voltage signal. Through the circuit of the instrumentation amplifier AD620 (Analog Devices, Inc., Norwood, MA, USA), the signal was amplified and converted to an actual power value by reading the signal through a multi-meter or an oscilloscope.

Design of the adapter element between the load cell and the slider.

Schematic diagram of the adapter element.

Photograph of the load cell and mobile platform.
By allowing the substrate of the SAW component to move relative to the slider, two experimental structures can be realized: (1) fix the SAW component and move the slider; (2) fix the slider and move the SAW component. The first design is similar to that of an ideal SAW motor. However, a disadvantage is that the load cell must move together with the slider, and the complex structure must be designed to achieve the movement of the slider. The second design has an advantage because it does not require a bulky structure, thus reducing the weight of the slider. However, the disadvantage is that the movement of the slider cannot be fully displayed. In this study, the second method was used. The displacement accuracy of the slide track is another factor that affects the driving performance. Because the stepper displacement driven by the SAW motor is only a few nanometers, a low-resistance slide track with insufficient precision cannot be used. In this study, a cross-roller table THK VRT-1035-A (Victor Group, Mumbai, India) was used because of its high precision and its ability to reduce left and right sway caused by linear movement of the track bearing.
The slider used in this study is based on a silicon wafer and was fabricated using a micro-electromechanical process, as displayed in Figures 27 and 28, to ensure that the lithium niobate substrate of the SAW component was in full contact with the surface of the slider. The surface of the slider had many circular patterns with a height of 5 µm. The size, spacing, and total number of the patterns varied to test the displacement under different surface conditions.
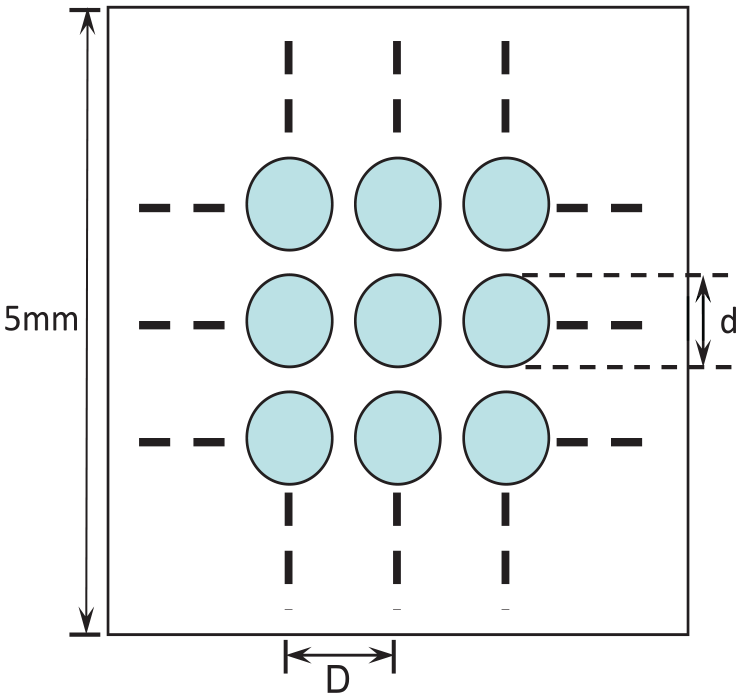
Schematic diagram of a silicon crystal slider with a bump array.

Photograph of a silicon crystal slider with a 53 × 53 bump array.
Fiber-optic Michelson interferometer
When light is transmitted through an optical fiber, the difference in the refractive index between the core and cladding is utilized for light to have total reflection in the core. Thus, light can be transmitted through optical fibers, as presented in Figure 29. When light passes through the interface of two materials with different refractive indices, it produces partial reflection, and a small portion of light advances along the interface. When the angle of the incident light is greater than the critical angle, total reflection occurs. During total reflection, most of the energy is reflected by the interface, and part of the energy is advanced along the interface. According to Snell’s law, the refraction of light between the fiber core and the cladding interface must satisfy the following relationship

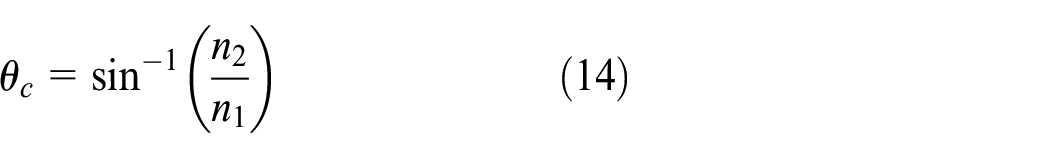
where
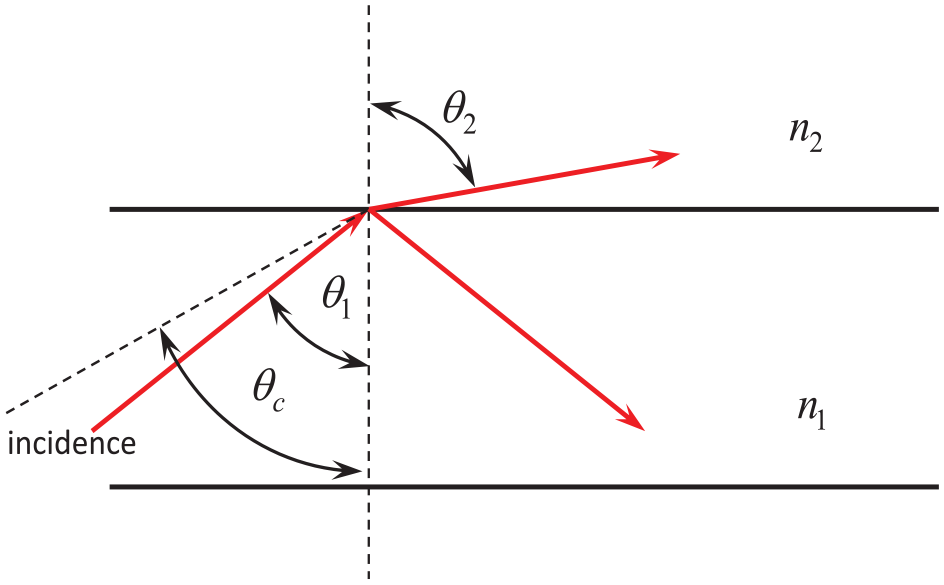
Refraction and reflection of light between the cladding and the core.
When light is emitted from the fiber end of a fiber-optic Michelson interferometer, different angles of refraction are generated due to different incident angles, which affect the amount of refractive energy. Assuming that the interferometer is operated in normal air, as presented in Figure 30, the reflection and refraction between the core and air interface can be expressed by the following relationship


where

Refraction and reflection of light between air and core.
The basic principle of the fiber Michelson interferometer is displayed in Figure 31, as the incident light source passes through the fiber to reach the fiber connector (FC). When light passes through the ceramic connector, a reflection beam #1 that is reflected back to the fiber and a transmission beam #1 that penetrates the interface are generated. If transmission beam #1 is reflected by a reflective mirror, reflection beam #2 is generated. Under appropriate conditions, the optimal result is that the normal lines of the end face of the fiber and the reflective mirror are parallel, reflection beam #2 is reflected to the end face of the fiber, and part of the energy enters the fiber to generate transmission beam #2. Then, reflection beam #1 and transmission beam #2 form the two input interference light beams for the fiber Michelson interferometer. If the energy of the two beams is strong, the interference signal becomes more obvious. Considering the light intensity, if the optical path difference is greater than the coherent length of the light source, no interference occurs and the received signal is only the overlapping energy sum of the two light beams. The coherent length of the light source can be calculated using the following formula


where

where


where

Schematic diagram of a fiber-optic Michelson interferometer.
In this study, a laser diode (BenQ Co., Taipei, Taiwan) with a wavelength of 1550 nm was used as the light source, a Model 500 Series Laser Diode Driver (Newport Co., Irvine, CA, USA) was used as the current driver, a Model 300 Series Temperature Controller (Newport Co.) was used as the temperature controller, and a New Focus Model 1801 Photoreceiver (New Focus Co., San Jose, CA, USA) was used as the light receiver. A fiber-optic isolator (FOCI Fiber Optic Communications, Inc., Hsinchu, Taiwan) was employed to prevent the light energy from being reflected back to the laser diode by the measurement system. The hardware architecture is displayed in Figure 32. The interferometer connection methods were fusion welding (energy loss measured by conducting a test should be less than 0.03 dB) and the use of a modular fiber-optic FC connector. The half bandwidth of the light source was 0.045 nm, and the coherent length,
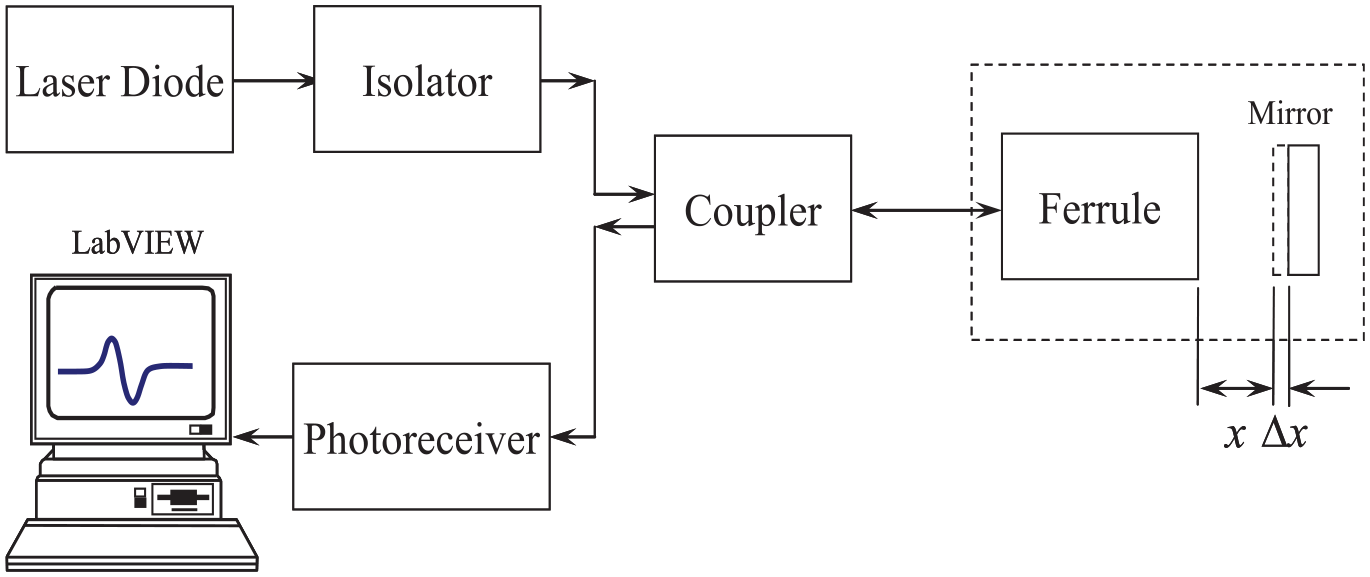
Experimental architecture of the fiber-optic Michelson interferometer.
The photodetector was operated in DC mode. The DC signal was drawn into a map at a suitable sampling frequency in accordance with the moving speed of the reflective mirror, and the interference signal represented by equation (21) was obtained. The actual optical interference signal contained a high amount of noise. To obtain an optimal interference signal, the parallelism between the ceramic connector and the reflective mirror was considered, specifically under the principle that the shorter the distance, the better. If the wavelength of the light received by the photodetector was that of invisible light, although the effect would not be significant, it would still be necessary to consider the energy generated by the general light source in the receiving band of the photodetector. In this experiment, a 16-bit NI-DAQ 6036E data capture card (National Instrument Co.) was used to capture the optical interference signal. The maximum capture frequency was 200 kHz, which is eminently suitable for capturing the interference signal generated by the stepping displacement of the SAW motor used in this study.
An interference signal with a phase difference of

Schematic diagram of the Michelson interferometer transfer function and quadrature phase point.
A PZT push rod was employed as a tool to search the quadrature phase point of the interferometer, as displayed in Figure 34. First, the PZT push rod was driven to produce a constant speed movement so that the phase change of the interference signal was between 0 and

Schematic diagram of the interferometer test.

Interference signal corresponding to PZT push rod displacement.

Cosine function signal after normalization of the interference signal.
Cosine function signal is demodulated into actual displacement.

Flow-chart of displacement demodulation.
The PZT push rod defines the initial phase of the interferometer near the quadrature. The signal of the quadrature phase point was normalized to 0. Due to the main argument limit in the numerical program,
The directionality of the displacement cannot be determined by simply observing the interference signal; however, this action can determine the direction in which the PZT push rod is actuated. The displacement of the reflected object causes a difference of positive or negative slope in the interference signal near the quadrature phase point. A positive slope, which presents an increase in intensity signal of the interference, indicates that the reflective mirror is near the fiber probe. By using this slope, the actual moving direction of the object to be tested can be identified. The PZT push rod is used not only to identify the quadrature phase point but also to determine the direction of displacement. Moreover, the interference signal obtained by the PZT push rod is required for determining the positive and negative movement of the motor.
Movement result of the SAW motor
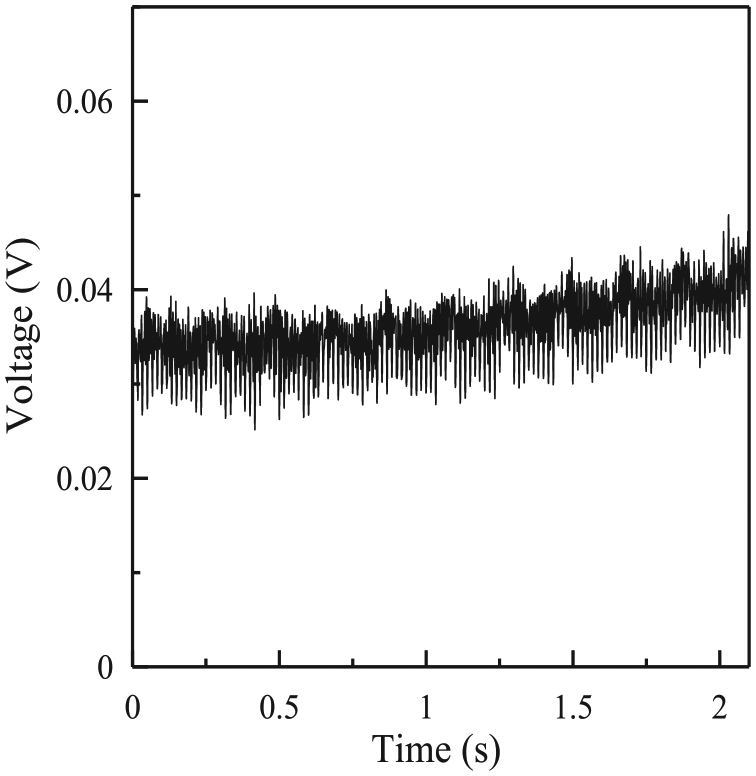
The hardware structure of the SAW motor is displayed in Figure 39. An NI-LabVIEW graphics control program was written using an NI-GPIB card and NI-DAQ 6036E card for the drive measurement system. The overall automated measurement system, as presented in Figure 40, can be divided into two subsystems—the SAW motor driver and fiber-optic Michelson interferometer displacement measurement. The arbitrary waveform generator operated in the burst mode and drove the SAW motor to produce a stepped displacement. First, the interference signal of the undriven SAW motor was removed, as presented in Figure 41. The spectrum of the signal was obtained using fast Fourier transform (FFT), as presented in Figure 42, with large peak values near 60, 120, and 180 Hz. The built-in digital filter in the NI-LabVIEW program was used to filter noises near the 60, 120, and 180 Hz frequencies and high-frequency noises.

Schematic diagram of the SAW motor drive and measurement mechanism.

Flow-chart of the SAW motor drive and measurement control.
Signals measured when the SAW motor is not driven.

Frequency response diagram through the FFT.
The digital filter can be considered a finite impulse response (FIR) filter and an infinite impulse response (IIR) filter based on the impulse response. The output of the FIR filter is only related to the input signals of the current and past time, and the IIR filter is also related to the past output signals. The IIR filter has a recursive relationship and is superior to the FIR filter in terms of the filtering effect. The general formula of the IIR filter is as follows

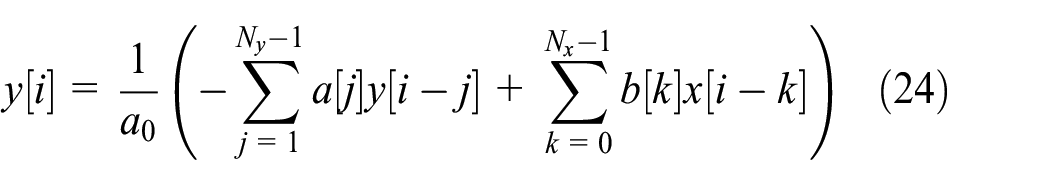
where
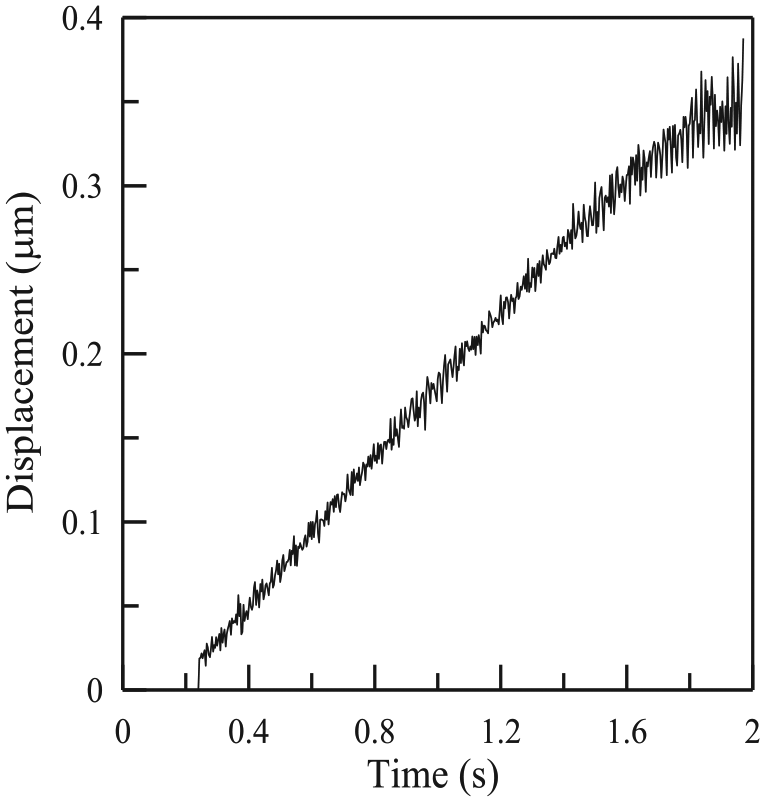
Figure 43 displays the interference signal measured by driving the SAW motor. After conducting the aforementioned demodulation procedure, the true displacement displayed in Figure 44 was obtained. Moreover, the filtered result shown in Figure 45 was obtained using the IIR digital filter. Thus, to observe the improved displacement data, the signal after the initial delay time was selected to obtain the micro-stepping response of the surface acoustic motor, as displayed in Figure 46. However, some unnecessary noises remained. When a group of burst SAWs passes through the slider, theoretically, transient oscillations should be generated. The ideal initial time should be selected before the start of the burst signal to obtain a near-static behavior. When the partial displacement section extracted as shown in Figure 47(a) was divided by the number of steps in this interval, a single-step displacement of 2.74 nm was obtained.
Interference signal from a driving SAW motor.

Actual displacement signal obtained after demodulation.

Signal obtained after filtering out all the noise.

Step displacement of the selected SAW motor.

Cosine transfer function relationship corresponding to Nos. 1 and 9 step displacement in Figure 46. (a) Actual displacement of the SAW wave motor; (b) normalized signal from (a); (c) cosine transfer function corresponding to the amplitudes of Nos. 1 to 9 step displacement in (b); and (d) application of the interval described in (c).
To operate the fiber-optic Michelson interferometer, the PZT push rod must first be moved to obtain one cycle of the interference signal. The quadrature phase point was defined at half of the sum of the maximum and minimum interference signals, and the corresponding voltage load was the voltage applied to the PZT push rod. In Figure 47(b), the normalized interference signal values of Nos. 1 and 9 are −0.2059 and −0.0296, respectively. The linear regression of those values seen in Figure 47(c) is represented by the line displayed in Figure 47(d)

where Y is the size of the normalized interference signal, X is the phase angle (unit: rad), and the mean square error is
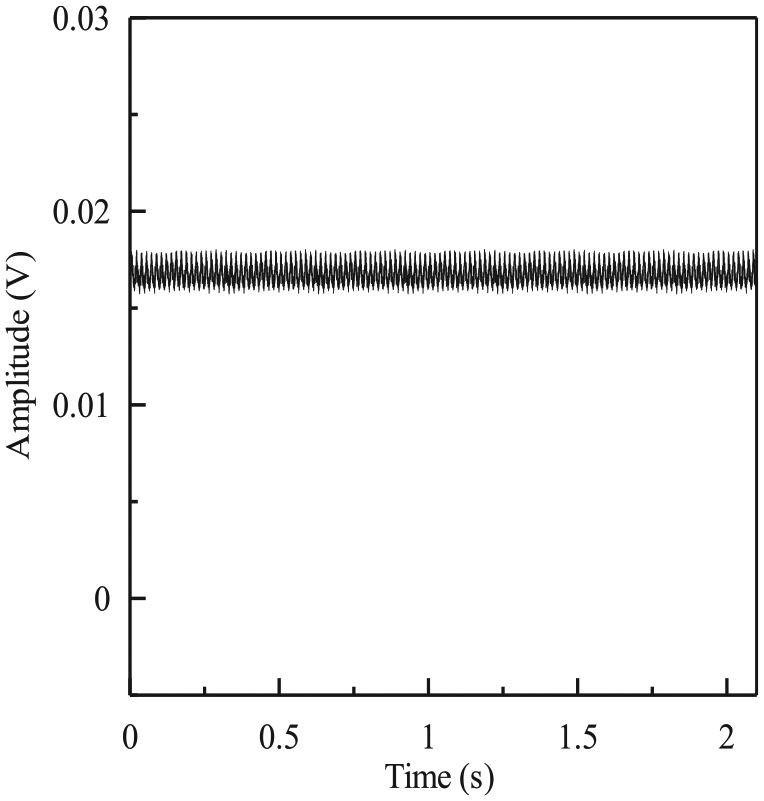
From the experiments, it was observed that if the magnitude of the voltage amplitude applied to the IDT or the number of sine waves driven was insufficient, relative displacement of the slider of the SAW motor could not occur. In the testing stage, continuous sine waves were used to perform a preliminary test under appropriate driving voltage conditions. If short-term displacement could not be observed, the driving time of the SAW motor could not be extended. The interference signal for long-time driving, as presented in Figure 48, was obtained under the following conditions: driving voltage of 0.5 Vpp, sine wave with a gain of 50 dB, number of burst cycles of 5000, burst duration of 0.1 s, and number of bursts of 1200. If the design of the mechanism was appropriate, a stable displacement signal was obtained, and the step displacement test could then be initiated.
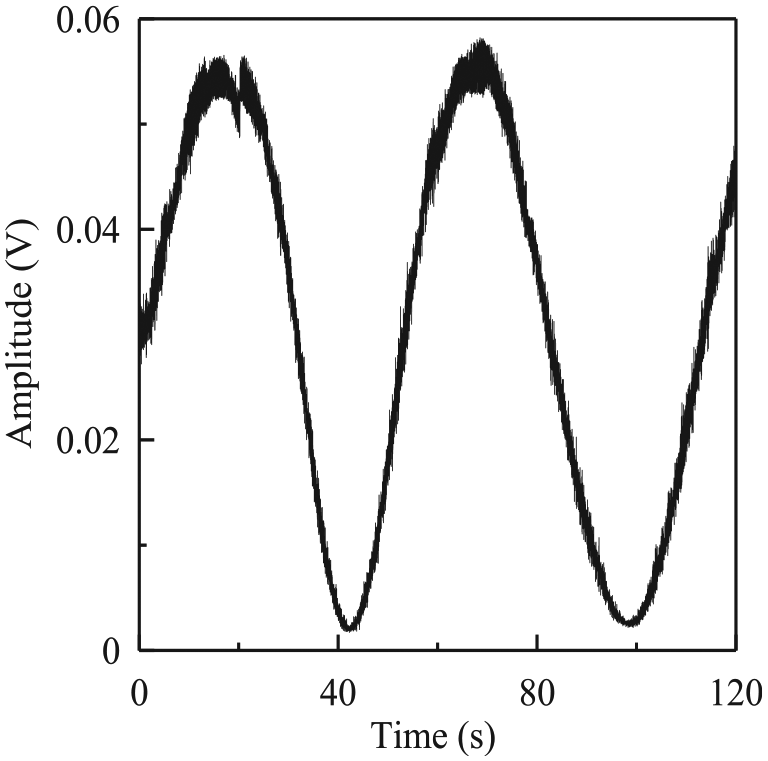
Interference signal obtained after driving the SAW motor for a long period.
The driving voltage and number of burst cycles could be set using NI-LabVIEW graphical control software. In automated measurement of SAW motors, only the preload is not included in the program. The program uses the given number of burst cycles as the outer loop and the applied voltage as the inner loop and captures the number of burst cycles and the applied voltage as the two-dimensional data of the input variables.
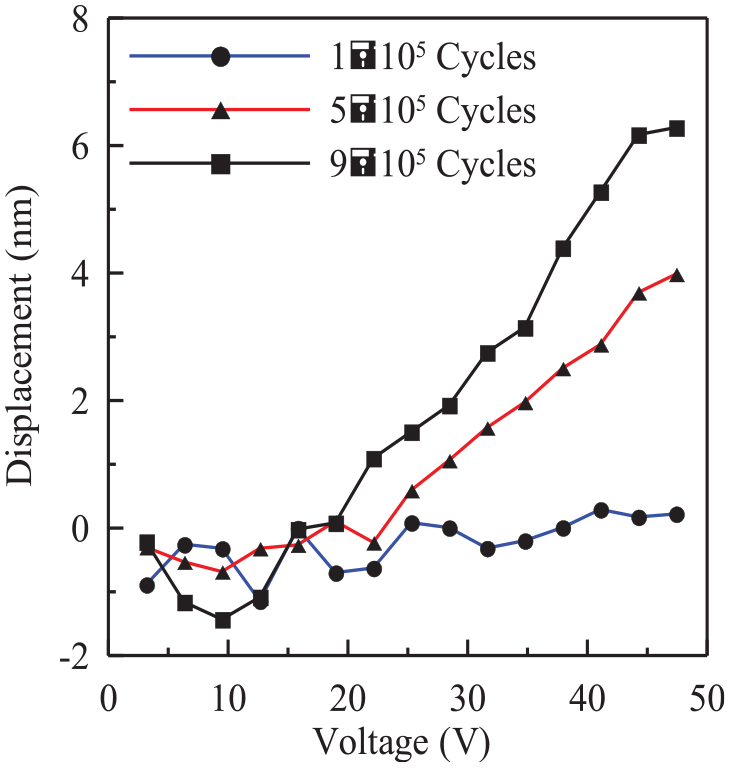
In this study, two sets of silicon crystal sliders with arrays of 53 × 53 and 23 × 23 were designed, respectively. Based on the different preloads, two sets of step displacement results, presented in Figures 49–56, were obtained. In these figures, the horizontal axis is the amplitude output of the arbitrary waveform generator. Through a 50-dB gain of the power amplifier ENI RF 325LA (Bell Electronics NW, Inc., Renton, WA, USA), the amplitude was amplified by 316 times; the number of burst cycles was 100,000, 500,000, and 900,000; and the burst duration was set to 0.2 s. If the driving voltage was too small, the movement effect of the SAW motor was poor, and the interference signal measured mostly external disturbance noise. Conversely, if the driving voltage was increased, the step displacement notably increased. This implies that the driving voltage is the most important actuating factor. If the number of burst cycles was very low, the effect of the driving voltage on the step displacement was reduced. When the number of burst cycles was 100,000, the SAW motor exhibited a more irregular stepping motion. Thus, a higher amount of noise was included.
Step displacement results of a 53 × 53 bump array silicon crystal slider bearing a preload of 175 g under different numbers of burst cycles.

Step displacement results of a 53 × 53 bump array silicon crystal slider bearing a preload of 330 g under different numbers of burst cycles.

Step displacement results of a 53 × 53 bump array silicon crystal slider bearing a preload of 425 g under different numbers of burst cycles.

Step displacement results of a 53 × 53 bump array silicon crystal slider bearing a preload of 590 g under different numbers of burst cycles.

Step displacement results of a 23 × 23 bump array silicon crystal slider bearing a preload of 175 g under different numbers of burst cycles.

Step displacement results of a 23 × 23 bump array silicon crystal slider bearing a preload of 330 g under different numbers of burst cycles.

Step displacement results of a 23 × 23 bump array silicon crystal slider bearing a preload of 425 g under different numbers of burst cycles.

Step displacement results of a 23 × 23 bump array silicon crystal slider bearing a preload of 590 g under different numbers of burst cycles.
Figure 57 presents the experimental results of step displacement and voltage load for the 53 × 53 array of silicon crystal slider subjected to preload. Figure 58 displays the experimental results of the 23 × 23 array of silicon crystal slider. The preload in this experiment was between 0 and 650 g. Within this range, the preload had a limited effect on the step displacement of the SAW motor. A comparison between the step displacements of the silicon crystal sliders of the 53 × 53 and 23 × 23 arrays under the effect of the 175-g preload is shown in Figure 59. Furthermore, Figure 60 displays the experimental results of a silicon crystal slider under a preload of 270 g and a number of burst cycles of 500,000. From these figures, it is apparent that when the voltage was 47.4 Vpp, the step displacement of the silicon crystal slider of the 53 × 53 array was approximately 4–5 nm and the step displacement of the silicon crystal slider of the 23 × 23 array was approximately 6–7 nm. Thus, the performance of the silicon crystal slider of the 23 × 23 array was better.

Experimental results of the step displacement and voltage load of the silicon crystal slider of a 53 × 53 bump array subjected to preload.

Experimental results of the step displacement and voltage load of the silicon crystal slider of a 23 × 23 bump array subjected to preload.

Experimental results of the step displacement and voltage load of a silicon crystal slider with different bump arrays subjected to a preload of 175 g.

Experimental results of the step displacement and voltage load of a silicon crystal slider with different bump arrays subjected to a preload of 590 g.
Conclusion and discussion
This study employed semiconductor process technology to fabricate an IDT on the surface of lithium niobate to generate high-frequency SAWs. Through the positive contact force between the stator and the slider and the consequent friction, the slider was pushed to move linearly. The actuation principle and technology of applying SAW components to long-stroke and nanoscale stepping and the use of a fiber-optic Michelson interferometer to measure the step displacement characteristics of a SAW motor were also discussed.
When designing IDTs, the pulse theory model can provide a fairly rapid and accurate estimate of the frequency response of SAW components. To describe the wave propagation behavior of IDT actuation accurately, the coupling theory model can be used. However, the SAW signal is captured by the IDT receiving end, and consequently, the true wave behavior of the SAW cannot be observed. To investigate the SAW characteristics fully, an appropriate system should be used to measure the out-of-plane displacement and transmission speed of the SAWs directly.
Factors affecting the performance of a SAW motor can be divided into two aspects—mechanism composition and driving mode. These aspects are highly influenced by institutional composition factors, and the influence of mechanism composition factors is higher than that of the driving mode factors. The mechanical composition factors include the parallelism of the slide track relative to the displacement of the slider, the perpendicularity of the SAW component and the preload applying mechanism, and the type of joint between the slider and the load cell. The primary component of the mechanism is the slide tract that supports the slider for horizontal movement, whereas an ideal slide track does not change its nature in any position. A stable friction coefficient between the sliding block and slide tract is preferable. The maximum static friction coefficient between the two should not be very large; otherwise, the initial motion of the slider will be stagnant or have an instantaneously large displacement. The following should be noted when selecting a slide track:
The friction coefficient between the sliding block and the slide track should be small. The general slide track has a relatively large sealing resistance, which leads to an increase in resistance, and is not suitable for a low-thrust SAW motor;
A lightweight sliding block should be used because it can reduce the influence of inertial force on motor performance and speed up the reaction;
High-precision linear movement should be realized. If the precision of the working direction of the linear slide track is insufficient, it will lead to inaccurate linear movement.
This study employed a fiber-optic Michelson interferometer to measure the step displacement of a motor. By processing the measured interference signal using a digital filter, a larger step displacement can be observed. However, the interference signal will be mixed with obvious noise. If the signal-to-noise ratio can be reduced, the resolution of the interferometer can be improved. In this study, a PZT cylindrical push rod was used to determine the quadrature phase point of the interferometer transfer function, which can achieve rapid and accurate positioning of the fiber-optic Michelson interferometer.
The driving parameters of the SAW motor include the preload, driving voltage, and number of burst cycles. The experimental results confirm that the driving voltage is the most important parameter, and the influences of different preloads have no significant difference within the experimental range. If a higher number of burst cycles was used along with moderate voltages, the stepping behavior of the SAW motor could be clearly observed. If the number of burst cycles was small and the voltage high, subjected to the performance of the interferometer, only cumulative displacement for a long period could be obtained, and the behavior could not be observed when the step displacement occurred. To obtain a more precise step displacement, a measuring tool with a high resolution was required. A multi-axis measurement was performed; thus, the complete step displacement information was obtained simultaneously, which helped in analyzing the overall dynamic behavior of the SAW motor. In the future, the optimal combination of operating parameters may be obtained using this technique to enable rapid movement and precise positioning of the slider.
In summary, the most crucial part of a SAW motor system is the contact between the slider and the stator. Establishment of a contact friction model is related to the design of the stator. To design a new stator, a new model is required. Moreover, if necessary, finite element software can be employed to analyze the contact force. Based on the existing ultrasonic motor theory, the mechanical model between the slider and the stator is incomplete, and the contact stress change and the force relationship caused by the SAW cannot be fully presented. Therefore, the creation of an accurate model will be the goal of the future study.
Footnotes
Acknowledgements
The author would like to sincerely thank the Ministry of Science and Technology of Taiwan for funding this research.
Handling Editor: James Baldwin
Declaration of conflicting interests
The author(s) declared no potential conflicts of interest with respect to the research, authorship, and/or publication of this article.
Funding
The author(s) disclosed receipt of the following financial support for the research, authorship, and/or publication of this article: This study was financially supported by the Ministry of Science and Technology of Taiwan (MOST; No. 107-2221-E-239-035).