
Abstract
When the aircraft opens the bay door to let the landing gear either drop or retract, the incoming flow will result in a significant amount of coupling noise from the bay and the landing gear. Here, an experimental study was reported to characterise the acoustic performance and flow field at low subsonic speeds. Also, we examined a passive control method leading-edge chevron spoiler to suppress the noise. The experiment was performed in a low-speed aeroacoustic wind, the bay was simplified as a rectangular cavity and the spoiler was mounted to the leading edge. Both acoustic and aerodynamic measurements were performed through two microphone arrays, pressure transducers and particle image velocimetry. It was found that installation of the landing gear model can attenuate cavity oscillation noise to some extent by disturbing the shear layer of the cavity leading edge. Moreover, acoustic measurement confirmed the noise control when the spoiler was used. In addition, a parametric study on the effects of chevron topology was performed, and an optimised value was found for each parameter. From the aerodynamic measurement, the noise reduction was explained from the perspective of fluid dynamics. It was observed that installation of the chevron can raise the leading-edge shear layer and break up the large-scale vortices, thereby controlling the Rossiter mode noise and the landing gear model noise at certain frequencies.
Keywords
Introduction
The landing gear, which is designed to support an entire load of a landed aircraft on the ground, has been identified as a significant source of the airframe noise.1–5 Besides, current landing gear is commonly retractable, that is, when not needed during flight, the undercarriages will retract into the wings or the fuselage, concealed behind doors. The space for concealing the retractable gears is termed as the landing gear bay. However, the bay can generate cavity noise when the incoming flow passes, regardless of the flow speed.6,7
Research on the landing gear bay noise can date back to the 1970s,8,9 and the cavity oscillation has been recognised as the main characteristic of the noise generation. More specifically, when an incoming flow passes an open cavity, the separation occurs from the leading edge. The Kelvin–Helmholtz instability can result in vortices within the turbulent shear layer, which can develop and span to the whole length of the cavity opening. When it reattaches to the trailing edge, the impingement will radiate acoustic waves, propagating to all directions including the upstream. As they reach the front edge, the incident acoustic waves act as the perturbation and trigger the generation of other instabilities. This feedback mechanism will produce a few tones at different frequencies.10–12
Noise control of the landing gear and bay noise is an important research area in the aeroacoustic studies, and to date, a few approaches have been proposed to attenuate the landing gear or the bay noise (e.g. solid/perforated fairings13,14 and air curtain15–17 for the landing gear noise control, leading-edge spoiler18–21 and fluid injection22,23 for the cavity noise control). However, these techniques have not yet been tested to suppress the coupling noise of the landing gear and the bay.
The leading-edge chevron spoiler is a passive approach to suppress the cavity noise. It only involves geometric modification to the leading edge and does not require any external energy or mass input, therefore possessing much practical significance. The concept of using spoiler to reduce the cavity noise was first proposed by Rossiter,
10
who thought that spoiler can lift the shear layer and attenuate the impingement on the cavity aft wall. Until now, various spoilers with different topologies have been tested. Shaw et al.
24
performed one of the first attempts to use the chevron spoiler on a 4.9%-scaled F-111 generic weapon bay model, and the flow speed was managed to be within 0.7–2.0 Mach number. To date, it has been studied both experimentally and numerically by different researchers at high subsonic, transonic and supersonic speeds,19–21 and good noise reduction was achieved. For low subsonic flow
In this article, characteristics of the bay/landing gear coupling noise at low subsonic conditions were discussed and leading-edge chevron spoiler was examined to suppress the coupling noise. Experiment was performed in a low-speed aeroacoustic wind tunnel. To characterise the coupling noise and its suppression, acoustic data from far-field microphones in a directivity arc array and a planar array were analysed. In addition, a set of fluctuating pressure transducers were mounted on the internal surface of the cavity, and particle image velocimetry (PIV) measurement was performed. Those results fundamentally explained the acoustic performance from a perspective of fluid dynamics.
Concept of the leading-edge chevron spoiler
Concept of the leading-edge chevron spoiler is illustrated in Figure 1. The chevron topology consists of a number of adjacent identical isosceles triangles. As a passive control method, once installed to the leading edge of the landing gear bay, it is expected to result in perturbation to the bay leading-edge flow separation and the cavity oscillation, thereby suppressing the associated noise. Advantages of the chevron treatment can be summarised as follows: (1) ease of installation, (2) no cost of external energy or mass input, (3) no impedance to the maintenance and inspection of the landing gear or the bay and (4) almost no penalty of lift and little drag augment to the aircraft due to the small size.

Schematic of the leading-edge chevron spoiler: (a) front view and (b) rear view.
Experimental facilities and test program
In this study, the experimental work was performed using the facilities in China Aerodynamics Research and Development Center (CARDC). In this section, details of the facilities, instrumentation and test program are reported.
0.55 m × 0.4 m wind tunnel
All tests were performed in the 0.55 m × 0.4 m small-scale aeroacoustics wind tunnel in CARDC. Here, 0.55 m × 0.4 m is the size of the nozzle outlet in the test section, at a height of 0.4 m. As illustrated in Figure 2, the wind tunnel is equipped with a full anechoic room (5.5 m × 3.7 m × 4 m) around the test section. The wind tunnel is powered by a 130 kW axial fan, allowing the main flow to be controlled within the range of 8–100 m/s, and the turbulence intensity in the core region is

Configuration of 0.55 m × 0.4 m wind tunnel in CARDC.
Bay/landing gear model
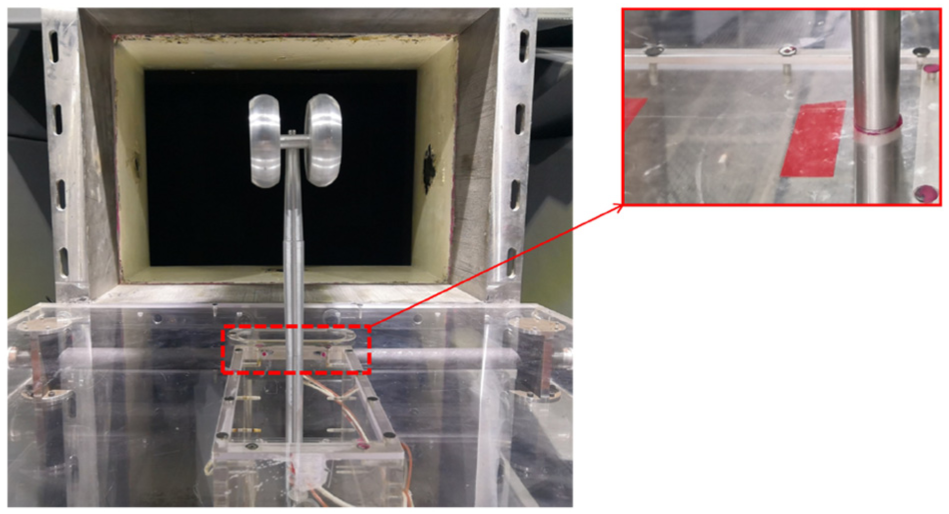
The landing gear bay was simplified as a rectangular cavity in this study, the size of which is 200 mm (l) × 100 mm (w) × 100 mm (d). In addition to the bay, a two-wheel landing gear model was machined with aluminium. As illustrated in Figure 3, the model can be installed inside the cavity for the research on the coupling noise of the bay/landing gear. Installation of the pressure transducers is also depicted in Figure 3, with the dimension of the set-up provided. Specifically, the height of the main strut cylinder, that is, from the bottom of the cavity to the centre of the wheel, is 300 mm, and distance from the front wall to the cylinder is 25 mm. As to the wheel, the diameter is 84 mm. It is worth noting that when tests of the only landing gear noise were performed, the cavity was covered with a lid. A hole was drilled to let the strut go through, with the gap between them sealed by silicon to avoid additional noise, as depicted in Figure 4.

Installation schematic of the landing gear and the pressure transducers inside the cavity.
Picture of the landing gear set-up with the cavity covered.
Leading-edge chevron spoiler
The chevron spoiler consists of a base and isosceles triangles, as illustrated in Figure 5. There are three tappings left for the screws, and the spoiler was mounted to the front wall of the cavity. Note that the bottom of the triangles was flush with the leading edge; therefore, the bases did not contribute to the incoming flow perturbation. Rossiter
10
observed that the maximum tone suppression was achieved when the height of the spoiler was equal to the boundary-layer thickness in this rig. Therefore, it is inferred that dimension of the chevron has a significant effect on the noise control. As such, the triangles in the chevron were parametrized with three variables:

Leading-edge chevron spoiler: (a) topology and (b) installation.
Acoustic measurements
Acoustic measurements were performed through microphones in a planar array for noise localisation and an arc array for far-field noise as well as sound directivity characterization.
70-Microphone planar array
The planar array consists of 70 microphones. Those microphones distribute in a spiral pattern, as depicted in Figure 6. One camera was attached in the centre of the array, allowing the beamforming noise localisation to be based on a real image. Distance from the microphone array to the reference plane, that is, the centre plane of the cavity, is 1.5 m. Data were processed with conventional beamforming, and the effects from the wind tunnel shear layer were corrected with the Amiet method. 25

Pattern of the 70-microphone planar array.
7-Microphone arc array
The far-field noise characteristics and sound directivity were evaluated using an arc array. The array consists of seven microphones, with an interval of

Schematic of the 7-microphone arc array installation.
All microphones in those two arrays are 1/4-in G.R.A.S.® 46BE type with a dynamic range of 35 dBA–160 dB. The acoustic data, regardless of the planar or the arc array, were sampled at 51.2 kHz, and the sampling time was 30 s. Therefore, a total number of 1,536,000 sampling points were attained per channel. The data acquisition system was NI PXle-1082, which allows the data from 77 microphones, that is, 70 from the planar array and 7 from the arc array, to be sampled simultaneously (Figure 8).

Set-up of the acoustic measurement.
Pressure fluctuation
Pressure distribution inside the cavity along the bottom centreline was measured by seven piezoresistive pressure transducers in this study, as shown in Figure 3. All transducers were ENDEVCO® Model 8510B-2; the specification of which is given in English Units: the transducer has 10-32 mounting thread and 0.15-in face diameter; the measurement range is 0–2 Psi (1 Psi = 6.895 kPa), and the resonance frequency is 70 kHz. As shown in Figure 3, all transducers were mounted inside the tappings on the cavity ground, flush with the surface, and silicon was used to seal the gap. As shown in Figure 3, all tappings were spaced linearly with an interval of 25 mm. The same data acquisition system in the acoustic measurement was used so that the sampling frequency and the sampling time were 51.2 kHz and 30 s, respectively.
PIV measurement
PIV is a useful measurement approach for visualising the flow field of the bay/landing gear in this study, thereby explaining the noise generation mechanism from a perspective of fluid dynamics. In this experiment, the LaVision® Time-Resolved PIV (TR-PIV) system was used, as shown in Figure 9. More specifically, a double-pulsed 30 mJ 532 nm neodymium-doped yttrium aluminium garnet (Nd:YAG) laser was fixed beside the test rig. The laser beam travels through an articulated arm to control the propagation direction. With a set of lenses inside, the articulated arm is also capable of scattering the laser into a sharp sheet, projecting from the top of the test platform. As depicted in Figure 9, the laser sheet aligns with the middle plane of the cavity, that is, the measurement plane. A HighSpeedStar Model CCD camera was mounted on the side of the test platform to capture image pairs with a resolution of 1024 × 1024 pixels. The sampling rate was as high as 1.8 kHz, and for each running case, there are 1000 image pairs. The time interval between the paired images (dt) is highly dependent on the flow speed; here,

PIV set-up: (a) schematic and (b) picture view of the test.
Test program
In this study, a parametric study was performed to characterise the acoustic and aerodynamic performance of the flow regime. Test matrix is described in Table 1, with a Run No. distributed to each case. In each case, if there exists the component, for example, cavity, landing gear model (also termed as LG hereinafter) or leading-edge chevron spoiler (termed as Chevron), the corresponding grid in the table will be populated with a ‘✓’; otherwise, a ‘×’ will be there instead. Note that if the Chevron exists, its parameters will also be provided, that is,
Parameters of the test matrix.

LG: landing gear.
Results and discussion
In this section, results and discussion will be provided based on the experiment mentioned above.
Coupling noise and flow of the cavity and LG model
When the landing gear falls out of the bay, the flow field of these two parts will be coupled and so will be the noise. Here, characteristics of the coupling noise and flow are discussed based on the simplified landing gear model and the rectangular cavity.
Characterization of the coupling noise
Figure 10 illustrates the A-weighted 1/3 octave band spectra of those cases related to the coupling noise at two Mach numbers. The spectra were attained from Microphone No. IV in the arc array, that is,

A-weighted 1/3 octave band spectra of cavity, LG model and coupling noise: (a) 0.25 Ma and (b) 0.2 Ma.
The conclusion stated above can be further confirmed by beamforming. Figures 11 and 12 show the noise localisation results at 900 and 8000 Hz, respectively, with

Noise localisation based on conventional beamforming at 900 Hz

Noise localisation based on conventional beamforming at 8000 Hz
In Cavity + LG, characteristics of the coupled noise show distinct performance from the individuals. To be more specific, spectra of the cases with Cavity + LG (No. 5 and No. 6) in Figure 10 own a peak at the same frequency with Cavity cases, but SPL is a bit lower. This is inferred to be attributed to disturbance from LG to the cavity Rossiter shear layer mode. More specifically, when the shear layer separates from the front edge, it will impinge on LG strut instead of reaching the cavity aft wall, so the feedback loop cannot be established. Note that this disturbance only occurs in the middle because the shear layer beside the LG remains to interact with the cavity aft wall, which also explains why the peak still exists but SPL reduces. By contrast, noise in the high-frequency range (≥1600 Hz) rises like the LG cases. Since noise in this frequency range is mainly from the wheels, which are not affected by the shear layer, the corresponding performance of LG and Cavity + LG is similar. In addition, it is observed that, for example, at 0.25 Ma, SPL of Cavity + LG is higher than LG at some frequencies, for example, 1250 Hz. This can be explained by the impingement of the shear layer to the landing gear main strut. For LG, the flow impinging on the strut is
Conclusions can be further confirmed by the narrowband spectra, as shown in Figure 13 at Ma = 0.25. The spectra were attained from the same microphone in Figure 10. It is observed that when there is only the cavity, the peak stays at 650 Hz, while after the landing gear is assembled, the peak still stays there but goes lower. Besides, the frequencies predicted by the Rossiter equation have also been illustrated. The equation is expressed as follows 10

where

Narrowband spectral of cavity, LG model and coupling noise at 0.25 Ma.
When it comes to sound directivity as well as the overall sound pressure level (OASPL), A-weighted results from the microphone arc array are shown in Figure 14. First of all, regardless of Mach number and direction, it is observed that OASPL ranking is Cavity > LG > Cavity + LG. This suggests that the bay may produce more noise than the landing gear itself and the assembly of the two. In terms of the directivity, it is found that for LG, the peak appears at

A-weighted OASPL directivity of cavity, LG model and coupling noise: (a) 0.25 Ma and (b) 0.2 Ma.
Characterization of the coupling flow field
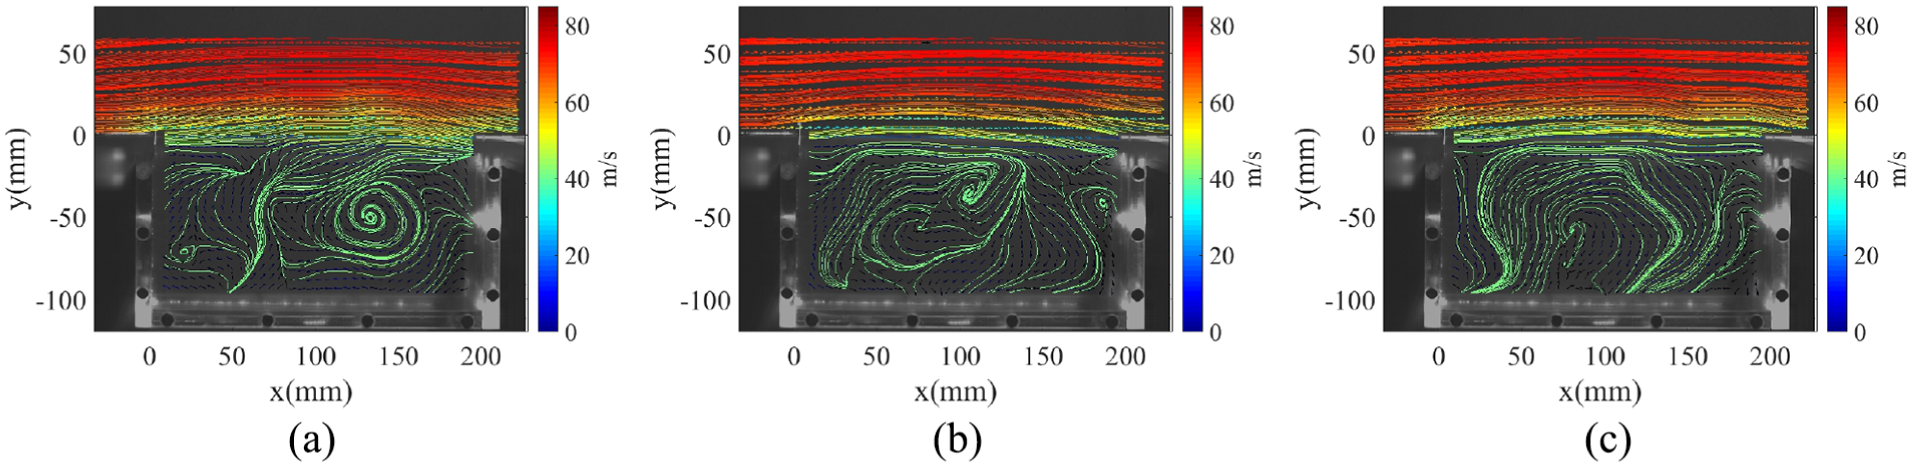
Figures 15 and 16 show the instantaneous streamlines of the flow field at 0.25 Ma, achieved from PIV of Cavity (No. 1) and Cavity + LG (No. 5), respectively. Contour of the streamlines corresponds to the local flow speed, and those streamlines are superimposed on the greyscale image of Cavity (or Cavity + LG) to illustrate the relative position. As shown in Figure 15, vortices with different sizes show up in the flow field. Those, who are deep inside the cavity possess a large size, can be attributed to the recirculation flow of the cavity. By contrast, those, who have a small size and close to the lower side of the leading-edge shear layer, are the vortices due to the Kelvin–Helmholtz instability of the leading-edge shear layer. Note that no matter how small or large all those vortices are, they are all termed as large-scale vortices because those small-scale vortices cannot be visualised by PIV. The ‘large size’ and ‘small size’ mentioned here only refer to the relative scale. When those leading-edge vortices are transported to the aft wall, as illustrated in Figure 15(c), for example, the impingement will break them up and result in acoustic pressure, which is the origin of the Rossiter feedback. It is worth pointing out that after the authors carefully reviewed all instantaneous streamline images at different Ma numbers for Cavity cases (No. 1 and No. 2), no any obvious vortices above the upper edge of the leading shear layer were observed. This is because when such vortices occur, they are confronted with strong incoming flow, that is,
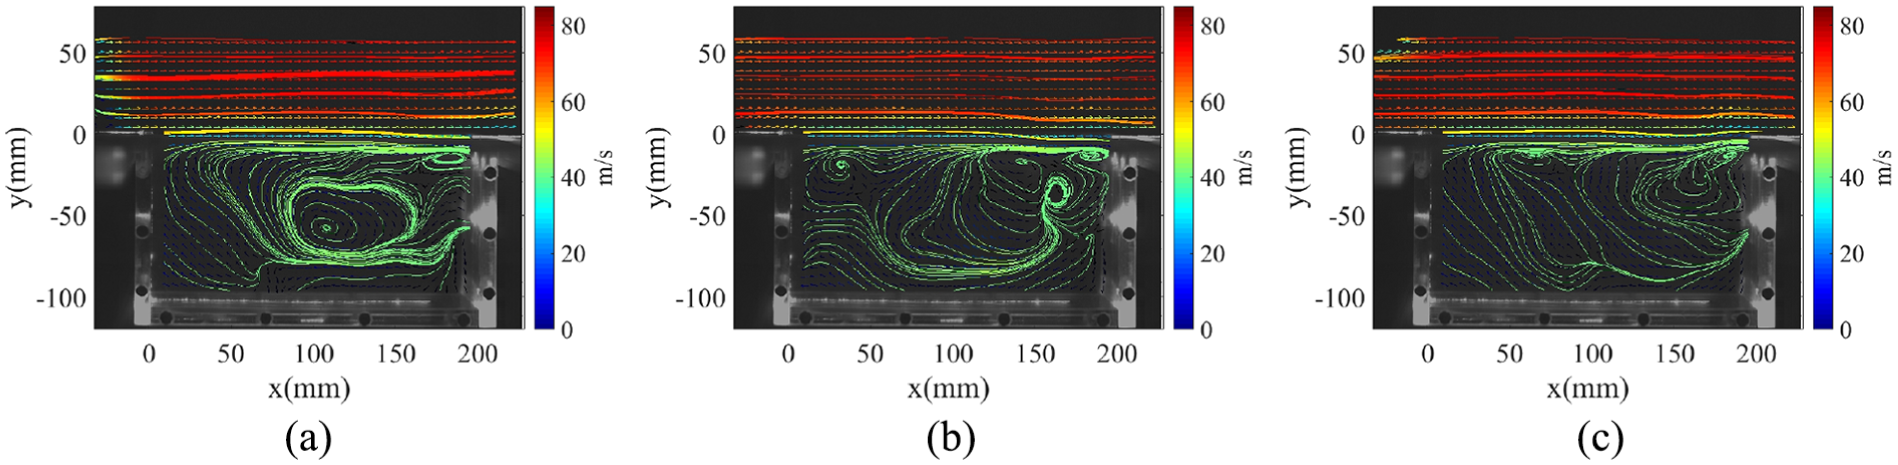
Examples of PIV instantaneous streamlines of the Cavity only case (No. 1) at 0.25 Ma.
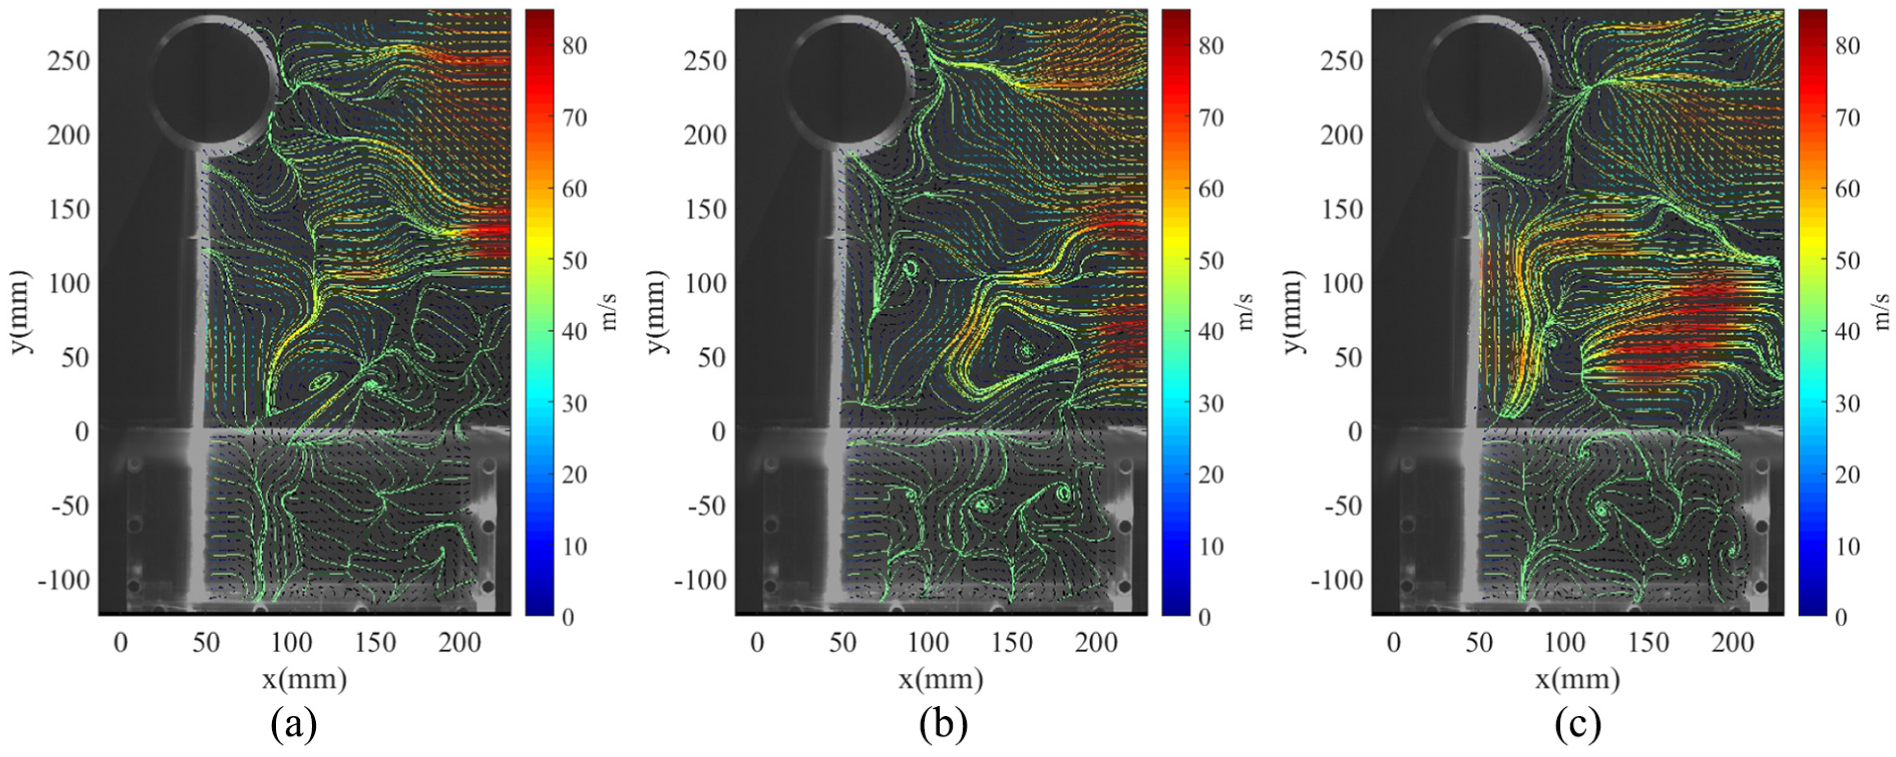
Examples of PIV instantaneous streamlines of the Cavity + LG case (No. 5) at 0.25 Ma.
Figure 16 provides the flow field of Cavity + LG. Compared with Figure 15, the significant difference confirms that the introduction of the landing gear model to the cavity can substantially affect the flow field. However, PIV results here only visualise the plane in the middle, not the side of the cavity. As pointed out earlier, the flow field of the cavity on the side should remain almost the same as that when there is no LG. Regarding results here, first of all, it is found that the shear layer disappears due to the blockage from the landing gear cylinder, and so does the corresponding vortices. This fundamentally explains why the peak of the spectra reduces when comparing Cavity + LG (No. 1 and No. 2) with Cavity (No. 5 and No. 6) in Figure 10. Moreover, vortices can be detected not only inside the cavity but also over it. Considering their distinct appearance, size and occurrence area from those in Figure 15, those vortices are results of the flow separation from the strut. In addition, a number of stagnation points can be found, where some streamlines end and others start. This can be explained by the three-dimensional (3D) characteristics of the flow regime. 27 More specifically, fluid from other planes can enter the measurement plane and some inside can leave the measurement plane. This also explains why the flow speed in the area far behind the strut substantially increases, that is, more fluid from the main stream with higher speed on the side enters the measurement plane.
The pressure distribution inside the cavity is also discussed here because it is an important flow characteristic of the bay. For example, a steep pressure gradient established on the cavity floor for some geometries can be unfavourable for store release, and it is therefore pertinent to reduce the gradient established along with the suppression of flow.
20
In this article, the pressure distribution along the bottom of the cavity is analysed by those transducers mentioned earlier. More specifically, the pressure coefficients of the cavities with and without the landing gear model are shown in Figure 17, calculated by the mean pressure divided by the incoming flow dynamic pressure. In Figure 17, for Cavity,

Mean pressure coefficient distribution of the cavity with or without landing gear model. Data from Saddington et al. 20 were also reported for comparison.
After the landing gear model is installed in the bay, whether it can substantially affect the pressure field inside the cavity is worth addressing. In Figure 17, the pressure coefficient of Cavity + LG is found to be only slightly lower than Cavity except the one most close to the aft wall, and the trend is similar as well. This can be explained by the 3D characteristics of the regime as well. To be more specific, the blockage by LG strut in the middle reduces the pressure level in the downstream field, with a pressure gradient generated in the spanwise direction. However, the gradient can be soon offset by those flow aside so that the pressure field inside the cavity farther downstream will not be affected much. This suggests that if the cylinder is small compared to the width of the cavity, only minor variation occurs in the pressure field of a cavity when the landing gear is added.
Noise suppression using leading-edge spoiler
Here, the noise suppression for both cavity and the coupling noise is discussed.
Characterization of the cavity noise reduction
First of all, effects of

A-weighted ãSPL spectral of those tests with different
As shown in Figure 18, ΔSPL is negative for all cases over the frequency range greater than 315 Hz. It can be clearly observed that the maximum was achieved at the frequency of the Rossiter modes. This confirms that the chevron spoiler is able to suppress the Rossiter mode noise. In addition, the maximum reduction of each case with different
The overall acoustic performance of the spoiler was analysed, as well as the sound directivity. Figure 19 shows A-weighted ΔOASPL achieved from those microphones in the arc. Similarly, a negative value means noise reduction was achieved. It is observed that noise suppression exists in all cases with the chevron leading-edge spoiler, regardless of different
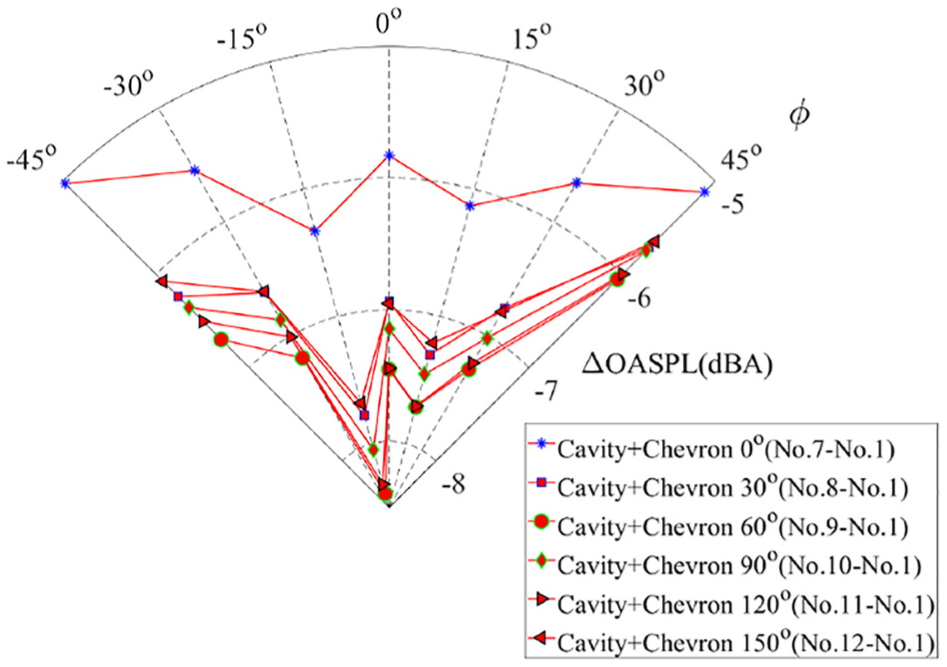
A-weighted ΔOASPL directivity of the noise reduction, achieved using chevron with different
Effects of the noise reduction from

A-weighted ΔOASPL directivity of the noise reduction, achieved using chevron with different

A-weighted ΔOASPL directivity of the noise reduction, achieved using chevron with different
Characterization of the flow field variation
Noise reduction of the cavity can be well explained by the flow field data achieved from PIV. As shown in Figure 22, the instantaneous streamlines of case No. 10 are provided, that is, Cavity + Chevron with
Examples of PIV instantaneous streamlines of the Cavity LG case (No. 10) at 0.25 Ma.
Control of the coupling noise
Noise control of the coupling noise is discussed through the comparison between No. 17 with other cases. Overall, it is observed in Figure 23 that after the chevron is installed, when compared Cavity (No. 1) and Cavity + LG (No. 5), the noise can be suppressed in all directions; however, No. 17 still produces more noise than No. 10. In other words, in terms of OASPL, No. 1 > No. 5 > No. 10 > No. 17 (Figure 24). Since the chevron spoiler has been confirmed to be able to suppress the cavity noise, especially the Rossiter modes, even there is the LG model, the noise reduction can still be observed. Due to the fact that No. 10 > No. 17, LG model is still making non-negligible noise. However, with the spoiler, the landing gear also produces less noise at certain frequencies. As mentioned earlier, without the chevron spoiler, the shear layer of the leading edge, which possesses large-scale vortices, will directly impinge on the LG, with much noise generated. By contrast, since the chevron spoiler elevates the shear layer and removes the occurrence of the large-scale vortices, the impinging flow to the LG strut is modified, thereby lowering noise at certain frequencies, for example, 1250 Hz at 0.25 Ma.

A-weighted OASPL directivity of cases related to the coupling noise suppression at 0.25 Ma.

A-weighted 1/3 octave band spectral of cases related to the coupling noise suppression at 0.25 Ma.
Conclusion
In this article, an experimental study was reported on characterization of the bay/landing gear coupling noise and flow, as well as the use of leading-edge spoiler to control the noise. The bay was simplified as a rectangular cavity, with a landing gear model installed. A test matrix was organised to conduct parametric investigation. Data were collected from both acoustic and aerodynamic measurements, including a 70-microphone planner array, a 7-microphone arc array, 6 pressure transducers and PIV.
Characterisation of the coupling noise and flow field was first performed. From the reduction of the SPL peak, it was found that installation of LG model can reduce the cavity noise by disturbing the formation of the Rossiter mode, that is, acoustic feedback. However, due to the 3D characteristics of the flow field, the disturbance only works on the spanwise location where the strut stays but not the whole range of the leading edge downstream field. As such, the peak only declines but not vanishes. Moreover, the frequency ranges, to which the LG model and the cavity, respectively, contributed more, are different, and the frequency range of LG model is higher than the frequency range of cavity model. In terms of the coupling noise, compared with the LG only, it was found that LG model can produce more noise at certain frequencies when the shear layer of the cavity leading edge impinges on the LG instead of
For the noise suppression, the parametric study was first performed on the clean cavity. Effects from different parameters, that is,
Finally, suppression of the coupling noise was tested, with the LG model installed. In addition to the cavity noise suppression, the chevron spoiler was also able to reduce the LG model noise in the whole set-up at certain frequencies. This is because the flow impinging on the LG model was also modified by the chevron. As such, total noise of the assembly was well suppressed by the chevron.
Footnotes
Appendix 1
Handling Editor: James Baldwin
Declaration of conflicting interests
The author(s) declared no potential conflicts of interest with respect to the research, authorship and/or publication of this article.
Funding
The author(s) disclosed receipt of the following financial support for the research, authorship and/or publication of this article: This research was supported by the National Key Research and Development Program of China (grant no. 2017YFE0123300).