
Abstract
This study explores the effects of non-Newtonian lubricants on elastohydrodynamic lubrication with coating at impact and rebound loading using power law lubricants. The coupled transient modified Reynolds, rheology, elasticity deformation, and ball motion equations are solved simultaneously, thus obtaining the transient pressure profiles, film shapes, normal squeeze velocities and accelerations. The effect of the flow index (n) is equivalent to enhancing the lubricant viscosity, also enlarging the damper effect. The simulation results reveal that the film thickness, the primary peak, and the secondary peak increase with increasing the flow index. The greater the flow index is, the earlier the dimple form, and the smaller the maximum value of the impact force is. The rebounding velocity and the peak value of acceleration increase with decreasing the flow index. Moreover, this research possesses academic innovation and industrial application.
Introduction
Due to the innovation of science and technology, the industry has increasing demand for service life and precision of mechanical components. Coated layer can decrease friction and wear, so it must be able to increase the service life of contact components. Due to the applied forces, the deformation of the coating produces a great influence on the precision of the mechanical component with lubricant; therefore, it is necessary to explore further this topic. The impact motions generated very high pressure. Therefore, an elastic deformation will generate at the contact central area. However, the film thickness decreases gradually with the impact proceeding until counterforce greater impact force and then rebounds. These phenomena occur in many mechanical components. In order to improve the wearability of tribological components and reduce the friction between contact surfaces, different kinds of lubricating additives are often added to the lubricating base oil. Therefore, they have significant effects on the lubricants. Generally, the non-Newtonian lubricants models are used to investigate the rheology characteristics of lubricating additive. This is one of the indispensable issues in the improvement of the lubricating effects, as well as the research and development process of new lubricants.
Many researchers1,2 have presented to explore the formation of the dimple in pure squeeze motion problems using numerical method. Dowson and Wang 3 and Larsson and Högund 4 solved the impact and rebound phenomenon of an elastic sphere on an oily plate. Safa and Gohar 5 explored an elastic steel ball is squeezed on a glass plate covered by lubricant. They found that the dimples are formed during the later period of the squeeze motion. Venner et al. 6 presented a formula to predict film thickness for the isoviscous and piezoviscous cases under pure impact revisited. They also tried to explain why the impact and the rolling contact produce pressure distributions and film thickness that are so similar at circular contact.
So far, many literatures have focused on mechanical behaviors of the coated layer under impact and rebound motion. Elsharkawy and Hamrock 7 explored the elastohydrodynamic lubrication (EHL) of an elastic coated surface on a rigid cylinder with Newtonian lubricant using the deformation model developed by Johnson. 8 Jaffar 9 derived a new set of explicit expressions for the frictionless axi-symmetric indentation between a thick elastic layer and a rigid spherical indenter.
Many researches have shown that the base oil blended with additives can improve the loading capacity and reduce the friction coefficient. Therefore,Non-Newtonian rheology characteristics have been invariably observed in many lubrication problems. Moreover, the non-Newtonian lubricants have become increasingly important as the modern industrial development. Many theories have been presented to describe the rheology behavior of non-Newtonian lubricants. In engineering practice, power law lubricant model is widely used10–13 to describe non-Newtonian lubricants because of the wide coverage for the analysis of lubricants. Chu et al. 14 derived the modified Reynolds equation with power law fluid for thin film EHL of circular contacts by means of the viscous adsorption theory. This research explored the coupling effects of flow rheology and adsorbed layers on the thin film EHL circular contact problems. Until now, no attempt to study the squeeze film characteristics of EHL with coated layer for non-Newtonian lubricants at impact and rebound motion.
In this article, effects of non-Newtonian lubricants on EHL with coating at impact and rebound motion are explored. The finite difference method (FDM) and the Gauss–Seidel iteration method (GSM) are used to solve the transient pressure, film thickness, velocity, and acceleration during the impact and rebound processes under various operating conditions in the EHL region.
Theoretical analysis
Modified Reynolds equation
In EHL problems, two balls near each other may be treated as an equivalent ball approaching a plane. Figure 1 shows an elastic ball of radius R impact and rebound from a lubricated surface with an elastic coated layer. The lubricant is taken to be a power law lubricant.

Geometry of EHL with elastic coating at impact and rebound motion.
The equations of motion governing the axial symmetric flow of a compressible fluid and neglecting the inertia terms, the constitutive equation of power law lubricant is expressed as 13


where
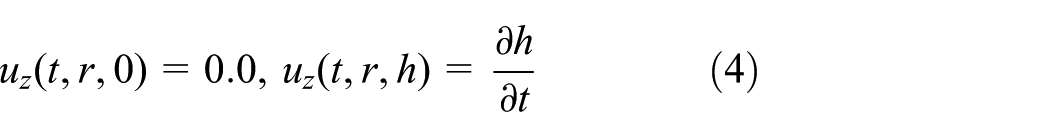
The boundary conditions (B.C.) are
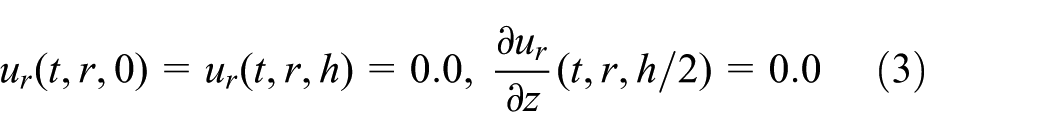
Integrating equation (1) with the B.C. (3), the velocity is obtained as

where
The equation of continuity is

Substituting the value of

or in dimensionless form as

The B.C. for equation (8) is


Since both the viscosity and density of the lubricant are assumed to be functions15,16 of pressure only, the equations can be expressed as
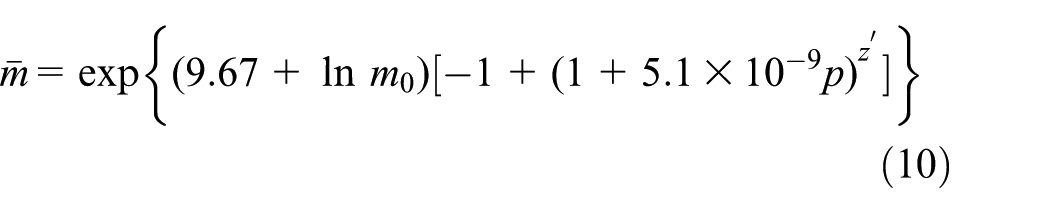

where
The film thickness in a nominal EHL point contact can be expressed as
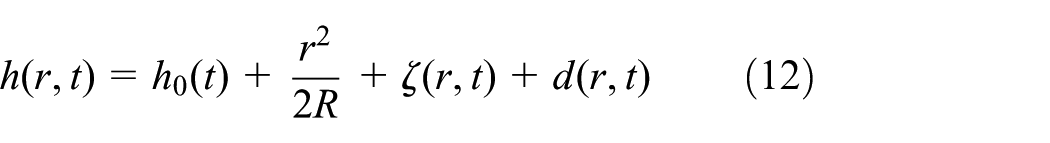
The dimensionless film thickness in a nominal EHL point contact can be expressed as

The deformation can be computed as

where the influence coefficients,

where

For the ball impact and rebound case, as shown in Figure 1, the equation of motion can be expressed as

where z is a coordinate can be defined as

Substituting equation (17) into equation (16) can be expressed as
or in dimensionless form
The initial conditions for equation (19) are


The rigid division and normal speed of the sphere center in each time step can be expressed as


The relative impact force can be written as

To obtain the solution of the present isothermal EHL of point contacts at impact and rebound processes, equations (8)–(11), (13), (19), (21), and (22) must be solved simultaneously.
Results and discussion
In this article, the ball is assumed to accelerate continually from the initial film thickness of the lubricant layer
Computational data used in this paper.
The present algorithm uses the operation and initial conditions of Larsson and Högund 4 to solve a ball impact and rebound from a lubricated surface. As shown in Figure 2, the numerical results are in good agreement with the results obtained by Larsson and Högund. 4 The difference comes from the finer mesh and computational areas that change with time in this calculation.
Compare the results of the numerical performed by Larsson and Högund 4 with the numerical results by using present method.
Figure 3 shows the relative change in the P and H for a ball approaching a flat surface lubricated with d = 0.1 mm for different n. When the ball begins to impact the lubricated plate, the P gradually increases as H decreases, and the diameters of the dimple (b) increase as the ball approaches the flat surface. The squeeze film action generates very large pressures in the lubricant and therefore results in the formation of the central dimple in the elastic solids which continues the most impact time. The maximum pressure (Pmax) and the maximum film thickness (Hmax) occurred at central point of the contact region. When the ball begins to rebound from the lubricated surface, the P and b decreased. Due to mass conservation, the pressure spike (Ps) and the minimum film thickness (Hmin) are developed at the edges of the dimple, and closing moves toward the central point. When the rebound process finishes, the Ps reached the contact center. The secondary peak could be greater than the first peak. It can be seen that the greater the flow index (n) is, the greater the H is. In addition, the greater the n is, the greater the P is at center area, and the P was found reverse at outer center area at the same time during the most impact process except approach impact end.
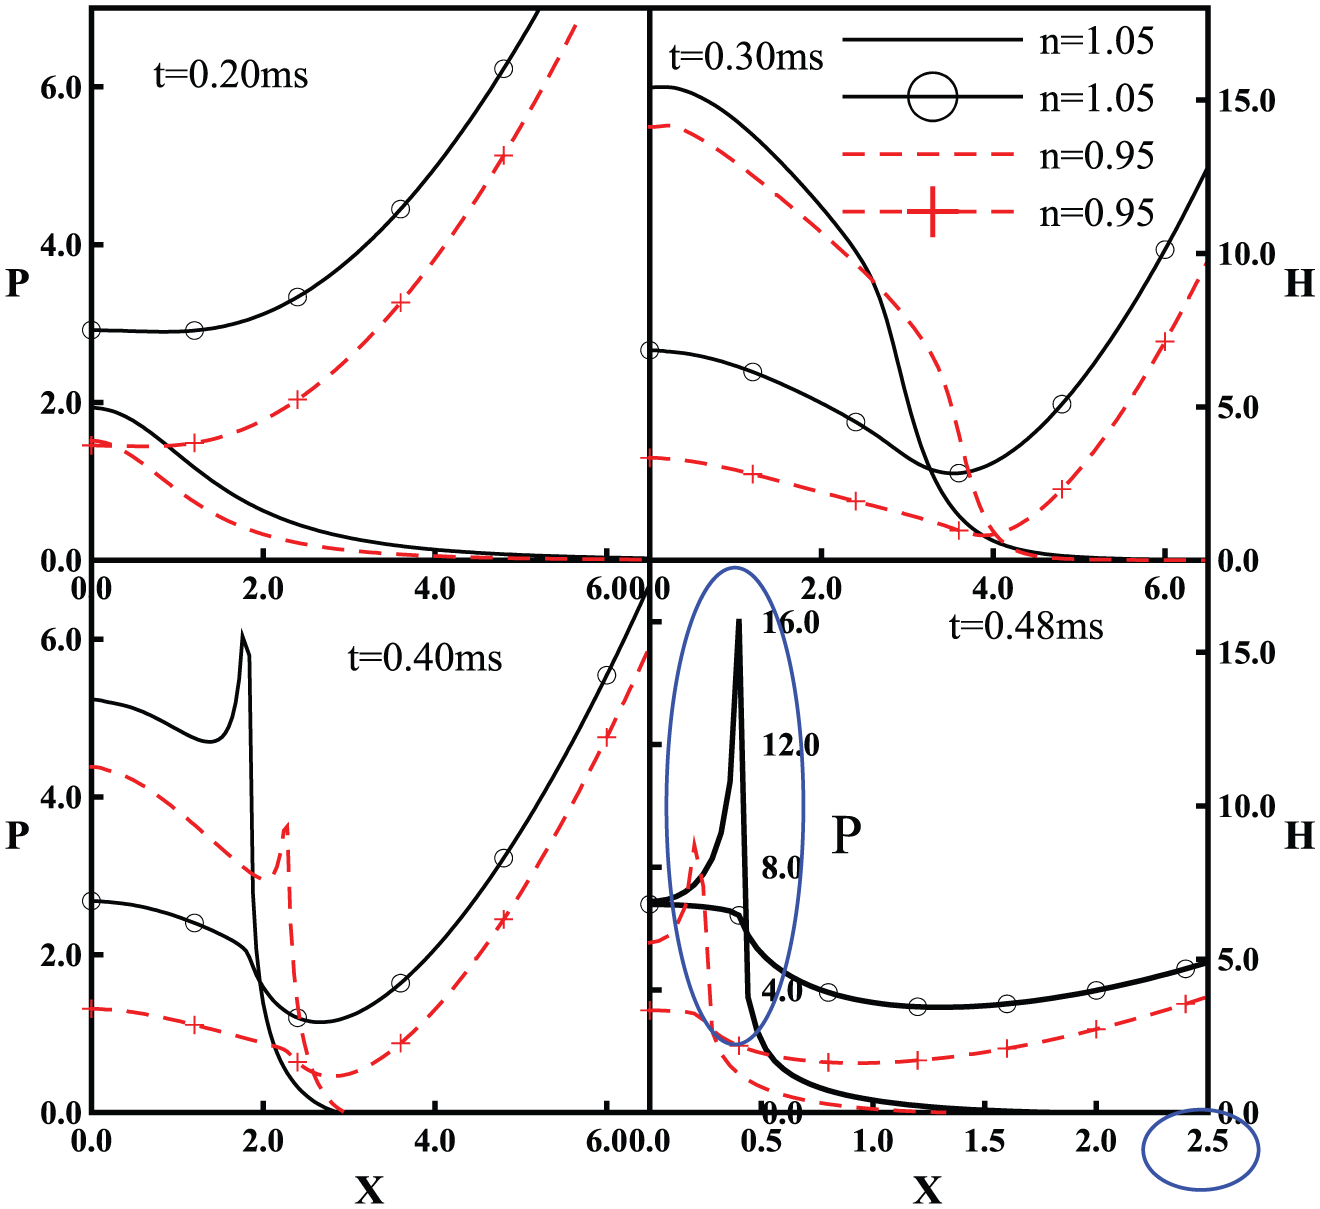
P and H versus X using different lubricants at different times.
As described above, a second pressure peak occurred, forming at the dimple edge, moving rapidly toward the contact center at the end of the impact and rebound time. Therefore, the pc reached two peaks during the impact and rebound duration. It is seen from Figure 4 that the pc increases gradually as the impact proceeds. When the pc reaches first peak value, the ball begins to rebound. The pc decreased as the rebound proceeds. When the n increases, the primary peak and the secondary peak increase. The formation of the primary peak pressure at n = 0.95, 1.00, and 1.05 occurs at about 0.3025, 0.3060, and 0.3118 ms, respectively. Therefore, the greater the n is, the later the first peak and the earlier secondary peak are formed, and the shorter the total impact time is.
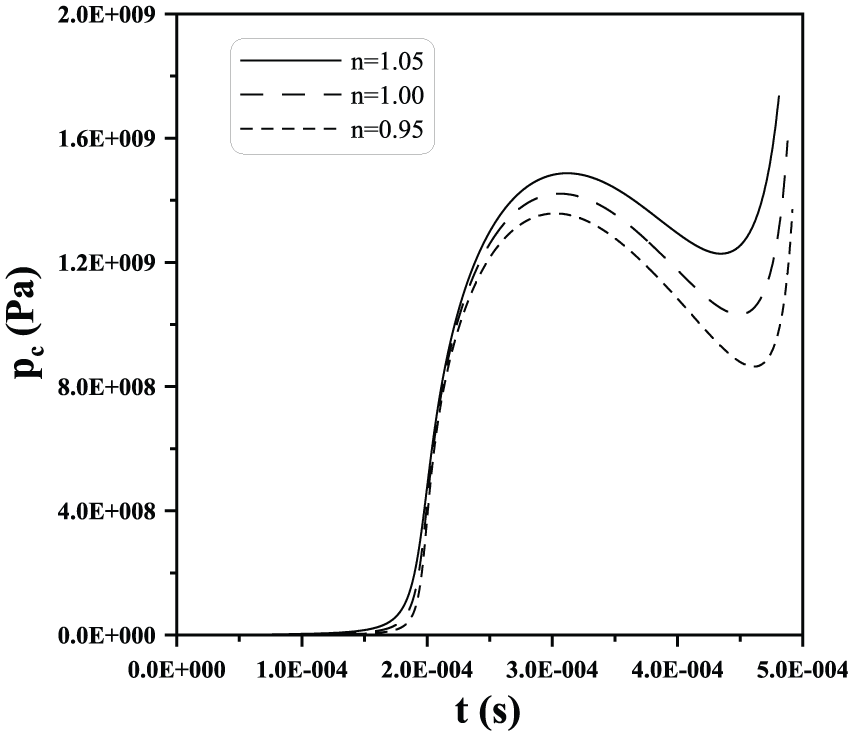
pc versus t using different lubricants.
Figure 5 shows the relationship between h and Cw versus time using the present model for different n. It can be seen that the ball has reached the lubricant layer and begins to extrude the oil film away at the initial impact stage. Because the pressure is low, the elastic deformation is small. The hc reaches 0.2039, 0.2016, and 0.1983 ms at n=0.95, 1.00, and 1.05, respectively. The p increases so that the elastic deformations of the ball and coated layer are obvious. This figure also shows that the hc, hmin, and h0 decrease with time. However, when the minimum value is reached, they gradually increase with time. Moreover, the Cw increases with time, when the maximum value is reached, it decreases with time. This shows the rebound phenomenon. In the rebound process, cavitation appears at near the edges of the dimple. In addition, it can be also shown that the greater the n is, the greater the h is, and the smaller the Cw is.

h and Cw versus t using different lubricants.
Figure 6 shows the relationship between the impact velocity (vc) and the impact acceleration (ac) versus time during the impact and rebound process. As the ball approaches the plate, the ac decreases due to the reacting force applied by the oil film to the ball before t = 0.22 ms. However, the vc increases due to the acceleration motion. In the high-pressure stage after 0.22 ms, it can be observed that the counterforce given by the oil film to the ball exceeds the ball’s weight. Acceleration of the ball’s center from the counterforce gradually increases and the vc gradually decreases, but Cw increases continuously due to the continuous squeezing process. When the counterforce created by the oil film increases to a peak value, acceleration also increases to a peak value and the vc decreases to zero (t about equal to 0.3971, 0.4016, and 0.4087 ms, at n = 0.95, 1.00, and 1.05, respectively), that is, rebound begins. During the rebound process, ac and Cw decrease gradually until the rebounding velocity reaches a peak value (<0.01 m/s), Cw approaches 1.0, and ac approaches zero. In addition, the figures show that the greater the n is, the smaller the vc is, the smaller the peak value of ac is. As previously mentioned, this is because larger n results in greater equivalent viscosity and damping effect. The recovery coefficient (vcrebound/vcimpact) is smaller than 1.0, also implying that the lubricant has a damping effect and the elastic ball and coated layer have a spring effect.

vc and ac versus t using different lubricants.
Figure 7 shows the relative change in the p and h for an elastic ball approaching a lubricated elastic coating (d = 0.1 mm) surface for different n at maximum pc time (n = 0.95, t = 0.3024 ms, n = 1.00, t = 0.3060 ms, n = 1.05, t = 0.3118 ms), respectively. The greater the n is, the greater the h is. The greater the n is, the greater the p is at center area, and the p was found reverse at outer center area.

p and h versus x using different lubricants at maximum central pressure time.
Conclusion
In this article, the effects of elastic deformation and lubricant rheology on extrude EHL motion were explored at impact and rebound process from an oily coated layer surface. The equivalent viscosity is
As can be seen in Figure 4, the pc reached two peaks during the impact and rebound duration. As the n increases, the primary peak and the secondary peak increase, the later the first peak and the earlier secondary peak form, and the shorter the total impact time is.
As can be seen in Figure 5, the greater the n is, the greater the h is, the smaller the maximum the Cw is, and the earlier the dimple form.
As can be seen in Figure 6, the greater the n is, the smaller the rebounding velocity is, the smaller the peak value of ac is.
Footnotes
Appendix 1
Handling Editor: James Baldwin
Declaration of conflicting interests
The author(s) declared no potential conflicts of interest with respect to the research, authorship, and/or publication of this article.
Funding
The author(s) disclosed receipt of the following financial support for the research, authorship, and/or publication of this article: The authors would like to express their appreciation to the Ministry of Science and Technology (MOST-106-2221-E-143-003) in Taiwan, R. O. C. for financial support.