
Abstract
In this study, the influence of the addition of styrene-butadiene rubber on the dynamic properties of polymer concrete was investigated. A 10% volume addition of styrene-butadiene rubber granulate with three different grain gradations was used for the tests. The modal study was carried out in the 0 to 2000 Hz frequency range. The response function for a single impulse excitation was tested. The relaxation time after excitation, the modes of natural vibrations and the amplitude of the transfer function values as well as vibration damping ratios were also compared. Finally, conclusions were formulated regarding the application of the styrene-butadiene rubber additive as a material to improve the dynamic properties of polymer concrete. The best results were obtained for a sample made with a 10% styrene-butadiene rubber volume addition with grain sizes from 0.6 to 2 mm. In this case, the biggest decrease of the amplitude of the transfer function value was 76%, while the biggest increase of the damping ratio was 431.5%, in comparison with the clear polymer concrete sample. The worst results were obtained for a sample made with a 10% styrene-butadiene rubber volume addition with grain sizes from 2.5 to 6 mm. In this case, the longest relaxation time of the sample, the increase of the amplitude of the transfer function value and the decrease in the damping coefficient were recorded.
Introduction
The damping of the vibrations of construction materials is one of the most important factors determining the dynamic properties of machines and has a significant impact on the machining capabilities of a machine tool.1–5 The latest development trends in the construction of machine tools show a clear tendency to move away from cast iron structures to elements made of polymer concrete (PC). This is due to the very good dynamic properties of mineral cast compared to iron cast (up to 10 times higher logarithmic damping decrement).6–10 PC (mineral cast) is a material based on a mixture of inorganic aggregates, the dimensions of which reach up to over a dozen millimetres, while the binder is usually a polymer resin.6,10–12
The tests were performed on the machining of 39NiCrMo3 alloy steel in a hardened state and AISI 420B stainless-steel during finishing, turning under different cutting conditions (wet, minimum quantity of lubrication (MQL) and dry cutting) using a turning centre equipped with a mineral cast and cast iron bed.13,14 The influence of cutting conditions and the type of bed used on tool wear as well as surface roughness after machining were investigated. It was observed that in the case of both examined materials, the wear of the flank surface and the surface roughness after machining were much lower when a bed made of mineral cast was used. Such results indicate the much more favourable dynamic properties of a machine tool equipped with a bed made of mineral cast. It was decided that additional tests of the dynamic properties of both objects would be conducted. The bodies were excited for vibrations. The first test comprised a single, impulsive excitation made by a modal hammer, while the second test was a continuous, periodic excitation. Moreover, it was noticed that in both cases, much smaller vibration amplitudes occurred when a mineral cast bed was used.13,14
This article proposes the application of the additive of styrene-butadiene rubber (SBR) to improve the dynamic properties of the PC. The SBR granulate is a recycling effect and comes from various types of pneumatic tyres.15,16 It is used in various types of safety surfaces in sports and recreational facilities. SBR granulate is used as a base layer with aggregate and as a surface layer with the addition of colour, both for the production of rubber plates and mats, as well as for poured surfaces. It is well known that rubber has very good vibration damping properties, leading to its widespread use in the industry as a variety of vibration absorbers.
Numerous studies have been conducted to improve the mechanical properties of PC. Saribiyik et al. 17 have made attempts to admix mineral material with glass powder. In this study, the effects of the amount of resin used for the production of PC and the workability of the concrete produced by replacing the quartz aggregate powder used as filler with waste glass powder in ratios of 10%, 20%, 30%, 40% and 47% and their effects on compressive and flexural strengths were investigated. As a result, along with an increase in the amount of resin used in PC, an increase was also obtained in the compressive and flexural strength of concrete. As a result of waste glass powder replacement by keeping the amount of resin fixed, significant increases were found in the compressive and flexural strength of PCs. Alperen Bulut and Sahin 18 have investigated the effects of electronic plastic waste (E-plastic) on the mechanical properties of PC. E-plastic was used as a part of the filling materials (quartz sand and gravel) to obtain PC in this study. Unsaturated polyester resin material was chosen as the polymer material and used as a binder in PC production. The resin/filling material ratios used were 10%–90%, 15%–85% and 20%–80%, while the E-plastic/filling material ratios were 0%, 5%, 15% and 25%. The 28-day axial compressive, flexural and splitting tensile strength values of the test samples were evaluated. The increase in the ratio of resin increases compressive strength, while it does not cause a dramatic increase or decrease in flexural and splitting tensile strength. Compressive, flexural and splitting tensile strength values decrease as the ratio of E-plastic increases. On the contrary, E-plastic waste increases the PC’s ductility. Experimental study has shown that the ideal resin ratio and E-plastic ratio values are 15% and 5%, respectively. Kaya and Kar 19 investigated the properties of concrete containing waste expanded polystyrene (EPS) and natural resin. In this study, the waste EPS was used in a mixture of cement and tragacanth resin in order to produce a new concrete material. The amount of resin in the mixture was 0.5%, 1% and 1.5% of the total cement + EPS. The EPS ratios in the samples were 20%, 40%, 60% and 80% of the total volume. The new samples were subjected to testing to assess a number of thermal and mechanical properties. As a result, it was recommended that by using EPS aggregated and resin-added concrete, the waste EPS can be evaluated and environmental pollution can be prevented. In addition, the newly produced samples can be used as partition walls, floorings, ceiling concrete, briquettes or bricks and plaster instead of building carrier systems such as columns or beams, and by this, the load of the building can be decreased. Barbuta and Harja 20 have studied the properties of fibre-reinforced PC. In the composition, near the fly ash which was used as filler, the cellulose fibres were introduced. The mechanical characteristics of PC with fibres, such as the compressive strength, flexural strength and split tensile strength, were investigated. The fibre percentage was constant, the epoxy resin and the filler dosages varied. The cellulose fibre did not improve the mechanical characteristics of the PC in comparison to PC without cellulose fibres. Heidari-Rarani and Bashandeh-Khodaei-Naeini 21 investigated a micromechanics-based damage model for predicting the compression behaviour of PC. In this study, the compressive behaviour of PC was investigated using a micromechanics-based representative volume element (RVE) concept. The influences of aggregate shape, distribution, volume fraction and interfacial parameters on the overall compressive behaviour of PC were studied under the uniaxial compression loading. The comparison of numerical and experimental results has shown that the greater the increase in the interfacial strength and fracture energy, the more the compressive strength of PC increased. Accordingly, the compressive behaviour of PC was highly dependent on the aggregate volume fraction and distribution in comparison to aggregate shape; the model has appropriate accuracy in predicting the compressive behaviour of PC.
There are also many articles demonstrating an application of SBR as a PC filler to obtain the appreciated properties of construction materials. Xu et al. 22 have proposed a new kind of cement concrete road overlay material comprising polyester fibre and SBR latex, called fibre and polymer compound-modified concrete (FPMC). An experimental test procedure, including compressive strength, flexural strength, flexural toughness and impact resistance, was investigated in this study. The results of microscopic tests showed that SBR latex had no significant effect on cement hydration in the long term. In addition, the continuous SBR latex film formation presented in cement substrate makes it possible to raise the toughness and compact degree of the interface transition zone (ITZ). Further, SBR latex can trigger polyester fibre and cement paste to form a tight mutual connection. Dogan and Bideci 23 have investigated the effect of a SBR admixture on high-strength concrete. In this study, for the high-strength concretes produced in C50/C60 designs, SBR in different weight ratios, such as 1%, 3%, 5% and 8% (control: 0%), was used instead of cement, and the strength properties of SBR were examined. As a result of the study, it was determined that concrete samples with a 1% SBR admixture have higher values and contributions to strength. Shadmani et al. 24 investigated the durability and microstructural properties of SBR-modified concrete containing recycled asphalt pavement (RAP). In this study, the effect of silica fume, SBR latex and RAP on the mechanical properties (compressive, flexural and splitting tensile strength, module of elasticity and toughness) and permeability characteristics (water penetration depth, rapid chloride ion penetration, electrical resistivity) was assessed. The results showed that the replacement of SBR latex and silica fume led to a significant increase in the mechanical properties and a reduction of the permeability of concrete mixtures. Martinez-Barrera et al. 25 investigated modified recycled tyre fibres by gamma radiation and their use on the improvement of PC. During the research, mechanical properties were assessed in terms of compression and flexion. Significant improvements in the mechanical properties were obtained and related to the morphological and structural changes of the recycled tyre fibres.
Studies of polymer materials have also been conducted on the microscale. Ghasemi et al. 26 investigated agglomeration effects on the vibrations of carbon nanotubes (CNTs)/fibre/polymer/metal hybrid laminate cylindrical shells. These studies investigated the sensitivity of the vibration behaviour of the cylindrical shell to the following input parameters, namely, CNT agglomeration and distribution, the mass and volume fractions of the fibre, the boundary condition and lay-ups. In addition, Ghasemi and Mohammadi-Fesharaki 27 investigated the influence of different parameters on the curved shapes and residual stresses of an asymmetric composite laminate reinforced by multi-wall CNTs (MWCNTs). The study of the effects of the mentioned parameters on the curvature of the cross-ply laminates revealed that the addition of MWCNTs leads to an increase in the elastic modulus and a decrease in the coefficient of thermal expansion (CTE). Accordingly, the curvature of asymmetrical cross-ply laminates decreases with the addition of the appropriate amount of nanoparticles. Tabatabaeian and Ghasemi 28 have conducted studies on the curvature changes and weight loss of polymeric nano-composite plates with consideration of the thermal cycle fatigue effects and different resin types. In this study, the curvature changes and weight loss of nano-composite plates with different epoxy resins were studied. Furthermore, the effects of thermal fatigue, stacking sequence and thickness were investigated experimentally, and residual stress relaxation over time was reported. The experimental results showed that the addition of MWCNTs could cause different reactions in the various epoxy resins, and the effects of the addition of nanoparticles are highly depended on the resin type and curing condition. It was also established that the curvature of the lamina is closely dependent on thermal cycling numbers.
There are no reports in the scientific literature concerning attempts to improve the dynamic properties of mineral casts for a machine tool application, which justifies further work on this topic.
Comparative modal studies were carried out in the 0 to 2000 Hz frequency range. Three different granulations of the SBR addition were tested. The response function for a single impulsive excitation, the modes of natural vibrations, the amplitude of the transfer function and the damping coefficients were compared. Finally, the conclusions regarding the application of the SBR additive as a material to improve the dynamic properties of the PC were formulated.
Experimental research
Samples
The material used for the tests was PC offered by RAMPF, available on the market under the name EPUCRET 140/5. It is a material used for casting small parts of machines, for example, guideways, tables or beds, with a weight not exceeding 500 kg. It consists of aggregates with dimensions ranging from a few micrometres up to 5 mm. According to the manufacturer’s recommendations, the wall thickness of the cast should not be less than 40 mm in order to maintain adequate stiffness. To conduct the research, four rectangular samples with dimensions of 40 × 40 × 500 mm were prepared. The first sample was made entirely of mineral cast, whereas the remaining samples were admixed with rubber granulate in a volume ratio of 10% to the total composition. Figure 1 presents images of the individual rubber granules used to create the compositions.

Images of the SBR fractions: (a) fraction 0.6 ÷ 2 mm; (b) fraction 1 ÷ 4 mm; and (c) fraction 2.5 ÷ 6 mm.
The SBR density is ρ = 1.2 g/cm3 and the PC density is ρ = 2.4 g/cm3. Based on the volume of the mould and the densities of two different materials, the mass shares needed to prepare the samples were calculated. Table 1 presents a list of the mass proportions of the components of individual samples.
The mass composition of samples.

PC: polymer concrete; SBR: styrene-butadiene rubber.
On the basis of the average volume of grain, it was estimated that there should be about 70,000 grains of SBR granulate in sample 2, about 10,000 grains of SBR granulate in sample 3 and about 2000 grains of SBR granulate in sample 4.
In order to prepare the samples, the mass proportions of the hardener and epoxy resin were first added and manually mixed for 2 min until a homogeneous consistency was obtained. Then, the appropriate mass proportion of the rubber granules was added to the mixture and again manually mixed for 3 min until the entire amount of SRB was covered with a previously prepared mixture of resin and hardener. Finally, a suitable mass proportion of the mineral filler was added and the mixture was manually mixed again for 5 min until a uniform appearance of the composition was obtained. The prepared mixture was poured into a mould, ensuring the proper compression of the composition in order to avoid the formation of air bubbles inside the samples. Then, the prepared sample was solidified in this form for 24 h, during which it developed 80%–90% hardness, and after removing the sample from the mould, it was aged for 14 days to achieve full hardness. Figure 2 presents images of the individual test samples.

Images of the samples: (a) sample 4; (b) sample 3; (c) sample 2; and (d) sample 1.
Experimental modal analysis
Experimental modal analysis is a technique often used to study the dynamic properties of mechanical objects, during both the construction and the operation of machinery. The identification experiment in the experimental modal analysis involves extorting the vibration of the object, with the simultaneous measurement of the extorting force and the response of the system, usually in the form of the spectrum of vibration acceleration.
Modal analysis can be considered as the transformation of a complex dynamic system into a set of single-degree-of-freedom systems. If the aim of the research is to determine the frequency of the free vibrations of the system, modal analysis can be limited to a simple identification modal test for deriving the frequency response function (FRF) of the system. The FRF is a transfer function and is expressed in the frequency domain.
For the linear system (Figure 3), the following formula can be expressed by equation (1)


The linear mechanical system.
The transfer function,

The FRF reflects the dynamic properties of the investigated system. It represents the relation between the response of the system (e.g. position, velocity, acceleration) and the input force for the particular pair of measurement points of response and excitation. The procedure of the experimental modal analysis can be realized by single-input-single-output (SISO), single-input-multiple-outputs (SIMO) and multiple-inputs-multiple-outputs (MIMO) techniques. These methods differ not only in terms of the requirements of measuring devices but also in the accuracy of the results of the analysis. In the following research, the SISO procedure was used.
Methodology
Experimental modal analysis was carried out in the time domain 0 to 1 s and in the frequency domain 0 to 2000 Hz. The signal of the force course from the modal hammer and the acceleration signal from the accelerometer sensor were collected and processed in the PULSE data acquisition system. A Pulse Lite package from Brüel & Kjær was used, including a 3560L measurement module, a 2-channel FFT analysis programme, a 4514 acceleration sensor and a type 8206-003 modal hammer. Each of the tested samples had 10 measurement points. The coherence function was determined by means of the Pulse LabShop system on the basis of five repetitions of the excitation. Figure 4 presents the scheme of the modal test stand.

Schematic of the testing stand.
As a result of modal tests for each of the samples, the temporal course of the response function for a single impulsive excitation was obtained, as well as the frequency response of the H1 transfer function, which were later analysed. The obtained modes of free vibrations, amplitude of the transfer function values and vibration damping coefficients were compared. Figure 5 shows an example of the frequency response of the H1 function.
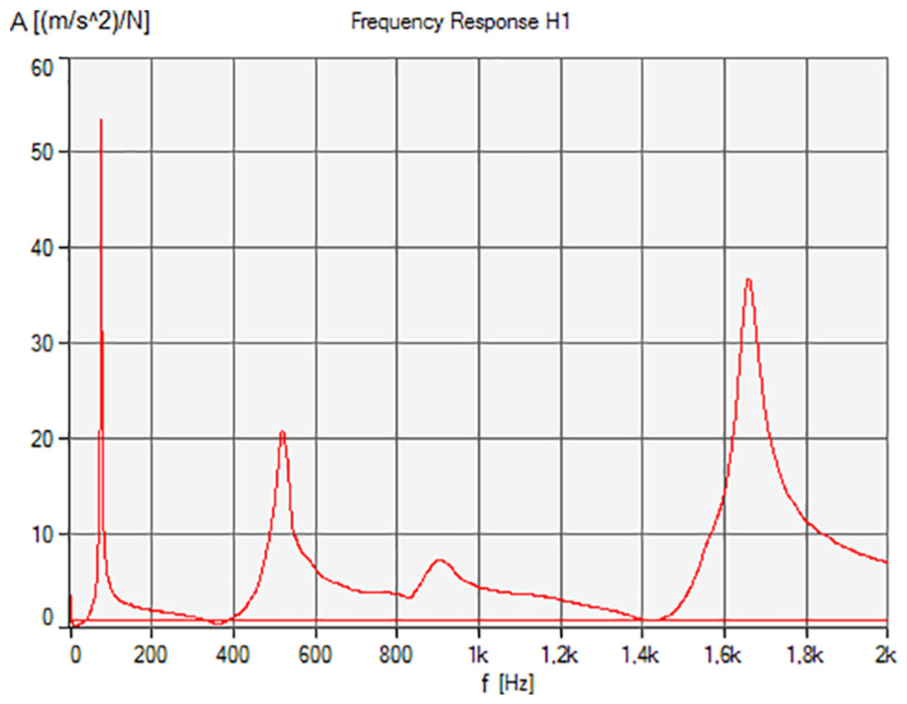
An example of a course of transfer function.
The classical method of determining the damping at a particular resonance, using a frequency analyser, is to identify the half power (–3 dB) points of the magnitude of the FRF. For a particular mode, the damping ratio dr can be obtained from the following equation (3)

where
Type 3560L contains a built-in standard cursor reading that calculates the modal damping.
Results and discussion
Time courses
At the beginning, the time courses of the response function for a single impulsive excitation were analysed, as presented in Figure 6.

Time courses of single excitation: (a) Sample 1; (b) sample 2; (c) sample 3; and (d) sample 4.
All waveforms were characterized by the fact that immediately after excitation for vibrations, the system behaved very chaotically. More or less, after t = 0.02 s, the waveforms were arranged in clearly pulsating waves. On this basis, the frequencies of the free vibrations of particular samples, amplitudes and damping coefficients were calculated.
From the analysis of the waveforms, it was found that sample 2 was characterized by the shortest relaxation time (tr = 0.21 s), while sample 4 had the longest relaxation time (tr = 0.51 s). This time was longer even in comparison with the sample made entirely from the mineral cast (sample 1), for which the relaxation time was tr = 0.44 s. For sample 3, the relaxation time (tr = 0.43 s) was similar to the result obtained for sample 1.
In addition, it was observed that sample 1 had the smallest amplitude of free vibration, as well as the longest time of one full period; thus, the free vibration frequency of the respective modes will be lower in comparison to the remaining samples.
In next step, the frequency courses of the H1 transfer function were analysed. Figure 7 shows the modes of the free vibrations that have been identified for all four samples.
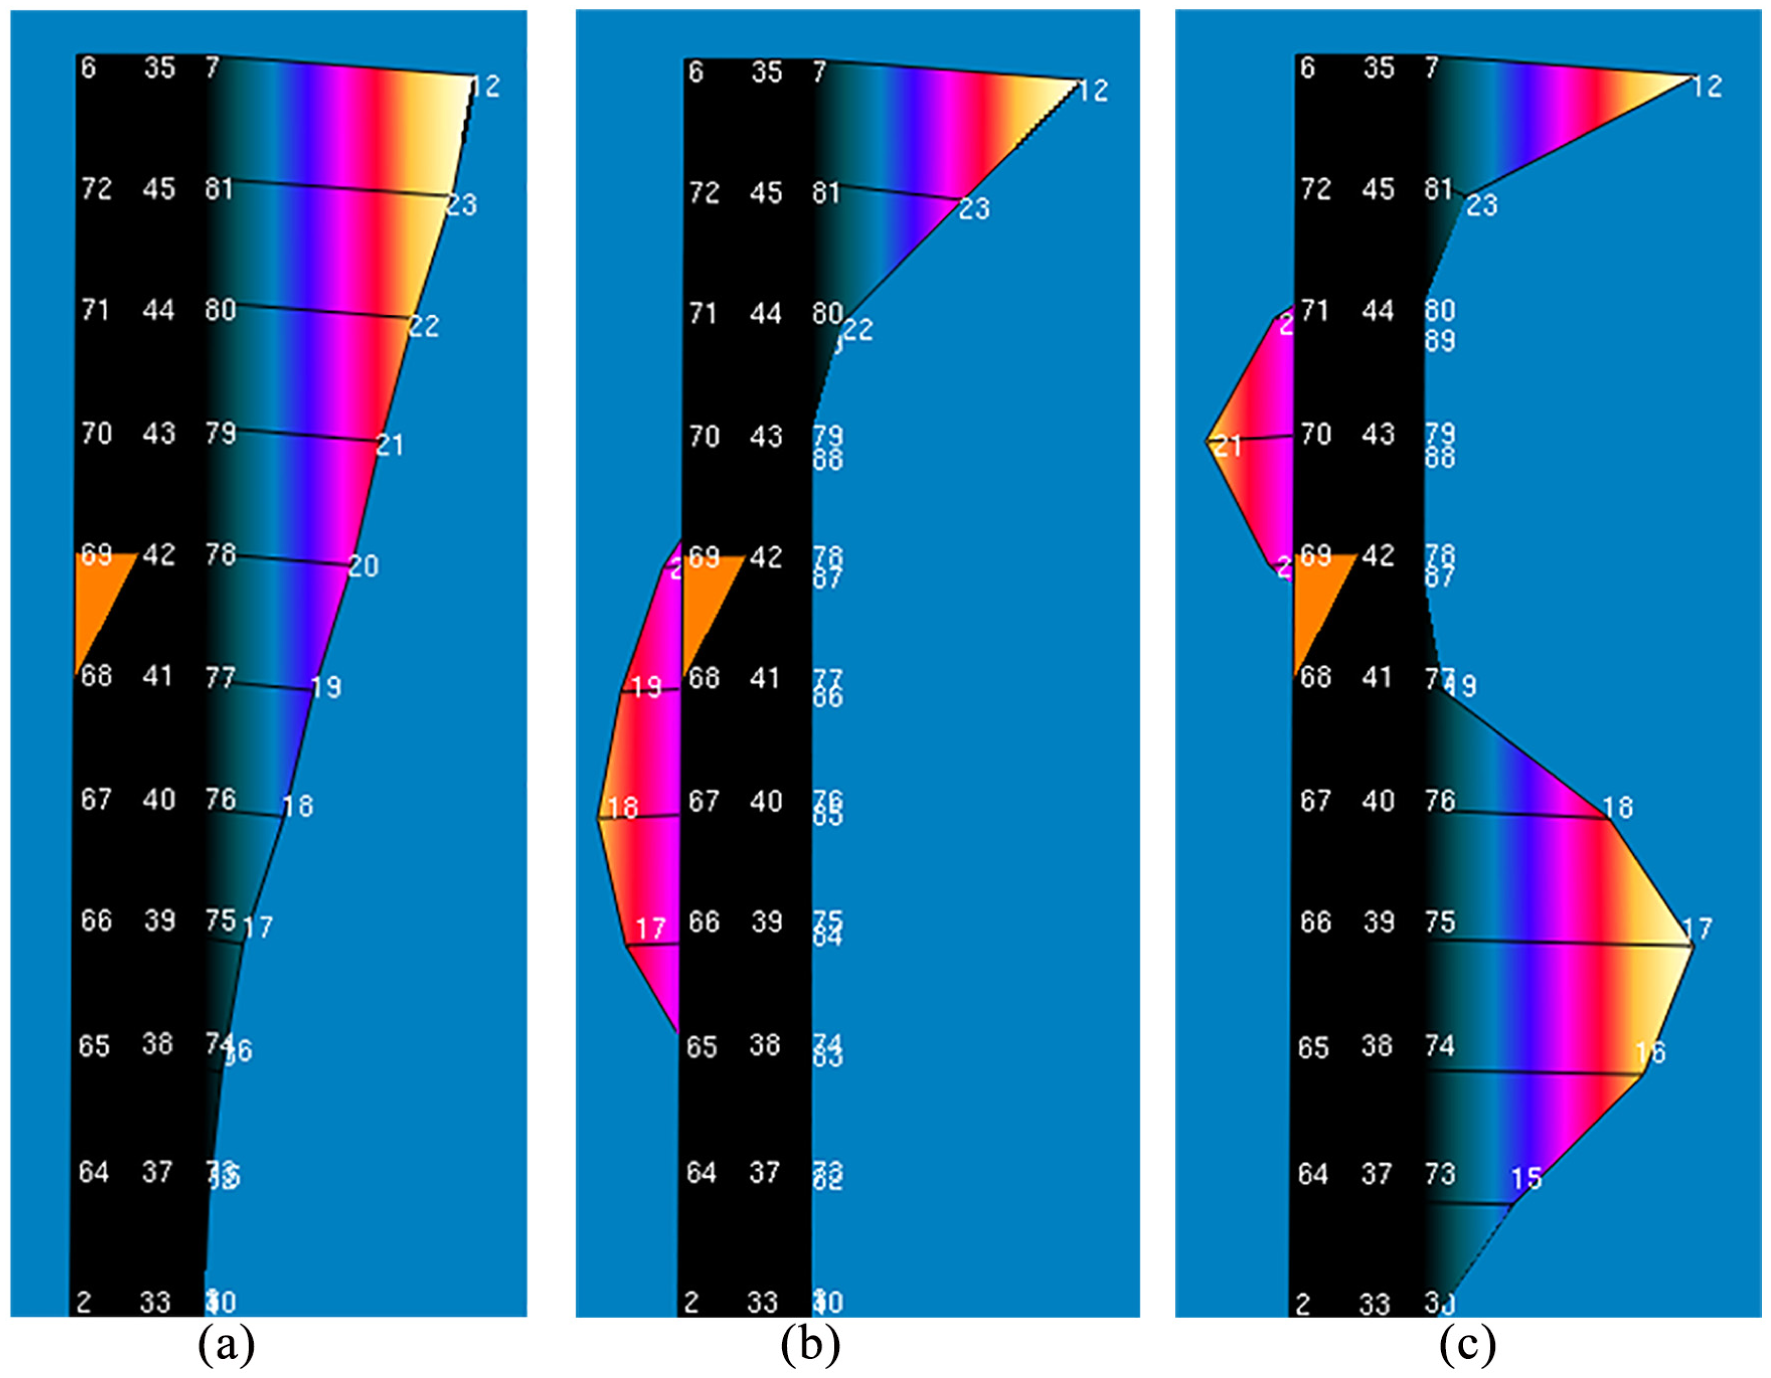
Modes of free vibrations: (a) first mode; (b) second mode; and (c) third mode.
Modal results
Table 2 presents the test results for all four samples, which are also presented as graphs in Figures 8–10. The values of the free vibration frequencies of particular modes, the amplitude of the H1 transfer function and the damping ratios were compared.
Results of experimental research.


Graph of frequencies for all analysed modes.

Graph of the amplitude of transfer functions.

Graph of the damping ratios.
Frequency
Figure 8 shows the frequency graph for all obtained modes.
As can be seen in Figure 8, the lowest frequency value for all modes was obtained for sample 2. For the first mode, the frequency of this sample was 41 Hz, while for sample 1, it was 74 Hz. In this case, the frequency value decreased by 44.6%. Sample 3 reached 69 Hz, while sample 4 was almost on the same level as sample 1 (73 Hz). For the second mode, frequency of sample 1 was 517 Hz. In comparison with this sample, sample 2 had the best value with a frequency of 427.75 Hz. In this case, the frequency value decreased by 17.7%. Sample 3 reached 461.25 Hz, while for sample 4, it was 472 Hz. For the third mode, the lowest frequency was also obtained for sample 2 (1382.17 Hz), while for sample 1, the frequency was 1656.5 Hz. In this case, the frequency value decreased by 16.6%. Sample 3 reached 1468.5 Hz and sample 4 was on the level of 1477.33 Hz. The lowering of the natural frequency resulted directly from the lowering of the static stiffness of the samples. In sample 2, the distances between individual SBR grains were small and so the amount of the surrounding PC per one grain of SBR was also small. Therefore, for sample 2, the highest values of the natural frequency decay were obtained. In the case of sample 4, in which the amount of SBR grains in the sample was the smallest, the frequency reduction was also the smallest, because the stiffness of this sample was the highest compared to sample 2 and sample 3.
Amplitude of the transfer function
In Figure 9, the amplitude of transfer function graph for all modes is shown.
As can be seen in Figure 9, the lowest values of the amplitude of transfer function H1 were obtained for sample 2 in all cases. On the other side, the highest amplitude values were observed for sample 4 for all modes. For the first mode, the amplitude of sample 2 was 12.55 (m/s2)/N. It was four times lower than sample 1 (52.35 (m/s2)/N) – a decrease of 76.0%. The amplitude of transfer function H1 of sample 3 was at a similar level (47.03 (m/s2)/N). For sample 4, the highest amplitude value was recorded at 73.03 (m/s2)/N, an almost 40% higher amplitude value in comparison to sample 1. For the second mode, the lowest amplitude value was observed for sample 2 (9.64 (m/s2)/N), almost twice as low in comparison to sample 1 (18.05 (m/s2)/N) – a decrease of 46.6%. The amplitude of sample 3 was 16.43 (m/s2)/N, twice as low as the amplitude of sample 4 which reached 31.40 (m/s2)/N. The amplitude value for sample 4 increased 174%. For the third mode, the values of the amplitude of transfer function H1 for all samples were similar, in which differences between the values were within a 10 (m/s2)/N range. The lowest value was observed for sample 2 (26.83 (m/s2)/N) while the highest value was 35.77 (m/s2)/N for sample 4. The low amplitude values of the transfer function of sample 2 were directly related to the amount of SBR grains included in the PC composition. A large amount of small SBR grains have a greater ability to absorb the force of excitation than a small amount of larger grains. Accordingly, the smallest amplitude values of the transfer function were obtained for sample 2. The use of a small amount of large SBR grains resulted in a deterioration of dynamic properties (sample 4). An insufficient amount of large grains resulted in the sample’s inability to absorb all of the energy of excitation in a short time, resulting in part of the energy being returned to the system, causing an increase in the vibration amplitude in comparison to sample 1.
Damping ratio
In Figure 10, the graph of the damping ratio is presented.
As can be seen from Figure 10, the highest damping ratio values were obtained for the first and second modes for sample 2. For this sample, the values reached 7.81% for the first mode and 6.62% for the second mode. In comparison with sample 1, the damping ratio value of sample 2 increased by 431.5% for the first mode and 206.2% for the second mode. For other samples, the damping ratio values of the first mode were almost four times lower and were estimated as 1.46% for sample 4 and 2.22% for sample 3. For the second mode, the damping ratio value of sample 3 (5.43%) was close to the value of sample 2, which was higher than the value of sample 1 (3.21%) and almost twice as high as sample 4 (2.72%). For the third mode, the damping ratio values of all samples reached a similar level of approximately 1.55%. The obtained damping ratio values were closely related to the amplitude values of the transfer function. The relationship between these two parameters was inversely proportional. Obtaining low free vibration amplitude values was the result of high damping ratio values. Consequently, for sample 2, the large amount of SBR grains in the composition significantly influenced the increase of damping ratio values, as the energy absorption capacity increased significantly compared to sample 1.
Summary
Referring to the above-mentioned table and figures, the largest decrease in the amplitude value of the H1 transfer function and the highest increase in the vibration damping ratio were recorded for sample 2. In this case, compared to sample 1, the biggest decrease in the amplitude value was 76%, while the damping ratio increased by 431.5%. The sample with the least favourable dynamic properties was sample 4, for which a 174% increase in the amplitude value of the transfer function estimate was obtained, as well as a 19.3% decrease in the damping coefficient. However, sample 3 was characterized by approximate values of the tested parameters in comparison with the sample 1. Such results demonstrate that it is not the size, but the quantity of SBR grains which has a significant effect on dynamic properties. Each sample, in terms of volume, was created with the same amount of rubber granulate (10%). However, a significant increase in dynamic properties was observed only for the sample with the designation 90%PC10%SBR0.6÷2 (sample 2).
For all samples made with rubber granulate, a decrease in the value of the free vibration frequencies of all modes was also observed in comparison with a sample made of 100% mineral cast (sample 1). This may indicate a reduction in the static stiffness of the modified samples.
Conclusions
The influence of the addition of rubber granulate on the dynamic properties of a mineral cast was analysed. The results in the time and frequency domains have shown that the most favourable dynamic property results were obtained for the sample with the designation 90%PC10%SBR0.6÷2 (sample 2). It was characterized by the shortest relaxation time after excitation to vibrations, the largest decrease in the values of amplitude of the transfer function, as well as the largest increase in the damping coefficient. From the dynamic properties perspective, the worst results were obtained for the sample with the designation 90%PC10% SBR2.5÷6 (sample 4). In this case, the longest relaxation time of the sample, increase of the amplitude value of the transfer function and the decrease in the damping coefficient were recorded.
During the tests, it was shown that despite the constant volume of the SBR additive, the grain size had a significant influence on the dynamic properties of the tested system. When using a large number of small SBR grains, the dynamic properties improved considerably. However, when using a small amount of large grains, the dynamic properties decreased.
For the 90%PC10%SBR0.6÷2 sample (sample 2), the largest decrease in the amplitude and the highest increase in the damping coefficient were recorded for the first mode of free vibrations at 41 Hz. As is known, closed structures that form the entirety of the machine tool construction (e.g. beds or other bodies) usually vibrate with low frequency values, and accordingly, the obtained test results indicate that the PC material with an admixture of rubber granulate is ideally suited for use in the construction of machine tools, increasing the dynamic properties of the load-bearing structure of technological machines. This research has shown that much better results are obtained by using a large amount of fine rubber granule grains than a small amount of large grains.
Footnotes
Handling Editor: Mohammad Arefi
Declaration of conflicting interests
The author(s) declared no potential conflicts of interest with respect to the research, authorship and/or publication of this article.
Funding
The author(s) received no financial support for the research, authorship and/or publication of this article.