
Abstract
The possibility of extracting wind power from unique configurations embedded in moving vehicles using microturbine devices has been investigated. In such environments with moving frames or platforms, powered either by humans like bicycles or by chemical reactions like automobiles, the specific power of the air motion is much greater and less intermittent than in stationary wind turbines anchored to the ground in open atmospheric conditions. In a translational frame of reference, the rate of work done by the drag force acting on the wind harnessing device due to the relative motion of air should be taken into account in the overall performance evaluation through an energy balance. A device with a venting tube has been tested that connects a high-pressure stagnating flow region in the front of the vehicle with a low-pressure region at its rear. Our analysis identified two key areas to focus on for potentially significant rewards: (1) vehicles with high energy conversion efficiency, which require a high mass flow rate through the venting duct, and (2) vehicles with low energy conversion efficiency with wakes, which will be globally affected by the introduction of the venting duct device in a manner that reduces their drag so that there is a net gain in power generation.
Keywords
Introduction
As the global energy economy transitions away from traditional technologies to renewables, wind energy has become a promising alternative energy source over the years, especially with the design and construction of large wind farms in which each individual wind turbine is anchored to the ground. One major disadvantage of this setup is the downtime of power output when there is no wind blowing. In contrast, if one considers the flow environment around moving vehicles, there is always wind energy available, which could be extracted with appropriately designed energy converters/generators. The major advantage of such a system is the availability of high-velocity air almost all the time. Wind turbines are very rarely exposed to
The power density of this air motion appears to be proportional to
Previous works and our current computational and experimental results have shown the existence of a large region of stagnating pressure in front of a typical car and a region of subatmospheric pressure behind the car. Our numerical simulations have shown that in the case of vehicle moving at a speed of
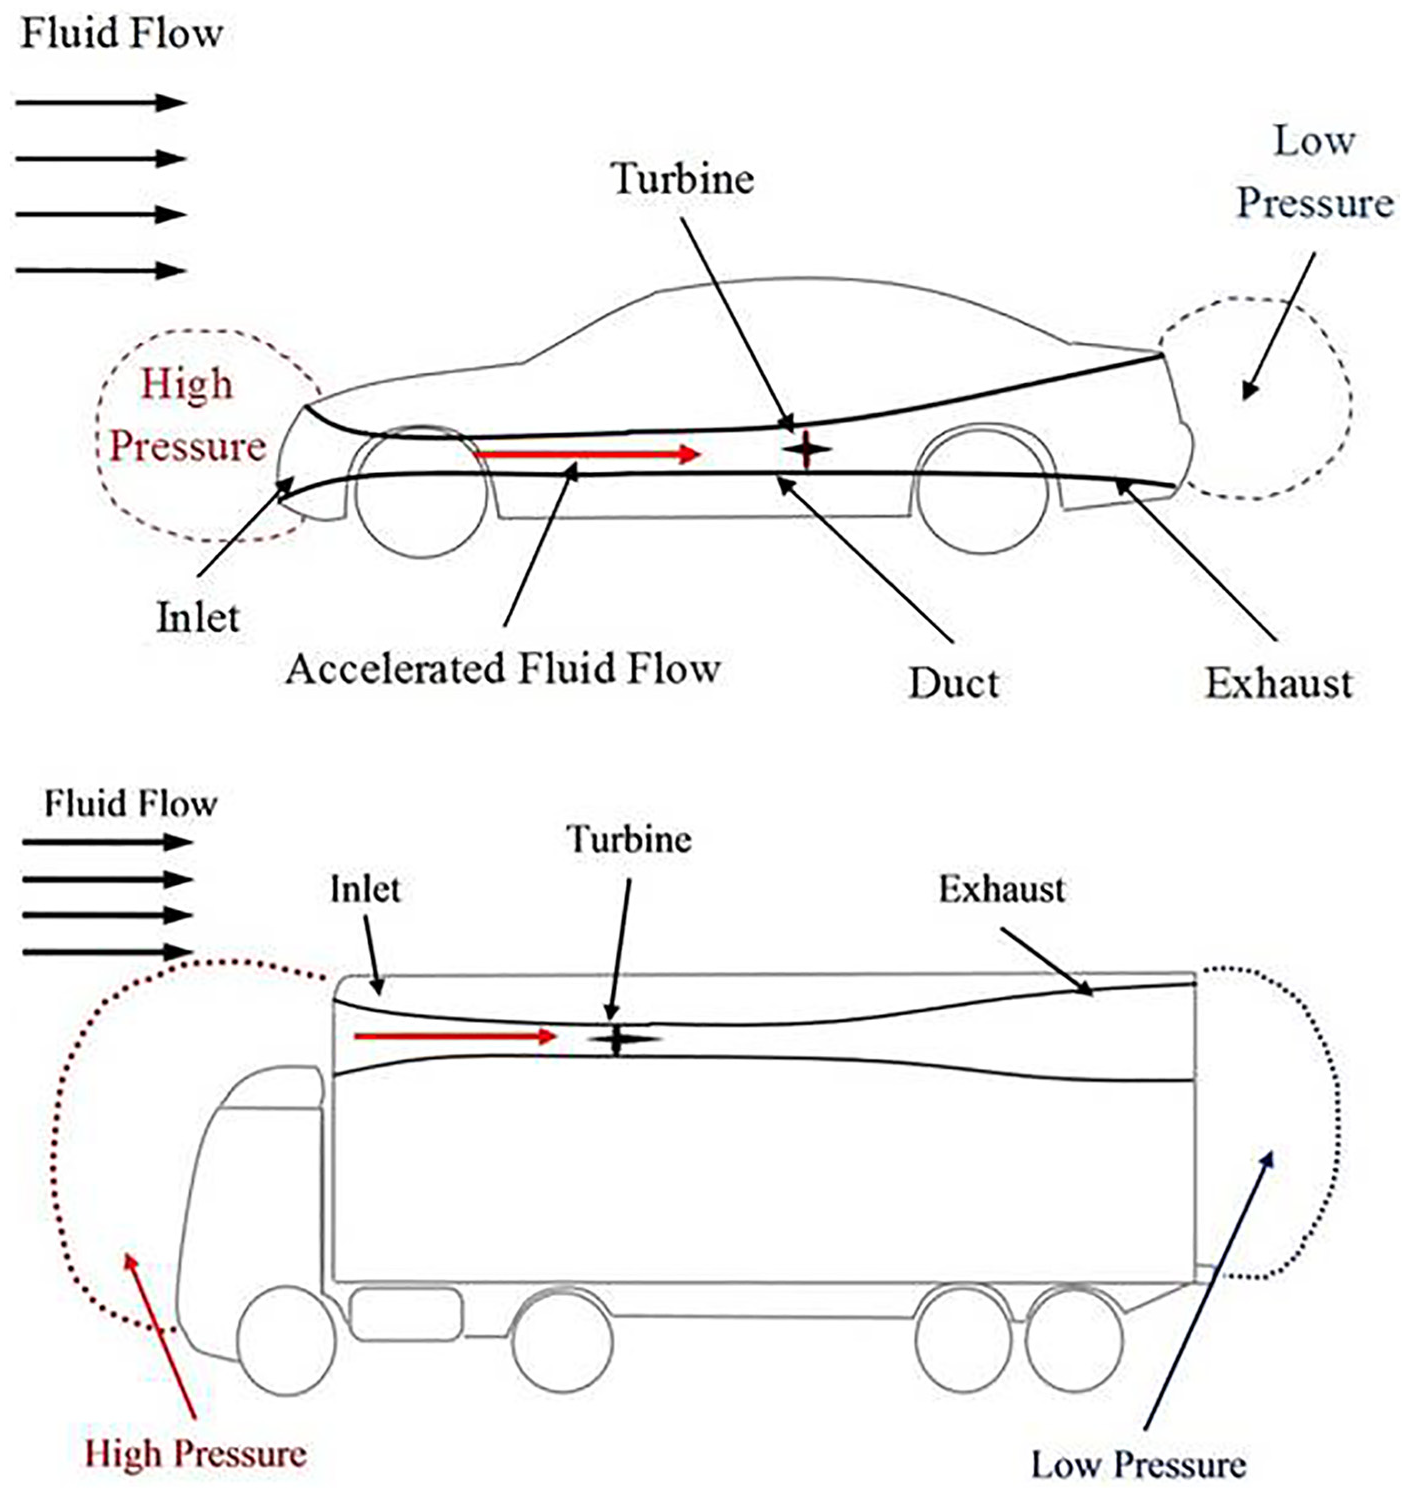
Venting duct-in-car and duct-in-truck embedded devices for wind energy harnessing.
As the car moves, air is expected to enter the duct after overcoming its flow resistance, since the pressure behind the car is below ambient pressure and the pressure up-front is close to stagnating conditions, that is, above ambient. If a pressure coefficient is defined as

where k is the velocity ratio. On the other hand, if the flow was a fully developed laminar, viscous flow in which the pressure gradient is counterbalanced by the stress gradient, the average velocity sustained by a pressure difference
Generating such an opening in a car has a beneficial secondary effect since it is expected to reduce the overall drag coefficient due to the venting of the pressure difference between the front and the back of the car. It is known, for instance, that passive venting ducts along bluff bodies like spheres practically reduced the drag force by more than 60% in comparison with the case without ventilation.1–4 This has been achieved by venting only 2% of the frontal area of the sphere to the base through a smooth internal duct. 2 In addition, a 20% velocity increase inside the duct has been measured over the approaching freestream velocity in this case. Unforced ventilation is a flow control technique which modifies the bluff body wake by bringing upstream flow to energize the wake and involves a feedback of downstream flow changes to the upstream flow parameters. 2 Similar global modification of the wake structure was achieved in Falchi et al., 1 where a venting duct was introduced in the bluff body. Smoke visualization of the wake has shown a jet exhausting from the venting duct, which changes the base pressure and the overall drag. As a result, the drag coefficient is reduced by up to 20% compared with the nonvented case.
This idea has been tested by carrying out computations using computational fluid dynamics (CFD) model and experiments in a wind tunnel using an Ahmed body, a simplified geometry of a vehicle. Our CFD work and corresponding experimental evidence, which will be described later, indicated a remarkable 20%–48% reduction in drag coefficient by just introducing a circular venting duct. In the present case, however, the presence of a rotating turbine inside the venting duct is expected to increase the overall drag of the car slightly. Our time-dependent computations, in which the rotational motion of the turbine was also resolved by considering its dynamic equation of motion, indicated that this drag penalty is about 2.6% of the total drag in the case of generic trucks. The frictional drag typically generated on the internal surface of the duct has also been estimated by integrating the wall stress over this surface and found to be less than 1% of the overall drag for relatively small length-to-diameter ratios. Thus, these drag penalties are less than the original pressure drag reduction due to the venting effect, and therefore, a net effect of energy surplus into the system may be possible in principle.
Eventually, such an embedded wind power harnessing system has to be integrated with other vehicular systems, particularly with systems under the hood, where the air flow has to be optimized so that no additional drag penalty occurs. Similar systems can be installed in the cargo area of trucks without particular challenges in integration.
Theoretical framework: extending momentum theory to include a moving frame
If a horizontal axis microturbine is installed inside a duct, as is anticipated in the present work, some additional considerations should be provided since this setup constitutes a departure from classical wind turbines operating in the open under atmospheric pressure at the far field.
Control volume analysis for conservation of mass, axial and angular momentum balances, and energy conservation for an inviscid, incompressible axisymmetric flow yields


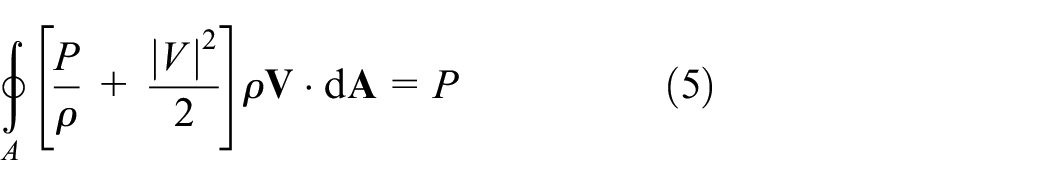
where
We now consider a one-dimensional model without friction in the configuration shown in Figure 2 and in a reference system of coordinates associated with a stationary vehicle and an upstream relative air velocity

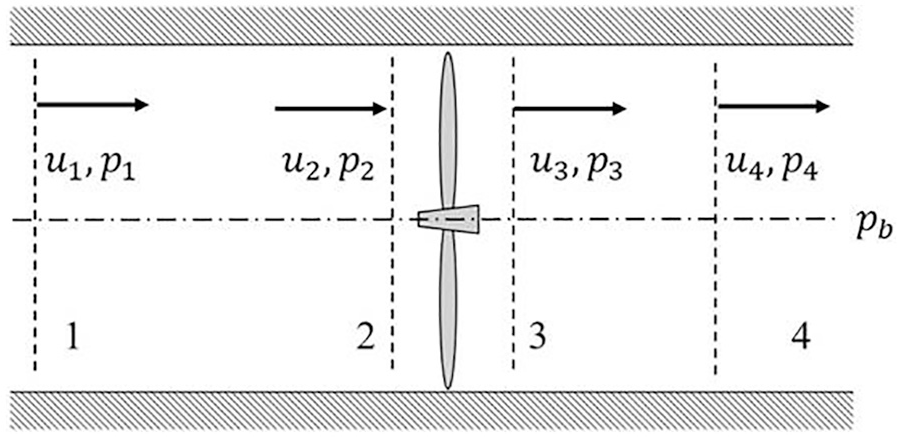
One-dimensional flow model.
For a control volume encompassing the turbine, where the average velocity upstream of the turbine is

This relation indicates that the power is extracted from the potential energy per unit mass
Bernoulli’s equation yields

If friction is ignored and the vehicle is not moving, that is,

Under the one-dimensionality assumption and assuming negligible friction forces
which is equivalent to

or

This simplified one-dimensional model shows that the harnessed energy flux is extracted at a rate defined by
In the ideal case of
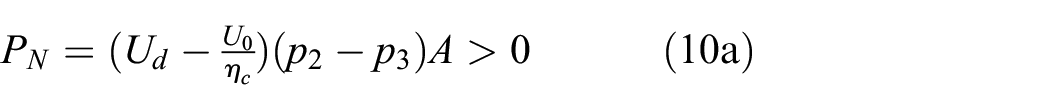
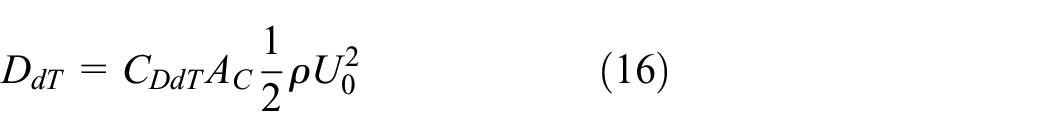
One additional factor which needs to be considered in the present analysis is the expected benefits of a potential drag reduction

If this relation is made dimensionless by the harnessed power,

It is obvious from this relation that the ratio
Experimental work
We designed, tested, and evaluated the performance of a laboratory prototype model of an Ahmed body in a wind tunnel. In the present context, the term Ahmed body is defined to include any simplified generic vehicle shape. This model is geometrically simple, yet representative of a typical bluff body, like an Ahmed body/generic truck while at the same time allowing for higher resolution measurements and computations of the flow inside the circular duct and around the body. This wind tunnel model was not a representative model of an actual size car or track. Since the focus of this study was the energy output of the wind turbine, it was decided to have a larger diameter turbine/duct so that a meaningful amount of energy can be harnessed with an acceptable efficiency. The wind turbine efficiency deteriorates rapidly with large downscaling of the model because the relative surface-area-to-volume ratio increases, and therefore, mechanical and fluidic friction starts to dominate entirely at small scales. On the other hand, the pressure gradient along the duct, which drives the flow through, is expected to be lower because the back pressure will decrease due to the decrease in the cross-sectional area. In that respect, the present wind tunnel results may be more conservative than those in the full-scale case.
The wind tunnel used is an open-section tunnel with a test cross section of
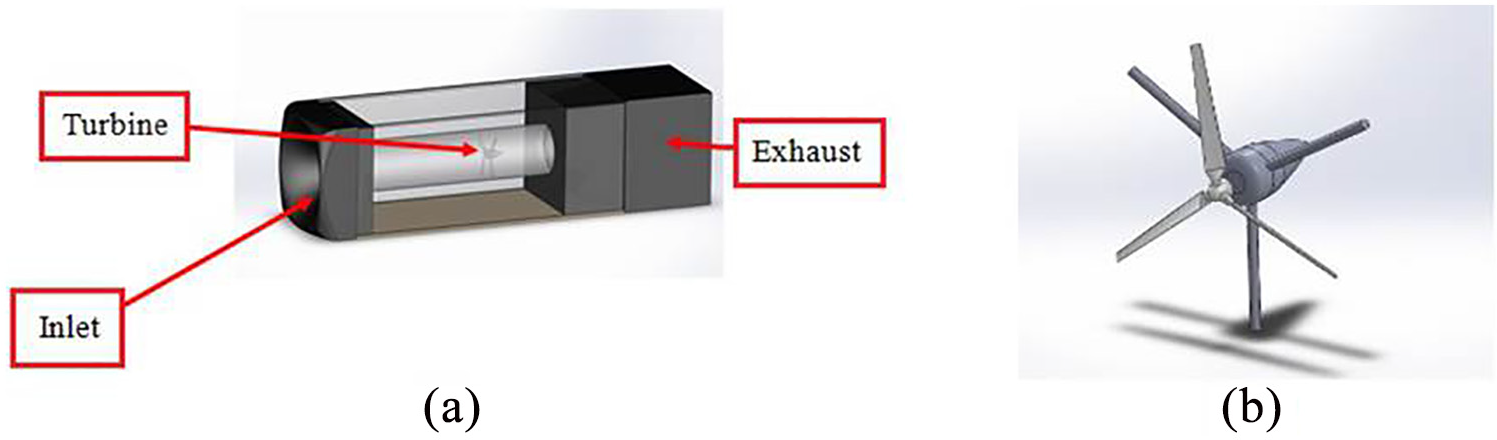
(a) SolidWorks rendering of wind tunnel model. Arrows indicate intake, wind turbine, and diverging nozzle/diffuser; (b) rendering of wind turbine and its support with hub.
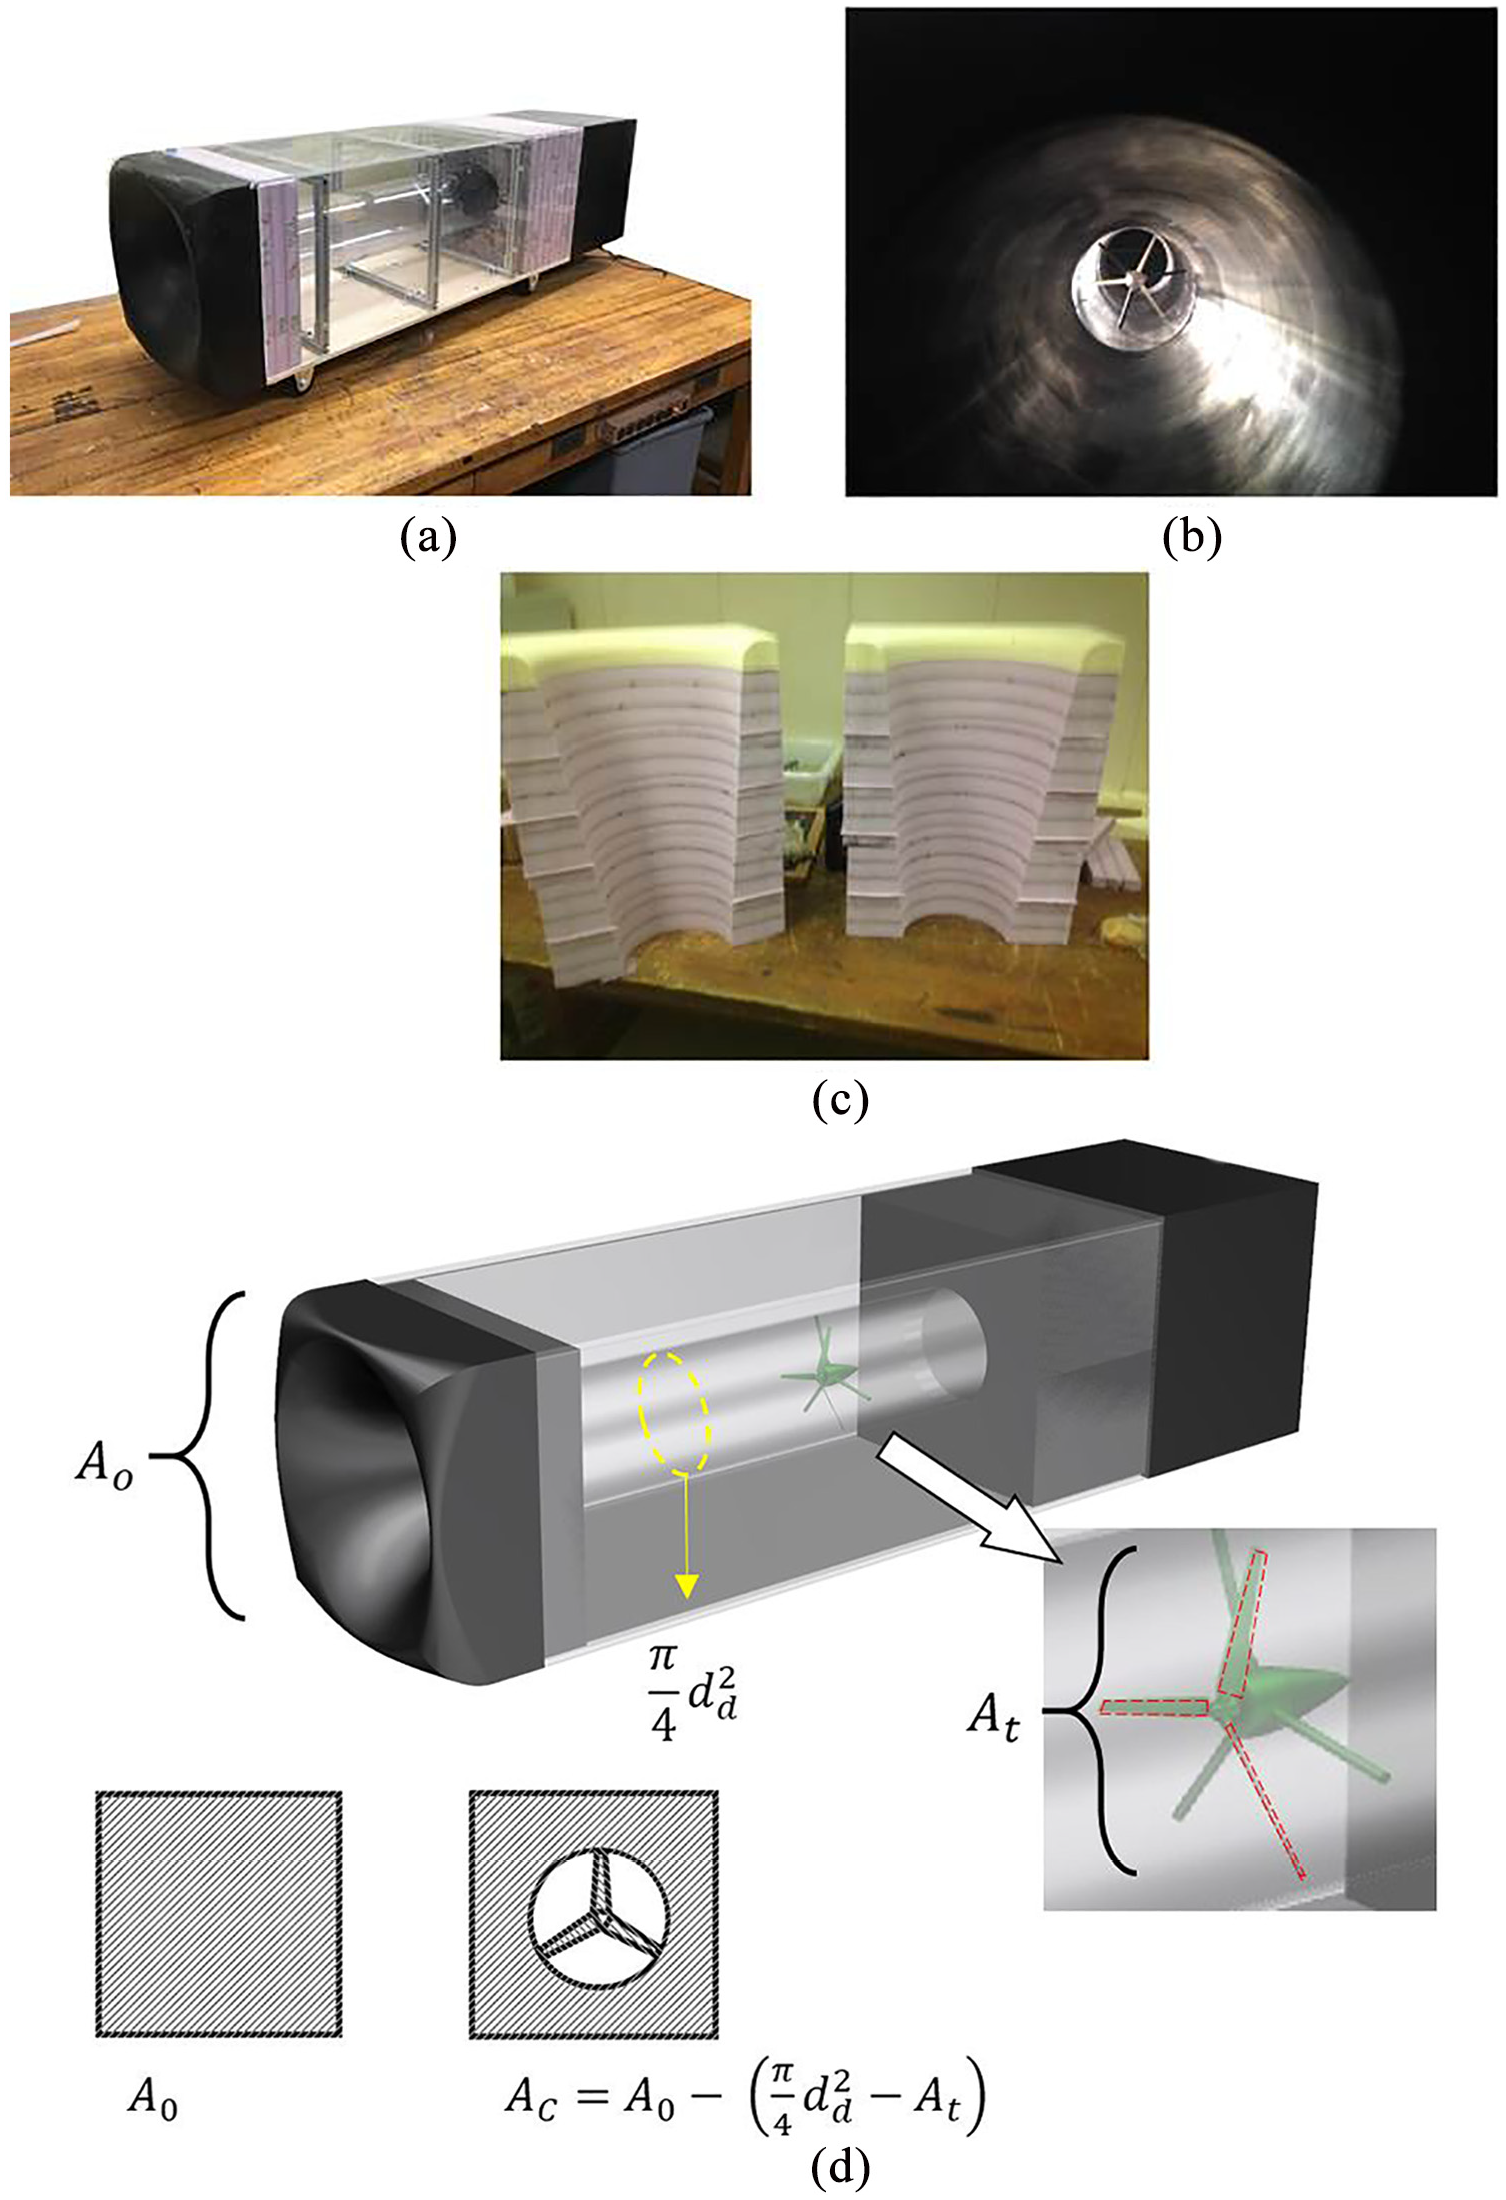
(a) Photograph of fabricated wind tunnel model, (b) view from the diffuser toward the wind turbine, (c) diffuser cutaway section showing the cross-sectional profile fabricated from layers of foam, and (d) designation and nomenclature of surfaces involved in drag force determination.
The performance evaluation of the model included measurements of the flow rate through the venting duct and at the exhaust, measurements of the voltage output of the turbine and its rotational speed, and measurements of the drag force acting on the model. Additional measurements of the velocity field within the venting pipe and in the wake of the body were carried out using hot-wire anemometers and particle image velocimetry (PIV) techniques, respectively. The force was measured using an ATI Nano17 six-degrees-of-freedom sensor capable of simultaneously measuring the three components of the net force and three components of the net moment acting on the model. The calibration of the force and moment sensor was performed by attaching a string to the sensor inside the working section of the wind tunnel and applying known weights at specific points and recording the corresponding signals. The output signals of the sensor and the output voltage of the wind turbine during the testing were recorded by a multichannel analog-to-digital converter controlled by a computer. In the present experimental work, the wind tunnel wall was not moving. This setup had no influence on the present measurements of drag because the local boundary layer thickness was much less than the clearance of the model and the wall. In addition, no changes in the measured aerodynamic forces were detected when the model was positioned at various distances from the wind tunnel wall. The mass flow rate and average velocity through the duct were determined by carrying out measurements of velocity profiles across two sections located upstream and downstream of the turbine using a pitot tube probe for total pressure measurements and wall static pressure information measured concurrently. These measurements were carried out while the turbine was rotating in the duct.
The tunnel walls interfere with the flow field around the bluff body model and cause a local flow acceleration, known as solid blockage, which changes the boundary layer around the model. An additional flow acceleration takes place in the viscous wake of the model, which is called wake blockage. Correction methods have been developed to take into account the solid and wake blockage effects. The basic empirical formula behind these corrections has been proposed by Maskell,
13
which has been adopted in the present consideration to evaluate the corrections of the CD, Ud, k, and D measurements needed to compensate for blockage. If

where
in which C is a constant with value

The estimated correction on
Figure 5 shows values of the measured average velocity

Measured mass flow rate and average velocity inside the venting duct of the wind tunnel model.
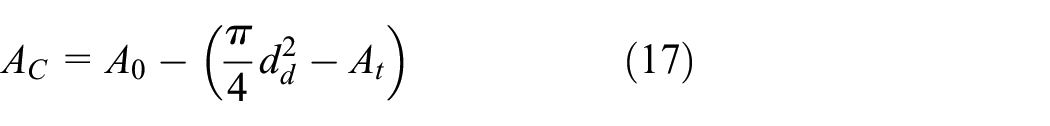
Measurements of the drag force obtained at various incoming wind tunnel velocities are shown in Figure 6. Three different experiments were carried out: first, with the intake of the model covered so that no flow was entering the duct; second, with the intake open and without the wind turbine installed; and third, with the intake open and the turbine able to rotate in place. The drag forces appear to vary parabolically with the external velocity
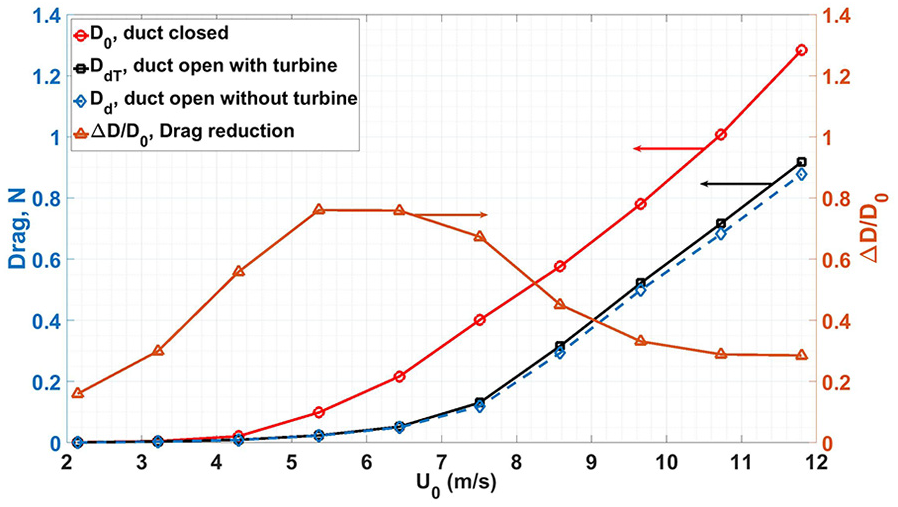
Measured drag and relative drag reduction
Values of the relative drag decrease in reference to
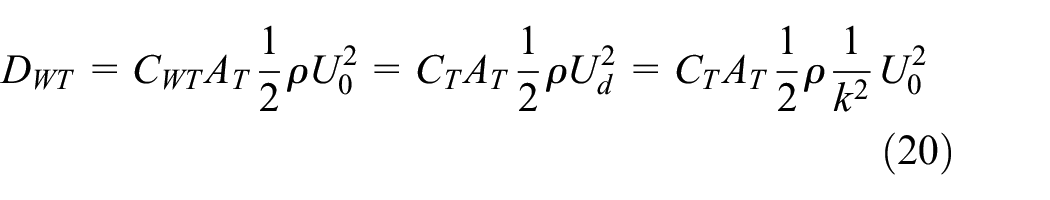
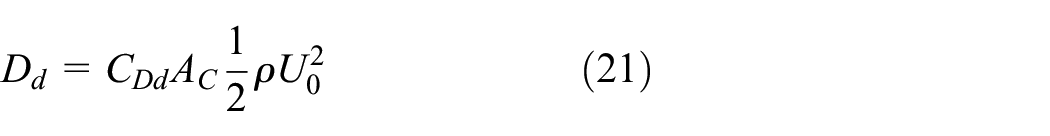
One obvious question is how much of this drag reduction is due to the opening of the duct which reduces the cross-sectional area

where
where
where

where the corresponding changes in drag coefficient and area are given by

and therefore
where

Estimated drag coefficients and values of their relative change
The coefficients

shows the genuine effect of the interference between the external flow and the exhausting duct flow, which energizes the wake, since the effects of different cross-sectional areas have been taken out. In fact, while the relative reduction in cross section is a constant value, depending on geometry,

Breakdown of directly measured relative drag force reduction,
The voltage output from the turbine was measured by connecting the output leads from the DC motor to the data acquisition board and recording the output voltage time series. The measured voltages shown in Figure 9 are plotted at various external velocities. It should be noted that the measured voltage v is directly related to the output power through

Voltage output measurements at various external velocities with turbine installed inside the duct or in a stand-alone setup in the same wind tunnel.
To further evaluate the effect of the venting tube on the back pressure, a time-resolved PIV technique was used to obtain the velocity field data in the region of the model. The wake region of interest is shown schematically in Figure 10. PIV data were captured using a continuous laser and a high-speed CMOS (complementary metal oxide semiconductor) camera. The beam from a Millennia Vs Spectra-Physics CW laser source of

Region of interest for PIV data analysis in the back of the model.
Figure 11 shows a sample velocity field after subtracting the mean component. The image is slightly misaligned with respect to the centerline of exhaust jet, which is located at a y location of about

(a) PIV data in the back region of the car and (b) the associated coefficient of pressure calculated using velocity data.
Computational work
Time-dependent computations were carried out by numerically solving the incompressible unsteady Reynolds-averaged Navier–Stokes (URANS) equations and using the one-equation turbulence model of Spalart–Allmaras (S-A). The system of differential equations used in tensor notation is given as follows


where p is the pressure,
As mentioned earlier, the geometry of the model was chosen after performing detailed analysis on the results of over 100 CFD simulations in ANSYS/Fluent to find the optimal geometry for the scale of the design. The optimization strategy was based on maximizing the flow rate through the venting duct while maintaining the pressure difference between the front and the rear of the vehicle. At the intake of the tube, a bellmouth with an elliptic profile for its shape was used.
The final design, as shown in Figure 12, measures
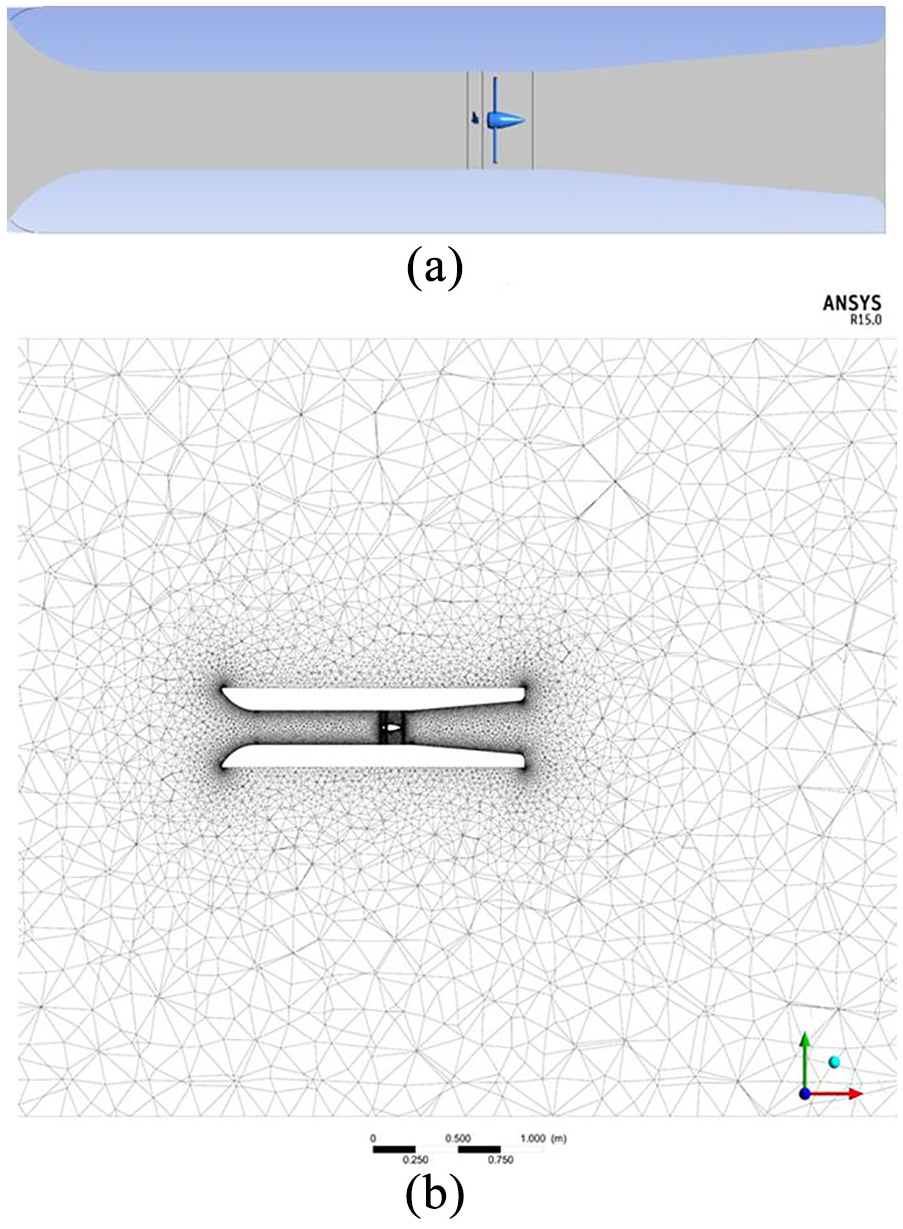
(a) Computational model and (b) computational domain with mesh.
The model was made in three separate parts to avoid meshing issues at interfaces which are required to allow one body to rotate relative to another. The mesh was divided into three parts to reduce problems during mesh generation. These are (1) main body, (2) turbine (rotating), and (3) turbine support (nonrotating). Each part was modeled separately and then saved as a SolidWorks part file. The eventual flow domain had a size of
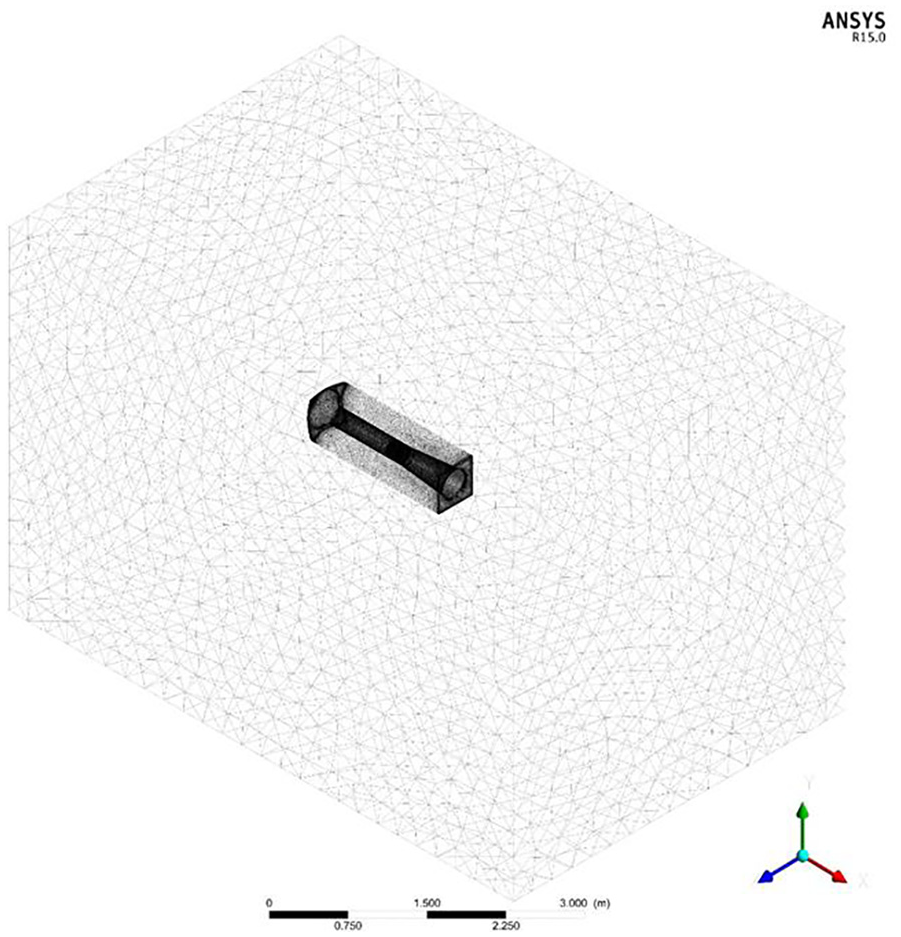
Computational flow domain with mesh.
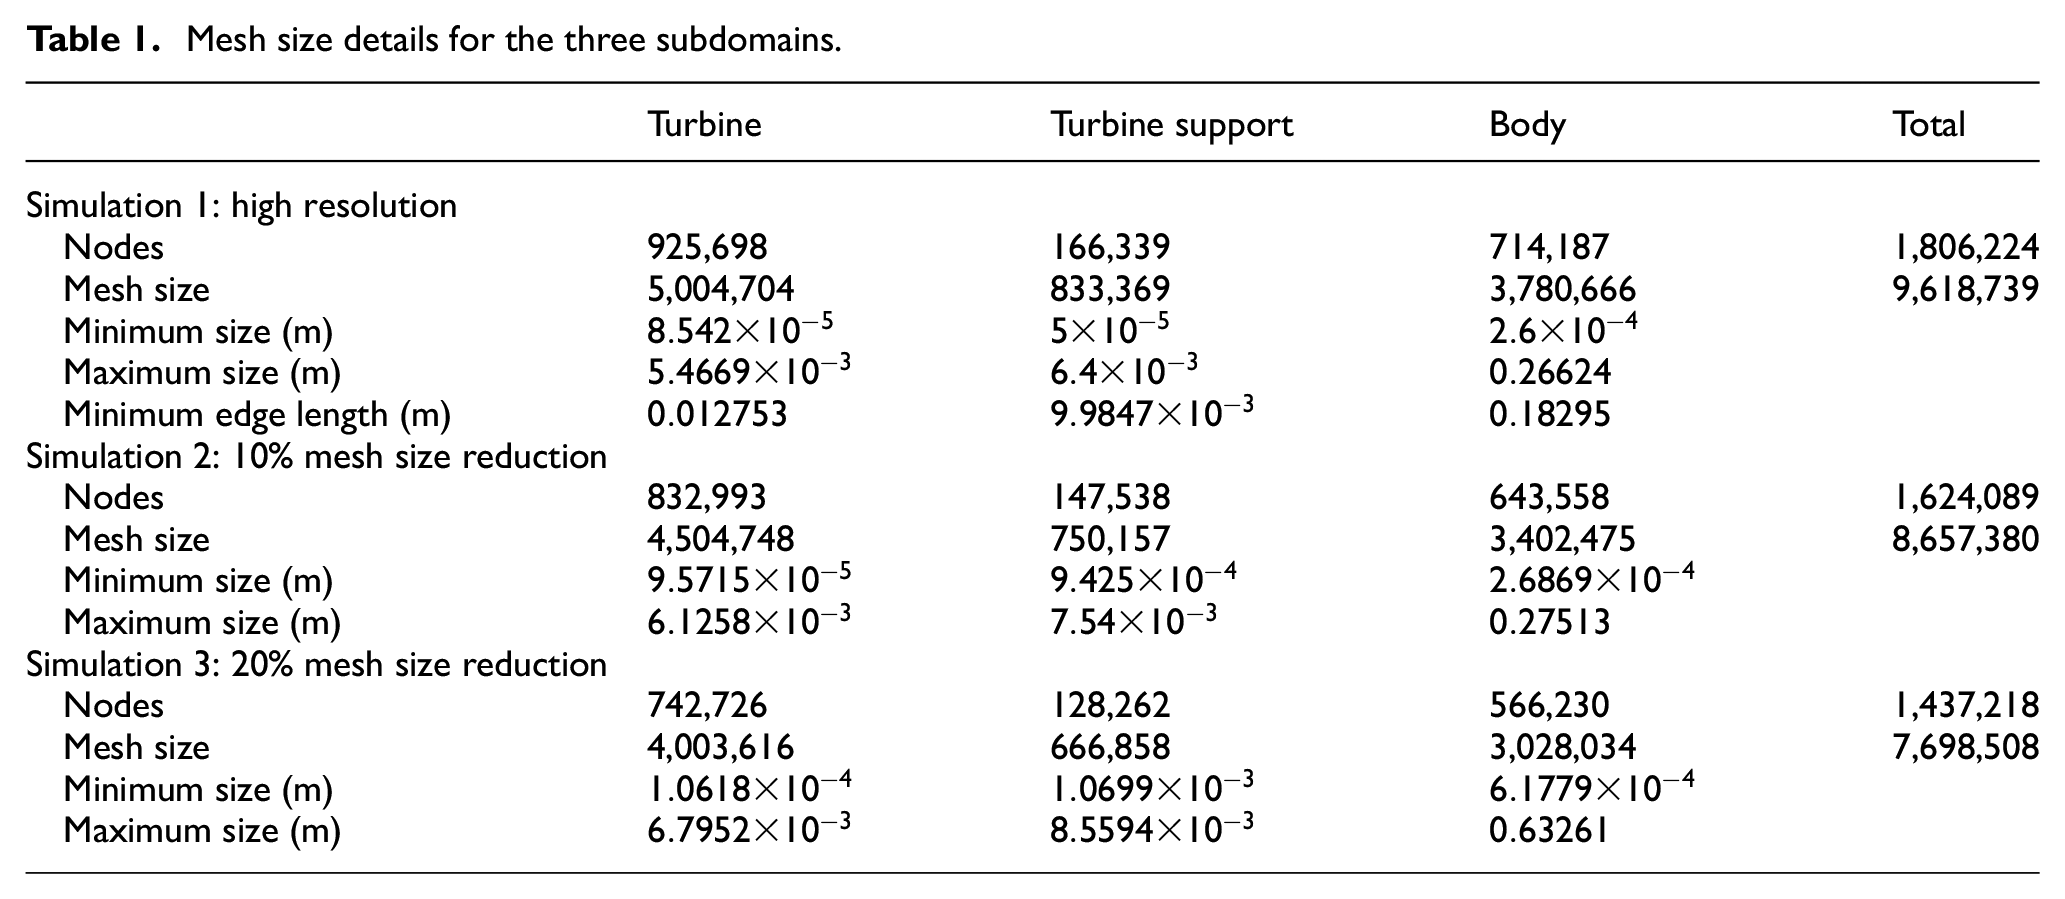
Grid size independent solutions were tested for three different mesh sizes. Table 1 gives information related to the mesh used in the three different subdomains for three different mesh sizes. The minimum grid size in simulation 1 which had the highest resolution with nearly
Mesh size details for the three subdomains.
To compute the motion of the wind turbine rotor due to an applied torque, one can apply the rigid-body conservation of angular momentum to the rotor assuming a single degree of freedom

where J is the mass moment of inertia of the generator rotors,

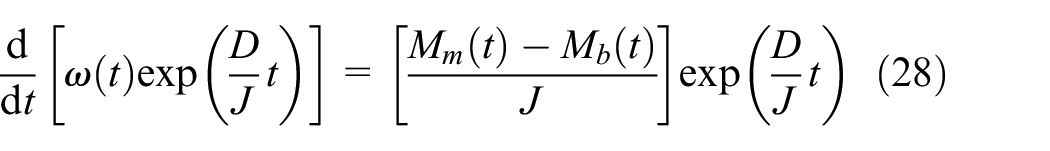
where D is the generator damping coefficient, which has been determined experimentally. Substituting equation (26) into equation (25) and rewriting the expression in terms of the angular velocity

The first-order differential equation in equation (27) can be solved by utilizing an integrating factor
Considering an incremental period of time (from t to
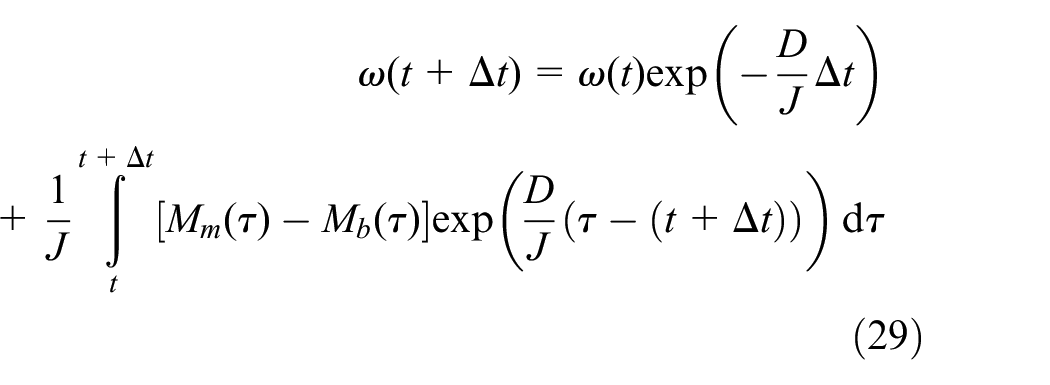
The change in the angular position of the rotor is found from the definition of

The manner in which equations (26) and (27) were employed to determine the motion of the rotor is laid out in the following steps:
At time
The new angular position
The torques acting on the rotor are determined by the CFD solver at time
Using the known
The result is then substituted into equation (30) to obtain the new location
Repeat Steps 3 to 5 for subsequent timesteps.
The timestep was selected to satisfy the Courant–Friedrichs–Lewy (CFL) condition that the distance that any information travels during the timestep length within the mesh must be lower than the distance between mesh elements. The present calculations are carried out with a timestep value of
It is also important to note that the present computations of the scaled-down Ahmed body were carried out under the same conditions the experimental wind tunnel data were obtained, that is, away from the wall and under the same incoming flow velocity of
The present flow is the result of a mutual interaction between the external flow which imposes a pressure gradient between the front and the rear of the vehicle and the internal flow through the duct. The internal flow through the duct exhausts into the wake and therefore affects the back pressure and tends to reduce the pressure gradient. A balanced distribution of meshing between the external and internal flow domains is critical in establishing the flow field. Coarse meshing of the flow domain inside the duct and fine mesh in the external flow will underestimate the captured flow rate through the duct, while a coarse mesh in the external flow domain will not set up the correct pressure gradient to drive the duct flow. As mentioned earlier, three different grids were used to test the convergence and mesh independence solution. The results are shown in Figure 14 where the area-weighted velocity through the duct is plotted as a function of flow time for the three different meshes whose bulk characteristics are listed in Table 1. It appears that the solutions obtained in simulations using the mesh of simulations 1 and 2 converged within 0.4% from each other. The minimum mesh size near the body of the vehicle used in simulation 1 was 0.26 mm which was considered to be adequate to resolve viscous boundary layers with a thickness of a few millimeters. As mentioned earlier, the mesh resolution close to the turbine blades was
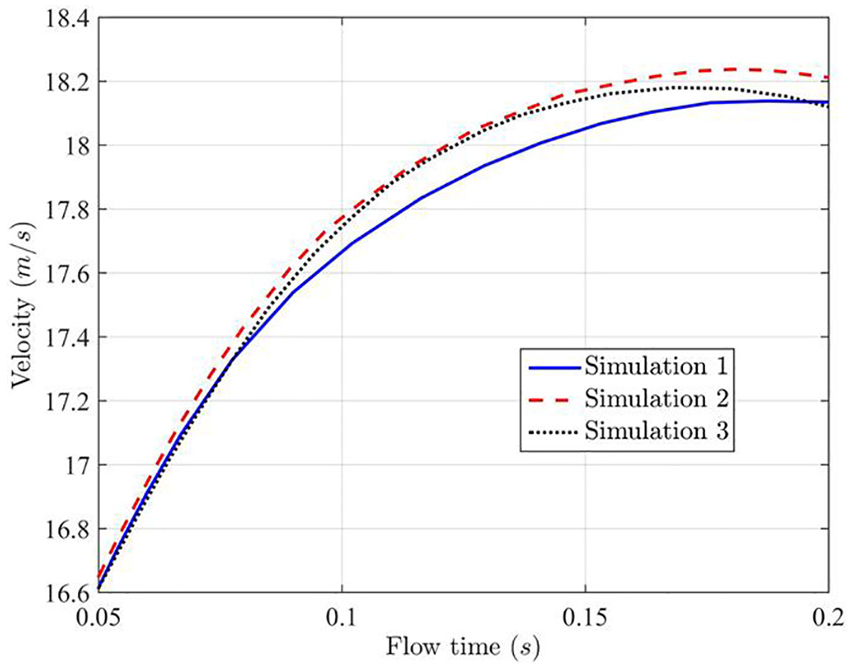
Solution convergence for three different mesh sizes: area-weighted velocity inside duct.
Computational results
Figure 15(a) shows velocity magnitude contours of the flow domain with the turbine inside the model for the case of the external velocity

(a) Global view of computed velocity magnitude contours
The steady-state equilibrium value of the angular velocity of the rotating turbine was calculated to be
Figure 16(a) and (b) shows vorticity magnitude contours distribution in the overall flow field and in the turbine area of the duct, respectively. The boundary layers developing over the external and internal surfaces are visible since the scale resolution is very satisfactory. In fact, the blade seems to cut through the boundary layer in the duct flow (Figure 16(b)). Figure 17(a) shows the vortex core regions in the turbine area found by thresholding the entrophy contours. In this figure, the three blades of the turbine are shown together with the three cylindrical supports of the turbine motor assembly. The helical tip vortices are evident even though they have interacted with the internal wall boundary layers. Finally, Figure 17(b) shows the transient development of the voltage output, which, in the beginning, is proportional to time and eventually reaches a steady-state value of about

(a) Global view of computed vorticity magnitude contours

(a) Computed vortex core region contours based on velocity
The computational data of average velocity within the venting duct, the drag force, and the output voltage of the wind turbine were compared directly with the available corresponding experimental results obtained in the wind tunnel testing. Table 2 lists this comparison between the computational results and the experimental data of bulk quantities. It should be noted here that both models used in the wind tunnel experiments and CFD simulations were identical and under the same flow conditions. The experimental results appear to be consistently lower than the CFD data by about 5% on voltage, 6% on velocity, and 13% on mass flow rate and drag.
Comparison of CFD and experimental results at

CFD: computational fluid dynamics.
Significance and concluding remarks
Our theoretical, computational, and experimental work indicated some significant trends and prospects in harnessing the kinetic energy of fluids in a moving frame as is the case for moving vehicles, passenger cars, or trucks to power some of their electrical systems. In such moving environments, the specific power of the air motion is much greater and less intermittent than in stationary wind turbines anchored to the ground and operating in open atmospheric conditions. The ratio of corresponding specific power outputs of a device moving at
In the present research, we explored for the first time the prospects of harnessing wind energy from moving vehicles by analyzing the flow through and around a generic Ahmed body. This has been accomplished by carrying out several experimental, theoretical, and computational tasks that illuminated some of the challenges associated with the prospects of new technologies that extract energy from wind in a moving frame. The work has clearly shown the benefits discovered by adding the duct to the vehicle tested, which is associated with a drag reduction due, not only to the change in the cross-sectional area of the model but also to reenergizing the wake by the exhaust flow through the duct. The power ratio achieved in the present configuration is 3.26 in reference to a stand-alone similar wind turbine in the open atmosphere. The driving force of the flow through the device is clearly the pressure gradient imposed by the stagnating conditions up-front and the negative back pressure in the rear. Ideally, the greater the pressure difference between the front and back pressures, the higher the velocity inside the duct should be. Thus, vehicles with lower negative back pressure and therefore higher drag may provide better conditions in capturing flows with higher mass flow rate through the duct. Counteracting on this, however, are the frictional forces developing over the internal surface of the duct, which are proportional to
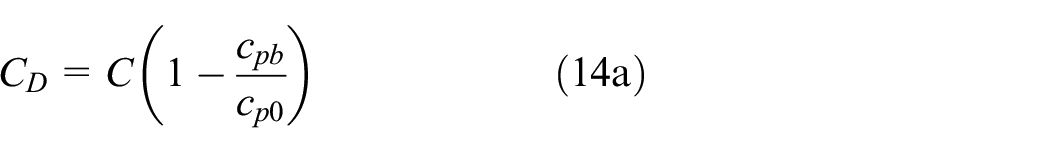
As mentioned earlier, most of the drag of bluff bodies and particularly of vehicles is due to pressure drag, which is generated at the rear end. The structure of the wake which affects the back pressure is very complex, with a separation zone and counter-rotating vortices coming off the side edges, whose strength is mainly determined by the base surface angle. Values of the coefficient of pressure at the rear end of bluff bodies
Moving against the wind, as in the conventional application for a classical wind turbine shown in a previous work 32 where the moving frame is a bicycle, is a special case of the present work. The theoretical framework developed here is more general since it covers man-powered or auto-powered vehicles. Particularly, in the present research, we identified some specific areas inside or outside moving vehicles with local velocities greater than the translation velocity of the vehicle where net energy extraction is possible. Further research is needed to locate additional positions inside or outside vehicles where energy extraction may be meaningful. Optimization of the size of the duct and Venturi section, which are restricted by the limited availability of space, along with the diffuser design, which controls the exit pressure of the venting flow, should be further studied. It is desirable to capture the maximum possible flow rate inside the venting duct. Therefore, we envision that the bottom part of the engine compartment will be sealed off so that air entering the area under the hood will be eventually flowing toward the venting duct where the wind turbine will be located.
Footnotes
Acknowledgements
The authors thank Jose Cortez, Ali Moussa, and Yussef Rickli for their contributions to the preliminary computations.
Handling Editor: James Baldwin
Declaration of conflicting interests
The author(s) declared no potential conflicts of interest with respect to the research, authorship, and/or publication of this article.
Funding
The author(s) disclosed receipt of the following financial support for the research, authorship, and/or publication of this article: The financial support provided by the Pope Fund is greatly acknowledged. Provisional patent # 61941633.