
Abstract
Model updating techniques are commonly used to improve simulation accuracy. Experimental data of component testing under laboratory conditions are normally used to improve analytical predictions of that component under operational conditions. In this study, we have applied these techniques to the dynamics of turbomachinery components. Dynamics of turbomachinery rotor components are normally analysed assuming perfect cyclic symmetry of the basis sector (one blade and its corresponding part of the disc) and this sector is mechanically the same in every angular position. However, the manufacturing process introduces small differences among sectors (mistuning) and changes the global dynamic behaviour. There are several analytical approaches in the literature to model these differences with reduced order models of the whole rotor that include the frequency differences among sectors, which can be obtained experimentally in a component test. Several approaches in the literature use experimental results from a test with a particular set-up in order to obtain the inputs for the models. The approach proposed in this article is just to perform a standard modal test that generates the input for model updating and to extract from the updated model the required input for representing the mistuning phenomena in turbomachinery rotor components.
Introduction
Aeroengine industry is demanding lighter turbomachinery to increase efficiency and save cost. This tendency implies thinner blade designs and its dynamic behaviour is becoming a key aspect in terms of high-cycle fatigue (HCF) and its relevance in design feasibility, especially in rotor parts where static contribution of the centrifugal load reduces the alternating stress margin.
In addition, there are some rotor designs (more common in the compressor side of the aeroengine) where the blades are manufactured in the same part of the disc. This component, which is known in the literature as integrated bladed rotor (IBR) or blisk, is more sensible to the mistuning. 1 This effect caused by the small differences among sectors (mainly due to manufacturing) makes the more responding sector behave significantly worse than an ideal component with all the sectors identical (which is the assumption of the cyclic symmetry analysis normally used in turbomachinery analysis). 2
A correct simulation of the mistuning phenomena is key in the current designs of these rotor components. There are several approaches in the literature 3 to model these differences with reduced order models (ROMs) of the whole rotor, where differences in mass or stiffness are introduced to represent the frequency differences among sectors (as the methods proposed by Petrov et al. 4 and Feiner and Griffin 5 ). The differences among sectors are characterized as differences in frequencies of the isolated sector, which are normally obtained experimentally in a ping test. This kind of test is not straightforward for an IBR/blisk, and the literature reflects different options.6–9
Although model updating techniques have been applied to represent the global behaviour of rotor systems,10,11 this article takes a step forward and applies these techniques to represent the mistuning phenomena in rotor components. The idea is to perform a standard modal test that characterizes dynamically the whole structure. The experimental results will be used to identify the global mode shapes and these mode shapes are used for updating a finite element model (FEM), which initially assumes perfect cyclic symmetry. Afterwards, the updating model will be used to calculate the individual frequencies that other approaches intend to extract directly from a more complex test (adding damping material 6 or masses7,8 to the non-tested blades). Finally, these individual frequencies can be used as inputs to any of the ROMs available in the literature. 3
This procedure (see Figure 1) has been applied to a dummy structure of six sectors:
The experimental test has been performed in ITP Aero facilities.
The numerical work has been done in UPV/EHU. The commercial software used in the second part are as follows: LMS Test.Lab for the experimental modal analysis (EMA); ANSYS for generating the FEM; FEMtools for the model updating.

Scheme of the model updating procedure.
Experimental data
A dynamic test characterization has been performed on a dummy structure of six sectors. These sectors are aluminium plates (which represent the blades of the component) clamped by a steel core (which represents the disc of the component).
Test set-up
The structure lies on foam to represent the free condition. The excitation system is a set of six piezoelectric shakers (one on each blade), so the blades can be excited independently. Several positions for the shakers have been proved (Figure 2).
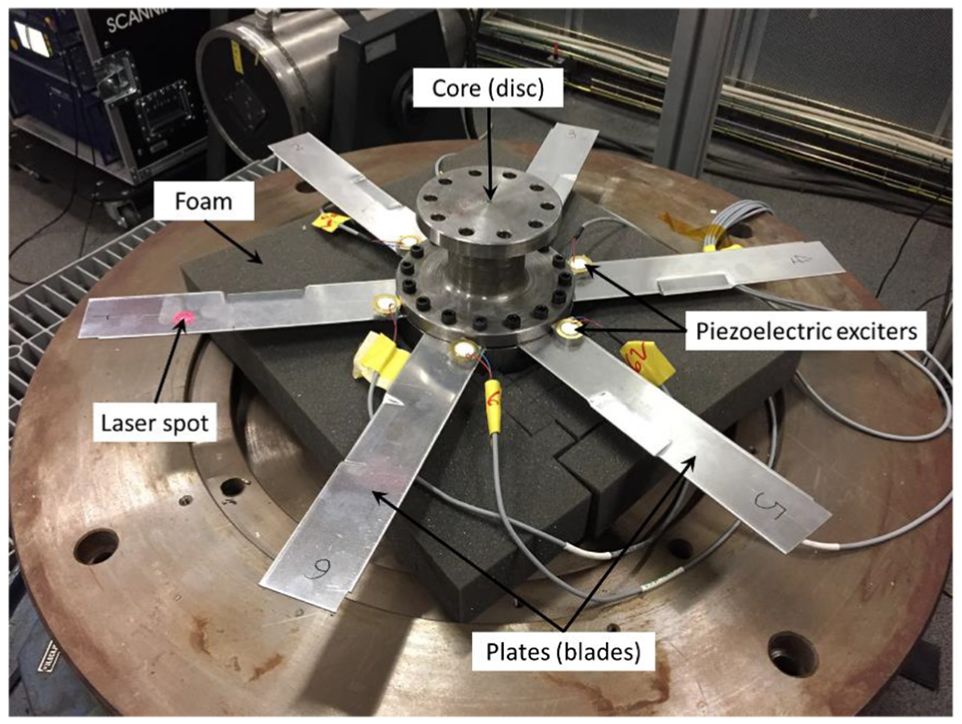
Dummy structure on foam with the piezoelectric shakers on the base of the blades.
The measurement system is a scanning head, which allows obtaining multiple point responses for the same excitation case. The laser measured from the top (measurement direction perpendicular to the blades) and Figure 3 shows the mesh of points measured for each case.

Dummy structure and measurement points used in the test (shakers on the bottom side).
The final set-up was defined with shakers around the mid-span of the blades and on the opposite side of the laser in order to have a laser measurement on the same point of excitation (point is marked on Figure 3).
Test equipment
The test has been performed in the range of 0–600 Hz. Excitation force was transmitted by means of piezoelectric diaphragms (muRata 7BB-10-3), one glued at the same location in every plate. Only one at a time was excited during every test.
These diaphragms were powered in every test with a signal of ‘Periodic Chirp’ type at a level of 100 mV. The generator used for this was the one available with the Polytec Scanning Vibrometer Station PSV-400 (type NI 671x) (Figure 4).

Scheme of the test equipment (excitation and measurement).
The responses were also measured using the Polytec Scanning Vibrometer Station PSV-400 (Scanning Head PSV-I-400 and its controller OFV-5000).
The data acquisition and post-processing were carried out by the Polytec Data Management System PSV-W-401 and its software (Table 1). The response (laser velocity) is measured on a grid of points, and the system acquires also the waveform generator signal as a reference for building the forced response functions (FRFs). The acquisition board on the Polytec system is National Instruments PCI-4462.
Acquisition and post-processing parameters.

FFT: fast Fourier transform.
Test execution and results
The test cases have been run using only one shaker at each time (only one blade excited but measuring all the blades in the whole mesh of points). Six different cases have been run (one per blade).
Regarding the quality of the measurements (Figure 5):
The first family of modes (1-flap of the blades, around 30 Hz) has noisy readings around its frequency and no modes were identified by the EMA (therefore it has been discarded for the objective of this article);
The second family of modes (2-flap of the blades, around 185 Hz) has been quite clear and considered as the main target of this study;
The third family of modes (1-torsion of the blades, around 260 Hz) has been clear, but finally discarded as the mesh density of the measurement point was not enough for capturing torsion modes adequately;
The fourth family of modes (3-flap of the blades, around 475 Hz and the last in the test range) has also been clear and considered as the second target of this article.

FRF sum response and selection of the mode shapes to study.
Modal identification
FRFs of the six test cases acquired by the scanning head and the coordinates of the measured points have been exported to Universal File Format (UFF).
The modal analysis module of LMS Test.Lab software has been used for the EMA performed in this article. The analyses have been focused on the two families of modes with more clear results:
2-flap modes, in the range of 170–200 Hz;
3-flap modes, in the range of 450–500 Hz.
Initial EMA performed, which only considered one of the test cases (measurement results with only exciting one blade), did not identify all the modes in the family. As the structure has six sectors, each of the families contains six different global modes, but exciting only one blade, all the modes are not properly excited.
For a correct modal identification, the measurements of the six test cases have to be considered (as all the test case measurements have been performed using the same mesh, all the measurements can be used together in the EMA).
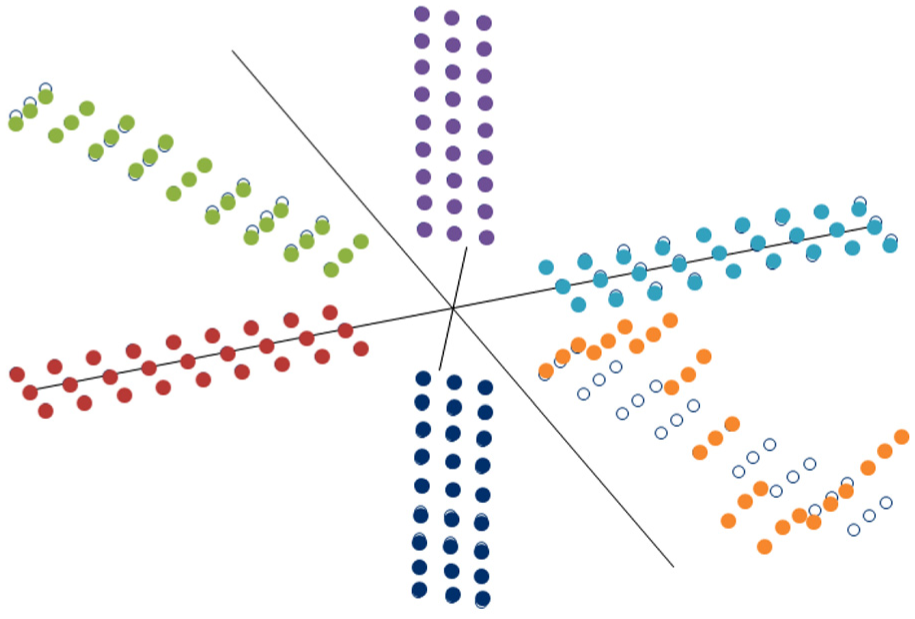
Considering all the measurements, those six modes of each of the two families of interest have been clearly identified (see Figures 6 and 7).
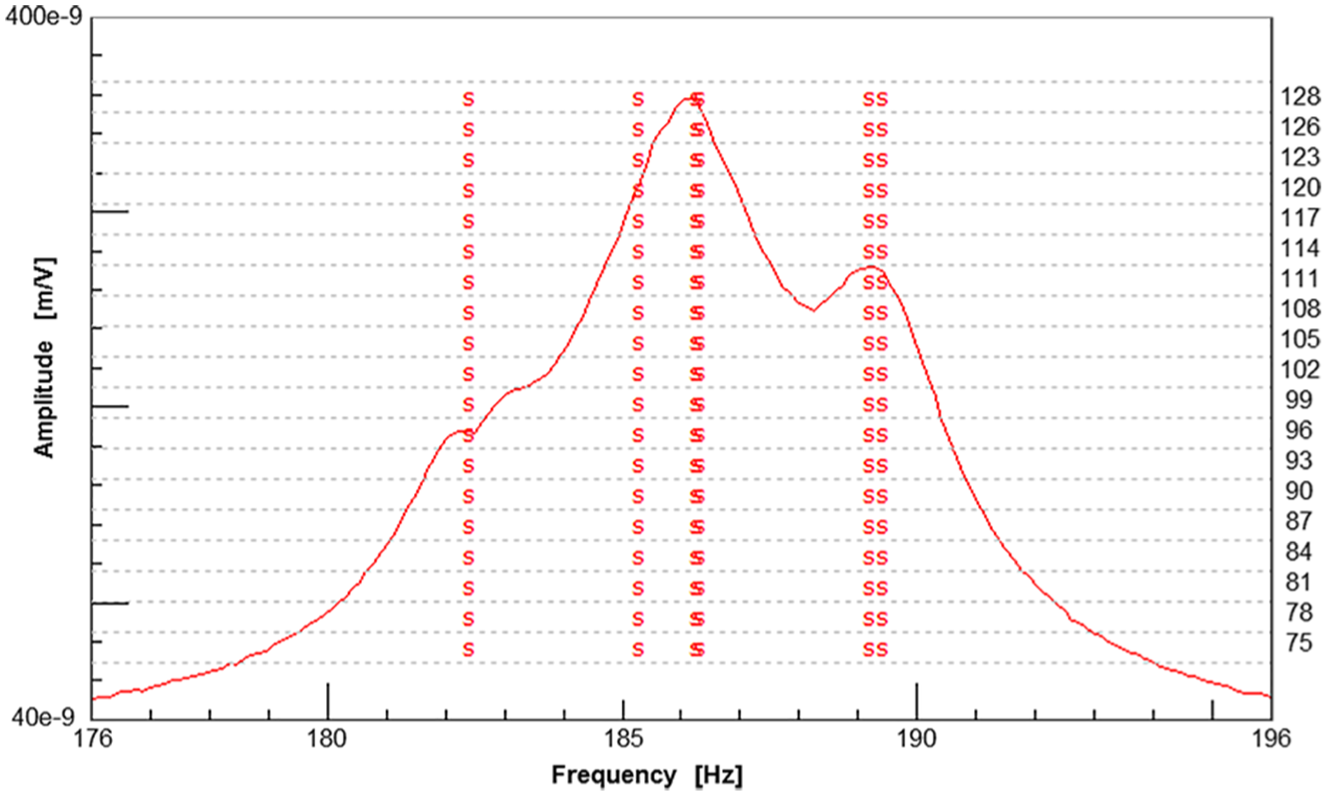
Modal identification for the second flap family (2-flap).

Modal identification for the third flap family (3-flap).
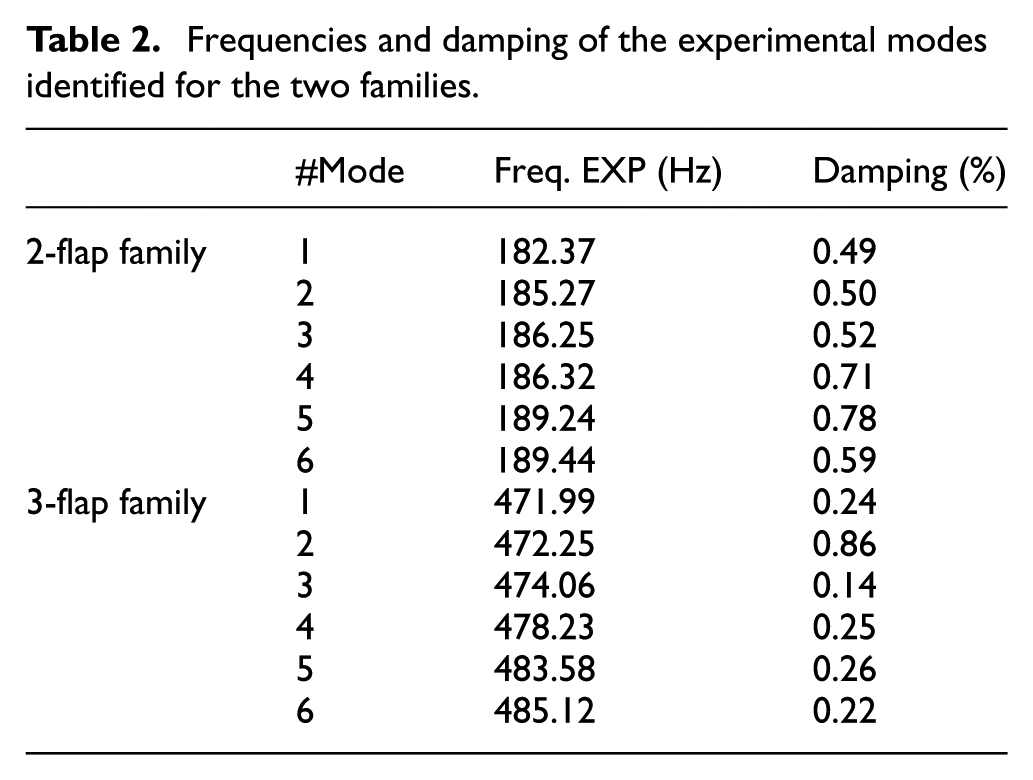
Results of the identified modes (see summary of frequencies and damping in Table 2) were also exported to universal files (UFF).
Frequencies and damping of the experimental modes identified for the two families.
Model update
The experimental modes identified for both families will be used for generating an updated model. The main source of difference among sectors was expected to be the joint between the plates (blades) and the core (disc). As the stiffness of this feature is represented only with the Young modulus E and can affect differently each of the family modes, the model updating was performed family by family (one updating analysis per family). The model updating was done with the FEMtools software, and the following sections described the steps followed.
Initial FEM and correlation
An FEM was built in the ANSYS software to represent the whole structure. A basic sector was meshed, and this mesh was replicated another five times to complete the structure and ensure that the six sectors were identical in order to have cyclic symmetry not only in the geometry but also in the mesh (and avoid any mathematical mistuning due to uneven mesh).
The mesh characteristics are as follows:
Second-order tetrahedrons;
Only one mesh body with different domains (merged nodes in the domain boundaries);
4722 elements per sector (28,332 elements in the whole structure);
Two elements in thickness at the joint area.
The mesh was exported from ANSYS to a file format that was readable by FEMtools. Also the mesh of the experimental measurement points (which was previously exported to an UFF universal file) was imported in FEMtools. A correlation between FEM nodes and experimental points was made with a good match (see Figure 8).

Correlation between experimental points and FEM nodes.
A modal analysis was run with FEMtools under free condition (the same as the tested one). Modal assurance criterion (MAC) has been used for the comparison of the analytical results with the experimental ones:
Frequencies in Table 3 show a general difference between the analysis and experiment, as the geometry was not exactly reproduced in the FEM (some geometry simplification). However, this effect can easily be solved by a change of global E or density and has no influence on the effect of the difference among sectors.
2-flap family seems to have two of the six modes with a reasonable match (see Figure 9), but the relative frequency differences are high (see Table 3). The other four modes show both bad mode shape and frequency match.
3-flap family shows the six modes with a bad match, for both frequencies (see Table 3) and mode shapes (see Figure 9).
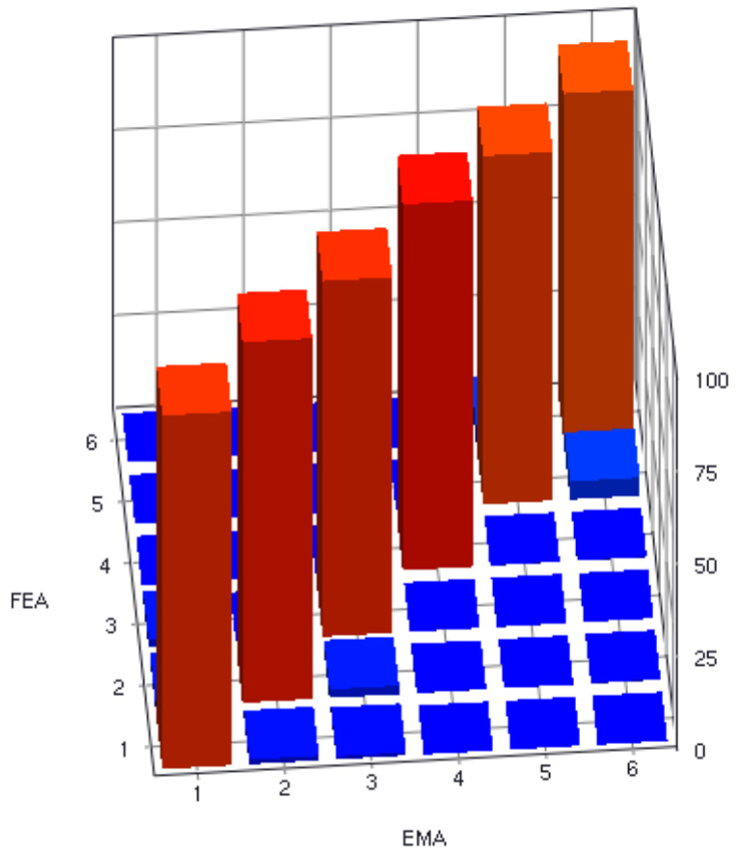
Frequency differences and MAC results for the initial FEM with cyclic symmetry.
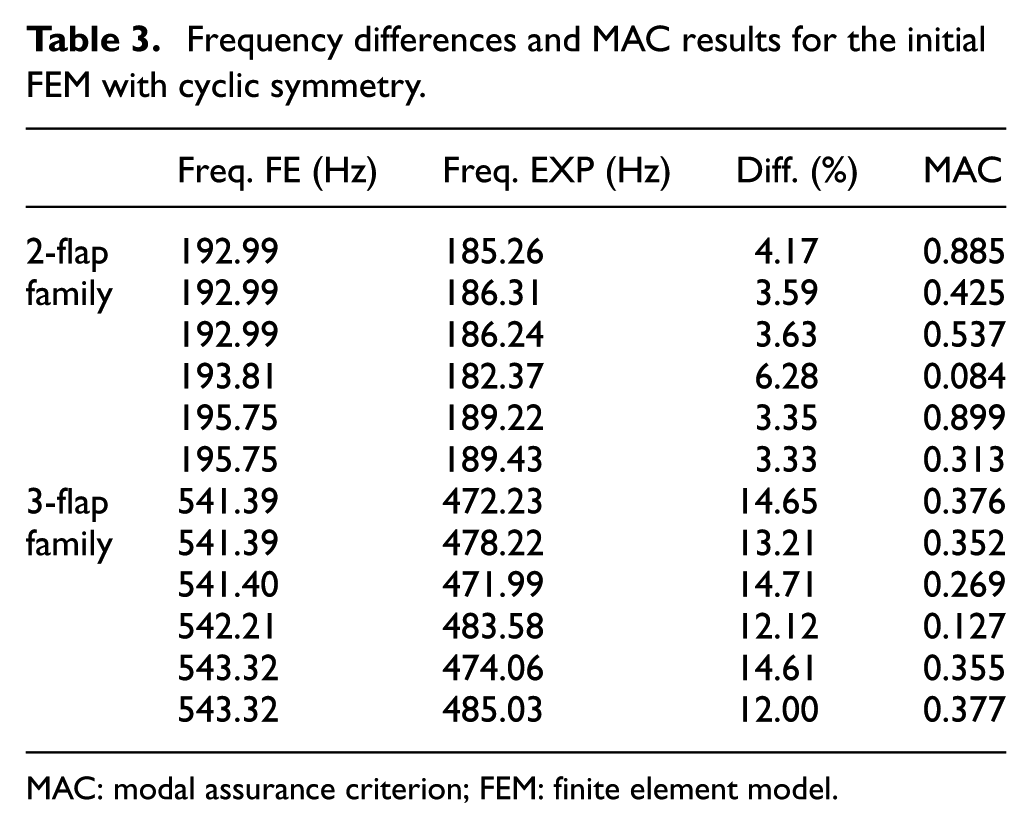
MAC: modal assurance criterion; FEM: finite element model.
Correlation between EMA and initial FEM (top: 2-flap family; bottom: 3-flap family).
Updating parameters
A total of 13 sections have been defined for the structure (as shown in Figure 10):
Core of the structure (disc section);
Main part of the plate (blade section, one per sector);
A reduced part of the plate (root) to represent the stiffness of the joint (joint section, one per sector).

Sections defined for the updating parameters.
The main doubts were related with the stiffness (especially in the joint between blades and the disc). As the main target of model updating is obtaining the individual frequencies, the effect on the frequency of this joint has been represented just by changing the Young modulus E of the joint domain (the domain size has been defined large enough to cover the influence area). So the parameters selected for changes during the updating were the Young moduli E of the different sections.
As the stiffness effect of the joint is only represented by a global parameter of the domain around the joint, this parameter can exhibit a different behaviour depending on the family mode and it is not possible to obtain a global model update valid for all the modes. Therefore, the two families of interest have been considered in two different model updating analyses, obtaining different updated models.
After several initial trials, the preliminary updating results showed that the joints were the only sections that have significant influence on the difference between the analysis and experiment. Based on that, the parameters selected for the model updating included in this article are the E values of the six joint domains of the structure (the disc and blade sections have not been considered).
The target of the updating analyses has been both the frequencies and the MAC values (12 responses for each family of six modes). The convergence criterion for resonance is defined as the weighted absolute relative difference between paired resonance frequencies. The criterion for MAC is defined as the average margin of the MAC values for the paired mode shapes.
Updated FEM results for the 2-flap family
The updating analysis case for this 2-flap family had difficulties in meeting the defined convergence criteria. The updating was finally run in two steps with different range limitations to the parameters (more flexible in the first step and less in the second one).
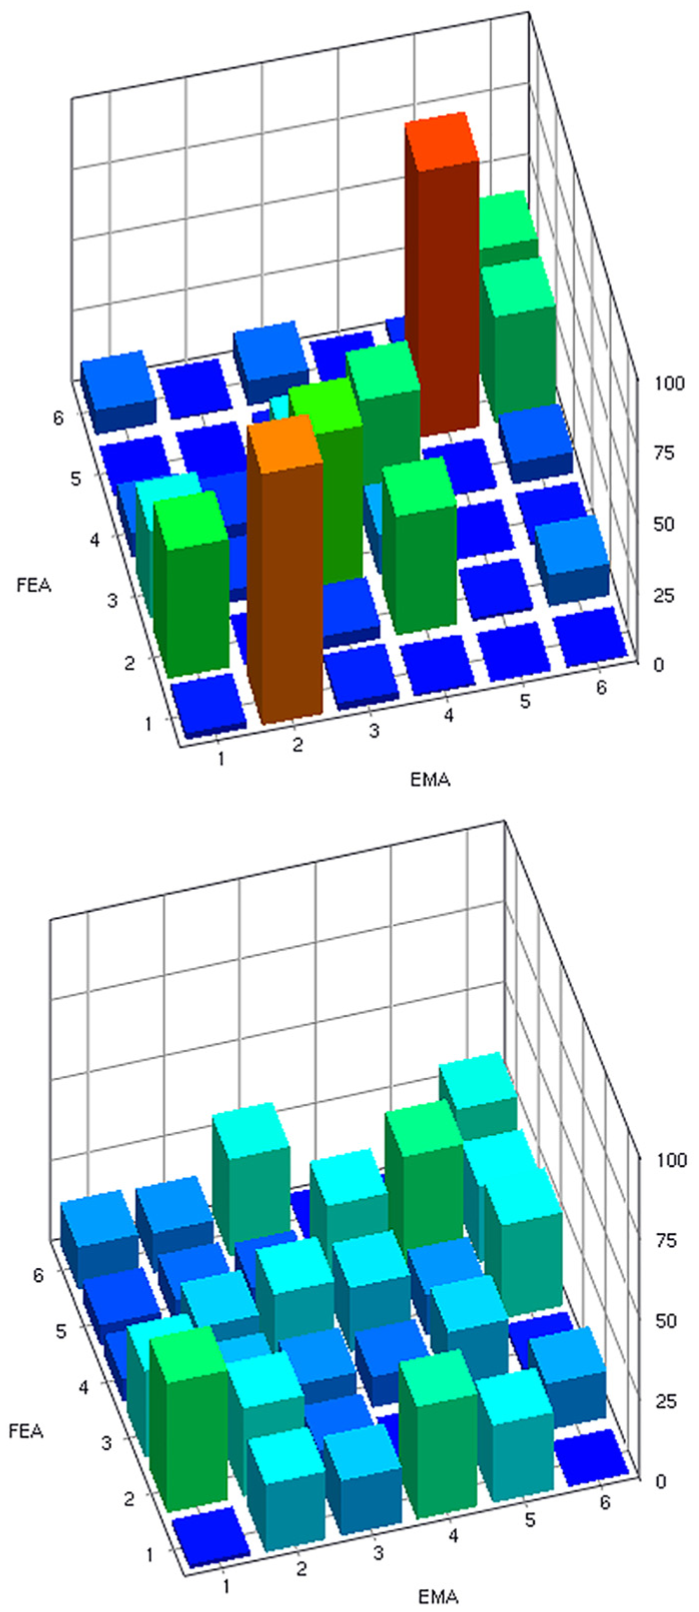
In addition, depending on the parameter limitations, results of the model tend to converge to two different solutions, with a similar level of match. Results of frequencies and MAC correlation are presented in Table 4 and Figure 11 for both solutions.
Frequency differences and MAC results for the updated FEMs (2-flap family).
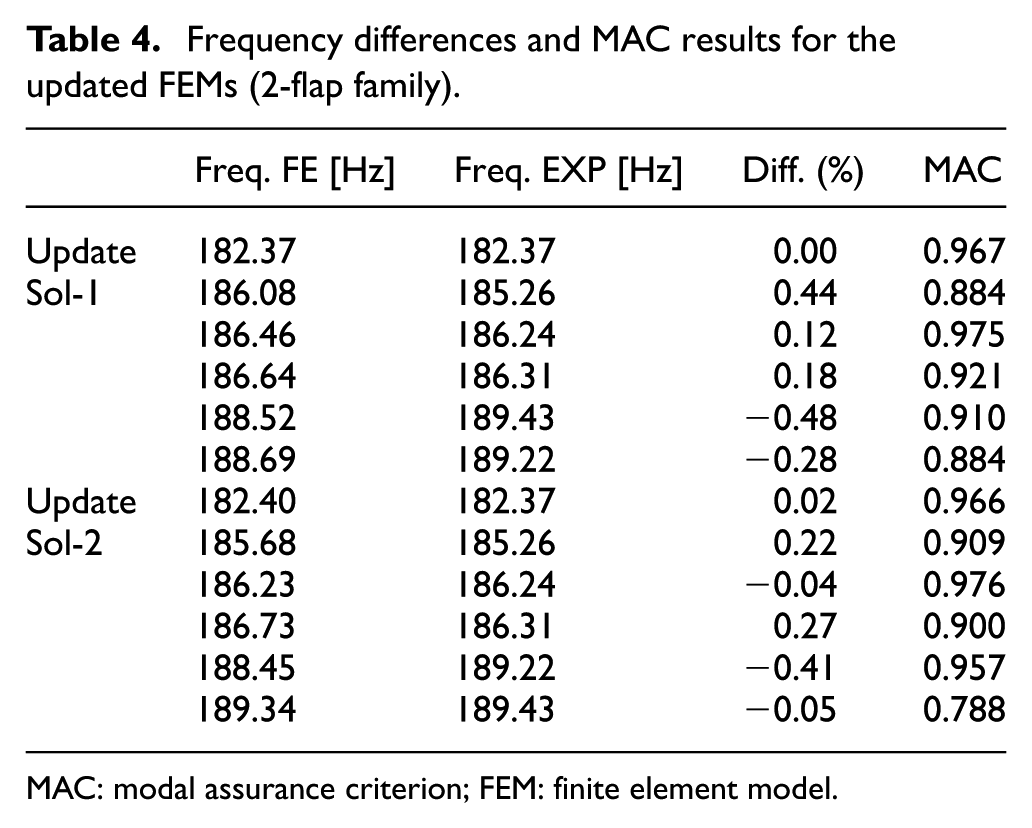
MAC: modal assurance criterion; FEM: finite element model.

Correlation between EMA and updated FEMs (top: Sol-1; bottom: Sol-2).
None of the solutions shows enough accuracy for all the modes:
The value of 182.37 Hz is the only good match in both solutions (high MAC value and almost no frequency error);
Rest of the modes have differences depending on the solution (in general, significant frequency differences and MAC values not reaching 0.9 in several modes).
A particularity of the lowest frequency mode shape is that the movement is mainly focused on the second blade (it is the only experimental mode of the family that shows an almost decoupled mode). The rest of the modes show movements in several blades (this different behaviour can be observed in Figure 12).
Modal shapes of 182.37 Hz (top: almost decoupled) and 189.22 Hz (bottom: highly coupled).
Updated FEM results for the 3-flap family
The updating analysis case for the 3-flap family had no difficulties in meeting the convergence criteria defined. The updating was run in a few iterations.
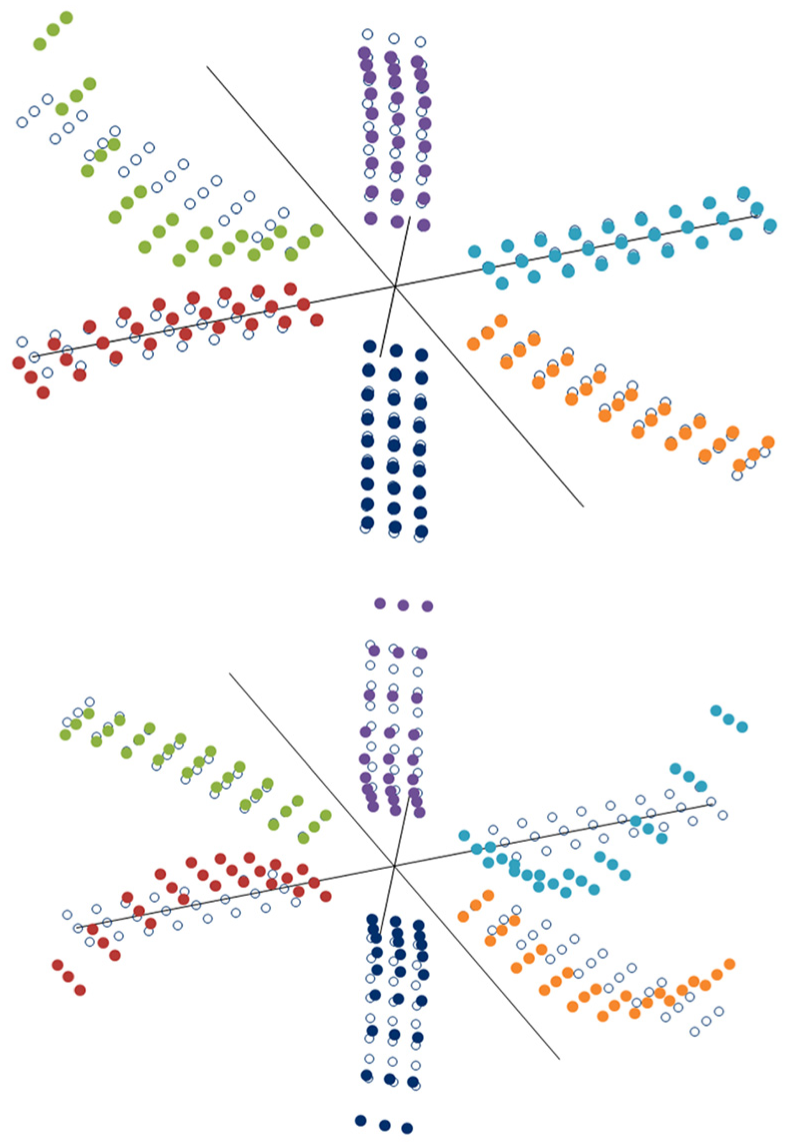
No matter which the parameter limitations were, the results of the model tend to converge to the same solution, with a high level of match (almost no errors in frequencies and all MAC values above 0.9). Results of frequencies and MAC correlation are presented in Table 5 and Figure 13.
Frequency differences and MAC results for the updated FEM (3-flap family).
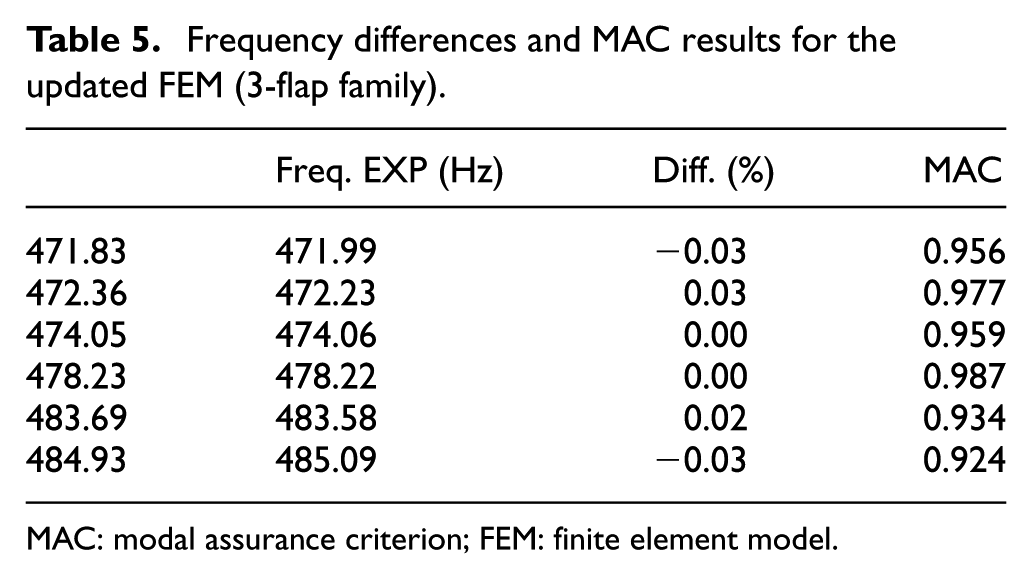
MAC: modal assurance criterion; FEM: finite element model.
Correlation between experimental modes and the updated FEM (3-flap family).
The particularity of the lowest frequency mode shape in the 2-flap family (mode shape with movement mainly on the one blade) is the behaviour of the six modes of this 3-flap family (example in Figure 14).
Modal shape of 478.58 Hz (decoupled).
Individual frequencies for mistuning simulation
In order to apply any of the ROMs available in the literature, 3 the last step is obtaining the individual frequencies of each blade.
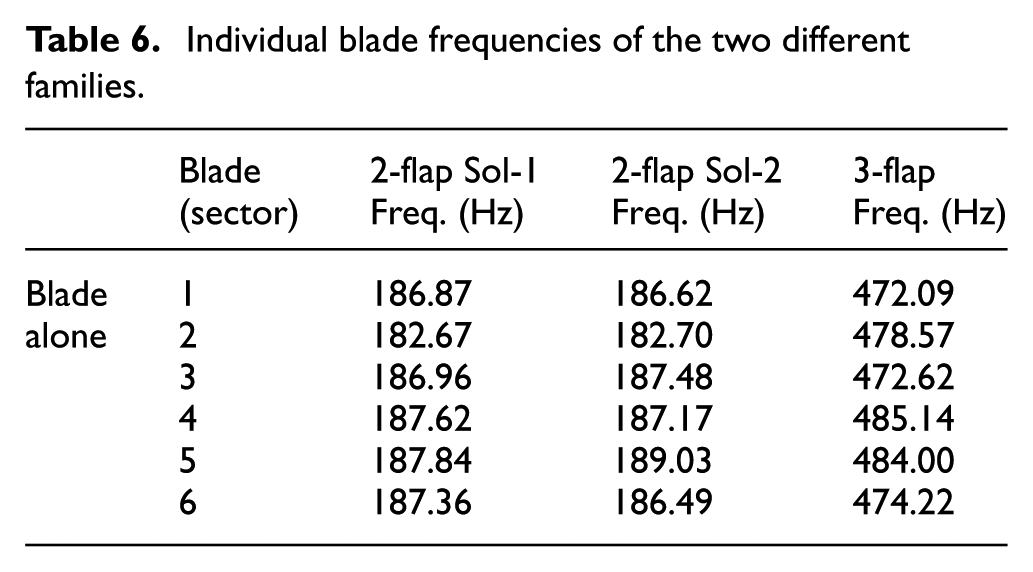
The updated model has been restrained by fixed boundary conditions on every domain that is not part of the interest sector. With this condition, the modal analysis gave the frequency results of that individual sector. Repeating this type of analysis for every sector, the frequencies in Table 6 are obtained.
Individual blade frequencies of the two different families.
Conclusion
An experimental test has been performed to obtain the modal characteristic of a dummy structure, which is representative of a rotor component of aeronautical turbomachinery. Experimental readings had been good enough for the modal identification of two families. These two families have been clearly identified, obtaining the required modal data for a model updating analysis.
Model updating analyses have been run with both frequencies and MAC values as the targets. The results obtained have different levels of accuracy depending on the family. This difference in accuracy is related to the level of coupling among sector movements:
Updating works for family modes where each sector movement is nearly decoupled with the other sectors (high accuracy in frequencies and high levels of MAC), as in the 3-flap family of the structure studied in this article;
Updating does not work properly with family modes where sector movements are coupled with other sectors (several optimal cases appeared, and with less accuracy in frequencies and lower levels of MAC), as in the 2-flap family of the structure studied in this article.
Updated models have been used for the calculation of individual frequencies of every blade, which is the input required by any of the ROMs for the mistuning simulation available in the literature. 3
As real turbomachinery rotor structures have more than six sectors, the mode coupling probability in the families is higher and model updating techniques will require high-quality experiments for representing them accurately.
Footnotes
Acknowledgements
The authors thank ITP Aero for giving permission to publish this work.
Handling Editor: Jose Ramon Serrano
Declaration of conflicting interests
The author(s) declared no potential conflicts of interest with respect to the research, authorship and/or publication of this article.
Funding
The author(s) disclosed receipt of the following financial support for the research, authorship and/or publication of this article: The authors wish to acknowledge the financial support received from the Department of Research and Development of the Basque Government (GV IT947-16) to develop the numerical work presented in this paper. The experimental task described in this paper has been developed inside the IDI-20171192 project (‘Adquisición de Tecnologías Básicas de Compresor 2’) with funding by the ‘Centro para el Desarrollo Tecnológico Industrial – CDTI’ (Spanish Ministry of Economy, Industry and Competitiveness).