
Abstract
A novel method for characterizing the tensile properties of AISI 1045 steel is proposed by combining the method of in situ nanoindentation test and the theory of mesomechanical analysis. First, the load–depth curves of exact location of ferrite, pearlite and grain boundary on the surface of AISI 1045 steel are obtained by 30 groups of in situ nanoindentation tests. The constitutive equation (stress–strain function) of the real-time metallographic structure is obtained by nanoindentation analysis of the above curves. Then, based on the principle of mesomechanical analysis, the computational representative volume element models are reconstructed according to the three metallographic images of AISI 1045 steel surface collected by the test equipment. Finally, taking the constitutive equation of the real-time metallographic structure as the input condition, the finite element analysis of the above representative volume element models are carried out. The data resulted from finite element analysis are taken as the tensile mechanical properties of AISI 1045 steel. The elastic modulus of AISI 1045 steel calculated is as the same as that by the traditional nanoindentation method. And, the error is less than 6% compared with the tensile test, which is within the range of the elastic modulus of the material. The error between the yield strength calculated and tensile test results is 3.4%. Due to the influence of surface cracks on the plastic deformation ability of AISI 1045 steel during tension, the error between the strain hardening index calculated and tensile test results is 7.4%. The results show that it is a more accurate nondestructive testing method in the point of material damage mechanism. On the premise of using more accurate representative volume element modelling way, this method is suitable for testing more materials.
Keywords
Introduction
The relationship between nanoindentation curves and tensile properties of materials has attracted wide attention. The conventional nanoindentation methods mainly focus on characterizing the mechanical properties of homogeneous materials with single structure1–3 or local areas on the surface of materials.4–6 And, the conventional inverse problem is adopted in using either the curve or the residual imprint, or the combination of both.7,8 The stress–strain functions of materials have also be obtained by calculating the metallographic content of materials.9,10 However, the conventional mesomechanical analysis often fails to introduce in situ mechanical properties of local structures. In addition, the influence of metallographic distribution on the mechanical properties of materials cannot be ignored, especially the grain boundary size and texture.11,12
In this article, a novel method for characterizing the tensile properties of AISI 1045 steel is proposed based on mesomechanical analysis using self-made in situ nanoindentation test equipment. It is a more accurate nondestructive testing method in the point of material damage mechanism. What’s more, it avoids the limitation of conventional nanoindentation on the location of sampling points. At the same time, the requirement to input material’s real mechanical properties’ parameters of metallographic structure is realized in mesomechanical analysis. First, a matrix nanoindentation test of 5 × 6 points on a specimen is carried out. The stress–strain functions at the nanoindentation points on the surface of the specimens are calculated using nanoindentation data. Second, metallographic structures (ferrite, pearlite and grain boundary) at the nanoindentation points are confirmed by in situ follow-up images. Third, three computational representative volume element (RVE) models are reconstructed from three metallographic images of the specimen. Finally, the RVE models are used as the simulation object, and the stress–strain functions of ferrite, pearlite and grain boundary are taken as the input conditions. The mechanical properties of the RVE models under uniaxial tensile stress are simulated and analysed, and the obtained constitutive curves are used as macroscopic tensile stress–strain functions of AISI 1045 steel. The in situ tensile test results of the nanoindentated specimen show that the mechanical properties calculated by this method are consistent with the damage mechanism of the material.
In this article, theoretical analysis and experimental study on normalized AISI 1045 steel with uniform metallographic structure are carried out. According to the principle adopted in this research, it is suitable for metal materials with uniform metallographic structure, or metal materials that can be created RVE models.
Experiment and methods
Experimental equipment and materials
In this study, a self-made in situ nanoindentation-tensile testing device is used, as shown in Figure 1(a). The device has been calibrated by commercial products. Figure 1(a) also shows the loading curve and control program interface. A Vickers carbide head is selected as the indenter, which is driven by a piezoceramic, as shown in Figure 1(b). The elastic modulus of the cemented carbide indenter is 710 GPa. The indenter has no wear and the indentation area is calculated according to the ideal state. The horizontal distance between the centerline of the carbide head and the centre of the microscope lens of the device is fixed. After acquiring data to generate the nanoindentation curve of the specimen, the device moves the microscope based on the aforementioned distance, and metallographic images of the indentation position are then obtained.

Experimental device and specimen: (a) testing device, (b) indenter selected and (c) shape and size of specimen.
AISI 1045 steel is a widely used carbon steel. To facilitate the reconstruction of computational RVE models, normalized AISI 1045 steel with a uniform metallographic structure is selected as the research object. The specific shape and size of specimen are shown in Figure 1(c). To conveniently observe the metallographic structure, the central 2mm area of the specimen is polished and corroded with 4% nitric acid hydrochloride. To avoid problems associated with tracking in the nanoindentation area, the other parts of the specimen are blackened.
Experimental procedure
The experimental procedure carried out in this study is divided into three parts, as shown in Figure 2: data acquisition for the generation of the nanoindentation curve and the calculation of the mechanical properties of the metallographic structure represent the first step; reconstructing the computational RVE models is the second step; and the finite element analysis of the computational RVE models is the third step.
Step 1. In this study, we first collect the nanoindentation load–displacement curves of 5 × 6 matrix points; the distance between the points is 10 µm, as shown in Figure 3(a). Due to the limitation of the microscopic magnification, the images of the residual indentation area are not particularly clear, as shown in Figure 3(a). Therefore, the nanoindentation points are marked in the figure. As shown in Figure 3(a), the area is composed of ferrite, pearlite and grain boundary.

Flowchart of the experimental process.

Distribution of nanoindentation points and P–h curves: (a) distribution of nanoindentation points and (b) load–depth curves.
To avoid the size effect, the nanoindentation displacement cannot exceed the thickness of a metallographic structure.13,14 To avoid the influence of roughness effect, the depth of the compression cannot be too small.15,16 Therefore, 20 mN is selected as the nanoindentation force, under which the metallographic structure performance should be fully reflected. The nanoindentation displacement is no greater than 600 nm.
The mechanical properties of different metallographic structures can be calculated by combining the corresponding nanoindentation curves as shown in Figure 3(b) and in situ images of the nanoindentation points. The nanoindentation curves of ferrite, pearlite and grain boundary in AISI 1045 steel are different.2,17–19 The loading curve of nanoindentation determines the plasticity, hardening index and strength of the material. The unloading curve determines the elastic behaviour and elastic modulus of the material. The formula for the stress–strain relationship for plastic power-law hardening models commonly used to study metal materials is as follows 4
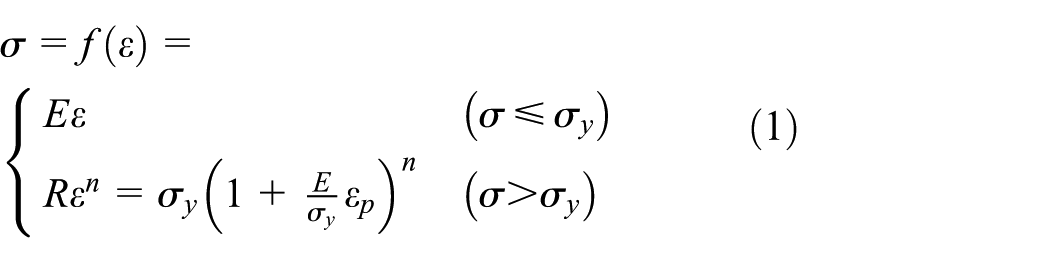
In the formula, σ is the macroscopic stress of the material; ε is the macroscopic strain of the material; E is the elastic modulus of the material; R is the strength coefficient of the material; n is the strain hardening index; σy and εy are the yield stress and the yield strain of the material, respectively; and εp is the effective strain, which is larger than εy in the total strain, that is, the plastic strain. Therefore, the stress–strain function can be solved by solving for the parameters E,σy and n.
According to the dimensional function based on 76 types of metal materials established by Dao, 4 reverse analysis of nanoindentation, 21 and determination of residual indentation depth, 22 the metallographic structure mechanical properties are computed as shown in Figure 4. H is the hardness of the material; hmax is the maximum pressure depth; hc is the contact depth between the indenter and the material; Pmax represents the maximum indentation load; α is the shape correlation coefficient of the indenter, 22 α = 0.75; β is the shape correlation coefficient of the indenter, β = 1.05; Ac represents the residual area after unloading; Er represents the reduced modulus; S =dP/dh|h = hmax represents the elastic recovery slope after unloading, which can be obtained by the nanoindentation P–h curves; 23 Ei represents the elastic modulus of the Vickers carbide head, Ei = 710 GPa; E represents the elastic modulus of the specimen; v represents Poisson’s ratio of the measured material, v = 0.25; vi represents Poisson’s ratio of the Vickers carbide head, vi = 0.21; and σr and εr are the characteristic stress and characteristic strain of the material, respectively, εr = 0.033. 4
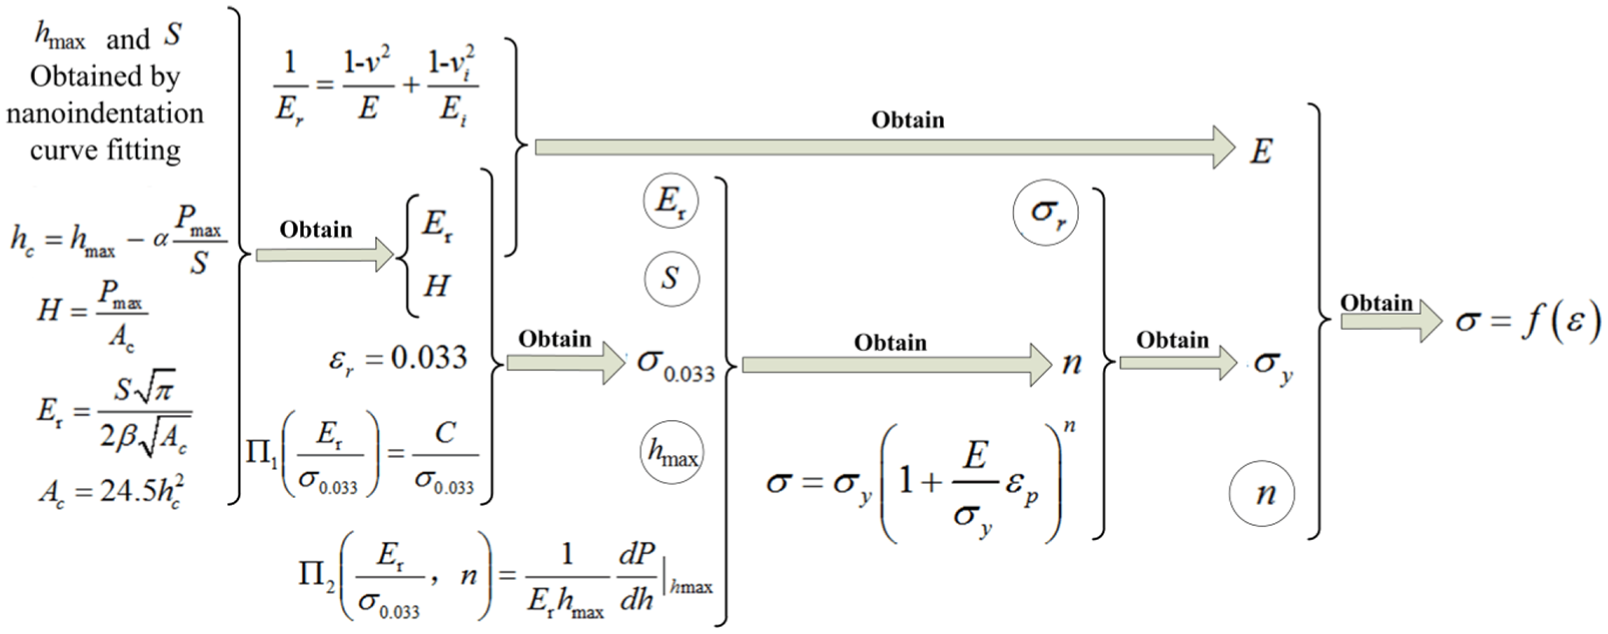
Computational process of metallographic structure mechanical properties.
The formulas Π1 and Π2 mentioned in Figure 4 are as follows


The stress–strain function and mechanical parameters at the nanoindentation positions can be calculated according to formulas (1)–(3) and the flowchart in Figure 4. Combining the abovementioned formulas with the distribution of nanoindentation points and P–h curves in Figure 3, the mechanical parameters at each nanoindentation point can be calculated as shown in Table 1.
Mechanical parameters calculated.
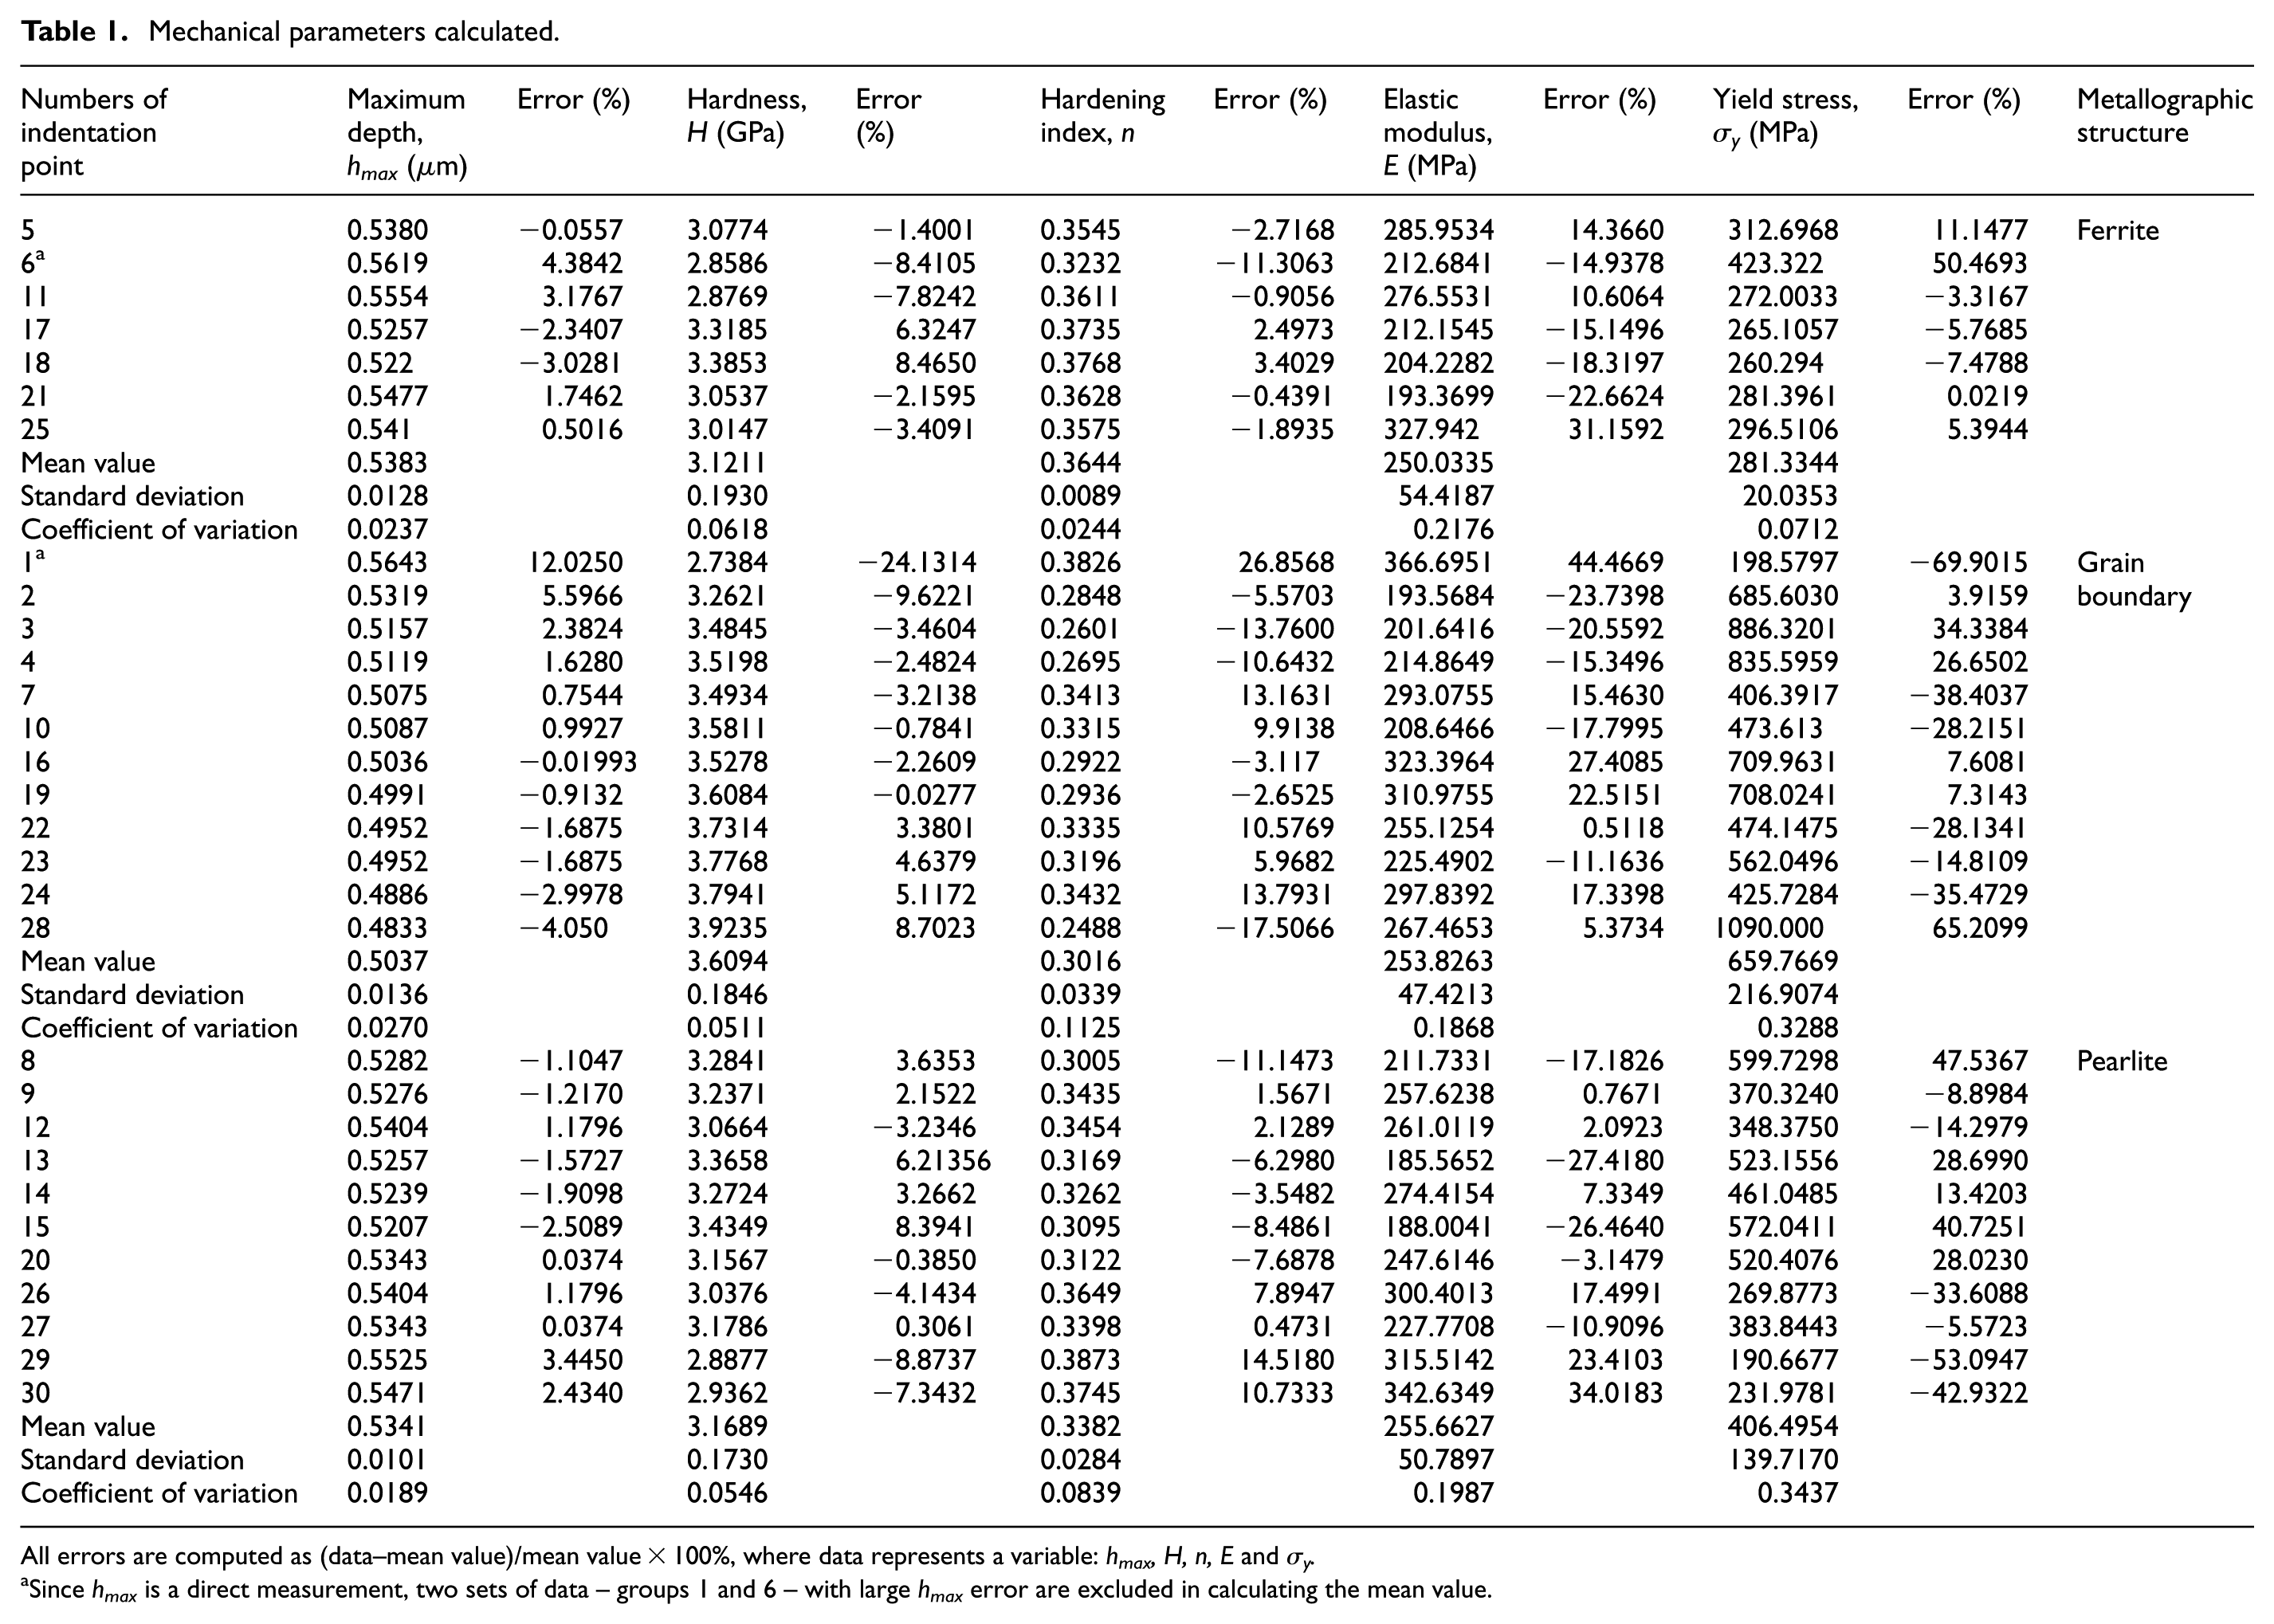
All errors are computed as (data–mean value)/mean value × 100%, where data represents a variable: hmax, H, n, E and σy.
Since hmax is a direct measurement, two sets of data – groups 1 and 6 – with large hmax error are excluded in calculating the mean value.
Table 1 shows that the hardness of different metallographic structures vary greatly, while the elastic modulus of different metallographic structures vary slightly. The hardness of pearlite is higher than that of ferrite, and the hardness of the grain boundary is higher than that of pearlite. The specific reasons are as follow: the hardness of ferrite mainly depends on its alloy element content and crystal defects. 24 Pearlite is mainly composed of lamellar cementite and ferrite. The hardness of pearlite depends on the proportion of ferrite and cementite and on the extent of lamellar spacing. The elastic modulus is an inherent property of a material; therefore, the elastic modulus of materials with the same chemical composition and undergoing the same process are essentially the same. 25
hmax is the data collected directly. Because the errors of hmax in group 1 and group 6 are larger, the two sets of data are excluded. According to the statistical Q-Q chart of Parameter Distribution (Figure 5) and Shapiro–Wilk (SW) test chart of normal distribution (Table 2), the obtained data of ferrite, pearlite and grain boundary conform to normal distribution. Therefore, the data can effectively characterize the properties of the corresponding metallographic structure.

Statistical Q-Q chart of parameter distribution.
SW test chart of normal distribution.

SW: Shapiro–Wilk.
At the same time, the experimental results show that the mechanical parameters of the same metallographic structure are different. This finding demonstrates that under the same material conditions, if the grain shape varies, due to the different paths of force transfer, the material can still have different macroscopic mechanical properties. Therefore, the macroscopic properties are related not only to the properties of the microstructure but also to the size and orientation of the microphase. Previous studies have shown that the cross-sectional shape and hardness of grains are different, even when cross-sectional areas of grains are equal and the depths of nanoindentation are the same. 26
The mechanical parameters of grain boundary are partially similar to those of ferrite and pearlite because grain boundary are composed of adjacent metallographic structures. In this article, the average values of the mechanical parameters obtained at the indentation points on grain boundary are selected as the mechanical properties of grain boundary. The average values of the mechanical parameters of ferrite, pearlite and grain boundary listed in Table 3 are used as the material properties for simulation analysis. The average value of the last row in the table is the average value of the mechanical parameters corresponding to the three metallographic structures.
Step 2. The macroscopic mechanical properties of materials are determined by the materials’ microstructure, and the constitutive relations of the metallographic structures and grain boundary are different. Thus, previous scholars have calculated the macroscopic mechanical properties of materials by calculating the volume fraction of the metallographic composition. In Table 1, the grain boundary of the same metallographic structure has little difference from the mechanical properties of the metallographic structure. So, this method does not consider the effect of grain boundary distribution on the mechanical properties of materials. Therefore, it is necessary to transform the metallographic images into a file format that the simulation software can recognize (reconstructed RVE models) and calculate the tensile mechanical properties of the RVE models. When the RVE size reaches 24 µm, the required accuracy of the model can be achieved.27,28 In this article, square metallographic sections measuring 60, 100 and 200 μm are selected.
Mean values of mechanical properties of metallographic structures.

RVE reconstruction requires image binarization to ensure that metallographic images are in black and white. To improve the smoothness of the edges between ferrite and pearlite, the edge eclosion of the metallographic structures is needed. The eclosion areas are regarded as the grain boundary region of the metallographic structure. The binarization images are extracted and saved as DXF format files so that they can be opened in Creo software. The accuracy of the DXF files extracted after eclosion is not able to meet the requirements of the ABAQUS software. The DXF file must be remodelled in the Creo software. The images of the metallographic structure before and after the reconfiguration are shown in Figure 6. According to the nanoindentation data in Table 1, the grain boundary mechanical properties of the same metallographic structure have little change. So, the RVE models of the reconstruction ignore the grain boundary of the same metallographic structure.
Step 3. In this study, the ABAQUS software is used for the tensile simulation of the RVE models.

Metallographic structure and reconstructed RVE models: (a) 60 µm × 100 µm; (b) 100 µm × 100 µm; and (c) 200 µm × 200 µm.
Results and discussion
The simulation stress cloud in Figure 7 shows that the nanoindentation hardness of the grain boundary is higher than that of the grain interior. The significant difference in the mesomechanical properties between the grain boundary and grain interior is the main reason that the macro-mechanical properties of the samples are affected by grain size. 29
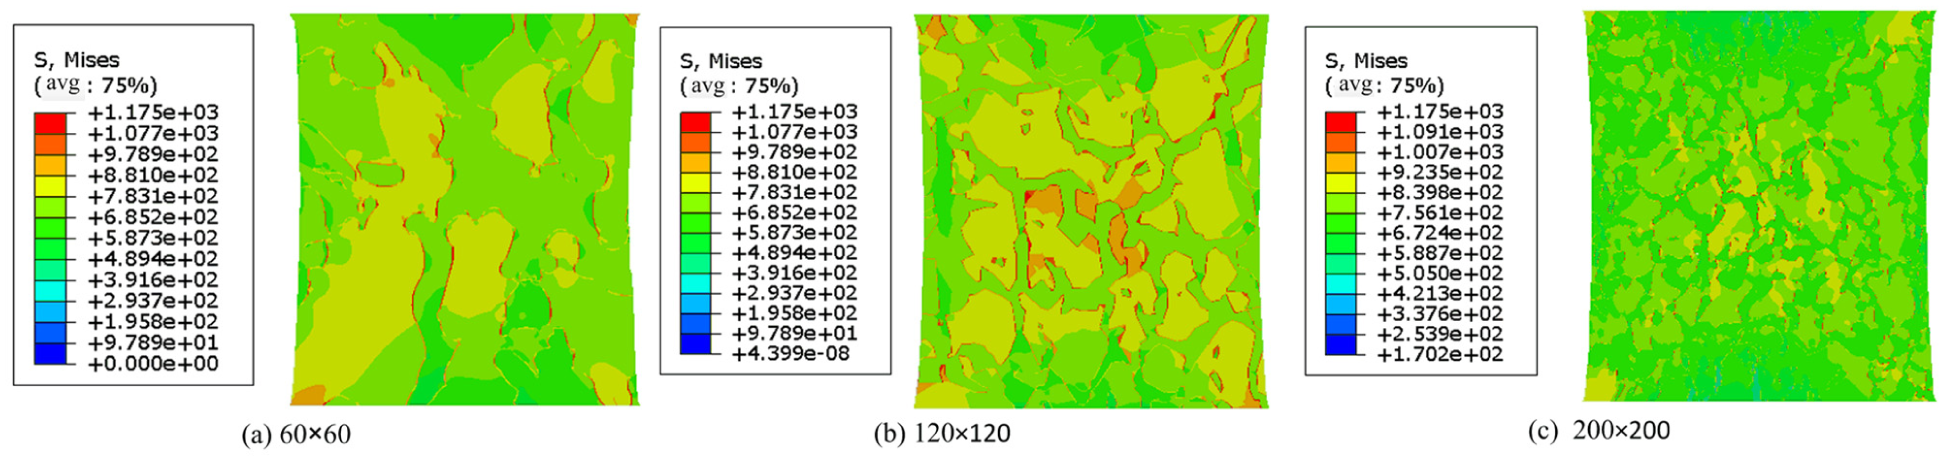
Von Mises stress cloud.
When the RVE model is loaded with displacement, the ferrite structure, which exhibits a lower yield strength, enters the plastic stage first, and the toughness of pearlite prevents the rapid plastic deformation of ferrite. The distribution of grain boundary increases the bearing capacity of ferrite grains. Deformation mainly occurs in ferrite. Therefore, the macro-mechanical properties of materials are related not only to the mechanical properties of their microstructures but also to the grain orientation of microphases and the distribution of grain boundary.
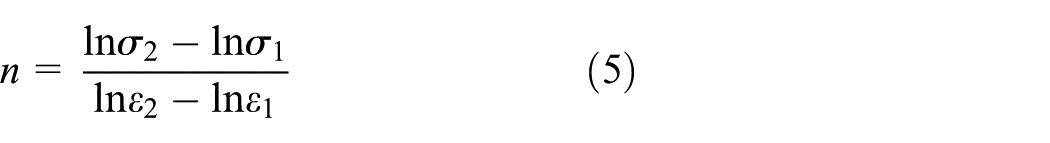
The logarithm of the plastic part in formula (1) is as follows14,30

Therefore, the hardening index, n can be calculated by formula (5)
Due to the extension of the material length direction and the shrinkage of the material in the width direction according to the principle of volume invariance during tension, the stress in the middle area of the stress nephogram of the simulation results is clearly larger than that in the surrounding area.
In the same displacement region, it is clear that the stress at the grain boundary is larger, which affects the macroscopic strength of the material. This finding confirms the strengthening effect of fine grains. For metal materials, there is the same trend in hardness and strength. That is to say, in the process of tensile test, when the same displacement is stretched, the more stress the harder structure bears. The simulated true stress–strain curve is shown in Figure 8. Because the specimens are homogeneous metallographic materials, the results of the three RVE models are essentially the same. The mean values of the mechanical parameters are E = 253.244 GPa, n = 0.3507, and σRp0.2 = 406 MPa.

True stress–strain curves of FEA.
The in situ image of the plastic stage in Figure 8 shows that the grain orientations on the two sides of the grain boundary are different, and the slip direction and the slip surface are not consistent with each other. It is just the small cracks in different directions that reduce the plasticity of materials. Macroscopically, the strength and hardness of the material are decreased.
The elastic modulus E = 235 GPa, hardening index n = 0.327, and yield strength σy = 385 MPa are calculated from the tensile data. The ferrite composition shows good slip deformation ability and deformation compatibility under a tensile load. Therefore, the deformation of ferrite plays a leading role in the macro-deformation of the materials. Moreover, the hardening index n of the material is close to that of ferrite. The strain hardening index n is the embodiment of the properties of the materials in the plastic stage, which is mainly affected by the order in which each metallographic structure enters the plastic stage. Because dislocations that destroy ferrite do not easily cross grain boundary, grain boundary increases the strength of the whole material. The results of the tension experiment are consistent with those of the simulation. The reason why value of n calculated by FEA is a little larger than that of the experiment is caused by the yield curve of the material, whereas the hardening index decreases due to the defect of the specimen and the dislocation motion between the slip surfaces during the test as shown in Figure 9.

In situ images and true stress–strain curves of the tensile test.
Due to the different heat treatment methods, the mechanical properties of different batches of materials are different. Therefore, the in situ tensile data of the nanoindented specimens are used as a reference. The result of tensile test is n = 0.3270, E = 235.9211 GPa, and σy = 385.3821 MPa. The differences between simulation results and tensile test data of each group are shown in Table 4.
Differences of mechanical properties calculated results.

RVE: representative volume element.
The reasons for the significant difference between simulation results and experimental results are as follows: one is the non-uniqueness of indentation test identification results31–33 and the other is the effect of small cracks on material surface during tensile test. The results of elastic modulus are the same as those of the traditional nanoindentation method, because the elastic modulus of the material is determined by the chemical composition of the materials and has nothing to do with the metallographic structure. The deviation between the elastic modulus and the tensile test results is within the allowable deviation of the elastic modulus. However, the average data of yield stress or strain hardening index of nanoindentation point cannot be used as macroscopic mechanical properties. 34 The yield stress is determined by the structure of the material, 35 and the maximum RVE model is the closest to the tensile test results. Because of the small cracks appearing in the tensile process, the material’s resistance to plastic deformation decreases and the strain hardening index decreases, so the strain hardening index differs greatly from the conclusion of the tensile test.
Conclusion
In this study, in situ nanoindentation and mesomechanical analysis are used to establish the relationship between macro-mechanical properties and mesomechanical properties. The study provides a new testing and simulation analysis method based on micromechanics for the tensile properties of materials in service.
The mesomechanical properties of grain boundary have a great influence on the hardness and strength of specimens, but have little influence on the elastic modulus. In situ tensile images can prove the strengthening effect of grain boundary on the plastic deformation of materials and confirm that it is necessary to establish the grain boundary mechanical function as an input condition for simulation.
In this article, an experimental study of materials with a homogeneous structure is conducted. For highly heterogeneous materials, the mechanical properties can also be analysed by this method as long as artificial RVE generation approaches.36–39
Macroscopic properties are related not only to the properties of the microstructure but also to the size and orientation of the microphase.
Footnotes
Handling Editor: Rubén Lostado Lorza
Declaration of conflicting interests
The author(s) declared no potential conflicts of interest with respect to the research, authorship and/or publication of this article.
Funding
The author(s) disclosed receipt of the following financial support for the research, authorship, and/or publication of this article: This work was supported by Special Projects for the National Natural Science Funds for Excellent Young Scholar (grant no. 51422503), the National Natural Science Foundation of China (grant no. 51275198), Fund Guiding on Strategic Adjustment of Jilin Provincial Economic Structure Project (grant no. 2014Z045), Major Project of Jilin Province Science and Technology Development Plan (20150203014GX), Jilin Provincial Industrial Innovation Special Fund Project (2016C030), and Jilin Provincial Middle and Young Scientific and Technological Innovation Talent and Team Project (20170519001JH).