
Abstract
Heat loss is one of the main causes of energy losses in modern direct injection diesel engines. This heat loss of the engine occurs during combustion, mainly due to the heat transfer between the impinging spray flame and the piston cavity wall. It is of more critical in small size engines. In order to decrease heat transfer, we need to examine the phenomenon of heat transfer through the combustion chamber walls more fully. To achieve this, we investigated the effects of flame impingement on transient heat flux to the wall. By using a constant volume vessel with a fixed impingement wall, the surface heat flux of the wall at the locations of spray flame impingement was measured with three thin film thermocouple heat flux sensors. The combined effect of impingement distance and injection pressure on the heat transfer was investigated parametrically. The results showed that an increase of injection pressure with longer impinging distance led to an increase in the heat transfer coefficient, which had a dominant effect on local heat flux compared with local temperature distribution. Moreover, we confirmed that the relation between Nusselt number and Reynolds number is a useful measure for describing the heat transfer phenomena in diesel combustion.
Keywords
Introduction
Despite increasing efficiency and improved fuel economy, heat loss still remains as a major factor, which contributes to substantial amount of energy loss in small size direct injection diesel engines. Therefore, heat loss reduction, which affects engine efficiency, has been of a challenging task. This heat loss occurs in various ways such as cooling loss, exhaust loss, and friction loss. Of these, cooling heat loss through the combustion chamber wall is the most significant one. Thus, a full understanding of the heat loss mechanism from combustion gas to cylinder wall would be needed to maximize thermal efficiency in the design of future engines.
One of the factors influencing heat loss from combustion gas to the chamber wall is high injection pressure. Under such conditions, the heat flux reached a peak, which was attributed to an increase in local spray velocity. 1 Another study showed that high injection pressure contributed to increases in flame velocity, flame temperature, and flame contact area due to increased fuel injection rate. 2 According to Dahlström et al., 3 the higher the injection pressure, the shorter the combustion duration, and thus the heat release increases. This factor contributes to higher in-cylinder temperature, which in turn increased wall heat transfer.
Wall impinging spray combustion is a further factor that has a significant effect on heat transfer characteristics.4,5 The heat flux decreased at some spray impingement distance to the wall. 6 Decreasing flame velocity caused by the momentum loss due to turbulent mixing accounts for this effect. Similarly, it was shown that the local heat flux value reached a peak at a certain spray impingement distance to the wall. 7
As described by the previous studies mentioned above, momentum loss by friction has the effect on flame velocity decrease, which closely relates to convective heat flux. For this reason, it is important to examine the combined effect on the heat flux factors which influences spray momentum.
Injection conditions and wall impinging spray have been investigated to analyze heat loss using constant volume vessel (CVV) in previous studies.2,6 However, these studies have not analyzed the proportion of the heat transferred through the wall, which was transferred by the convection of non-combustion evaporating spray. Therefore, this study aims to investigate the characteristics of heat transfer before and during combustion under the combined effect of impingement distance and injection pressure conditions. In addition, this research also attempts to investigate the heat transfer coefficient and heat transfer correlation (relation between Nusselt number and Reynolds number) to understand the effect of flow induced by the spray flame. In this article, the wall temperature was controlled to investigate the wall heat transfer mechanism from spray flame impingement to the wall surface in CVV under diesel engine-like conditions.
Experimental apparatus and method
High-pressure and high-temperature chamber vessel
The experiment was carried out same as of previously conducted by Mahmud et al.8,9 using high-pressure and high-temperature chamber vessel, which can be seen in Figure 1. It had four side windows. Two of them were installed with transparent quartz windows for visualization. The others were provided for an injector and a spray impingement flat wall plate facing each other. Three K-type thermocouples were fitted near the wall and the remaining one K-type thermocouple was fitted at a distance of 5 mm under the nozzle tip, which was placed between nozzle tip and wall. Diesel fuel was injected into the chamber when the ambient temperature was achieved at the target temperature measured by thermocouple placed in the middle of nozzle tip and wall. It should be noted that the temperature difference of thermocouples became within 5 K. Injection pulse values had been defined by the injection rate measurement beforehand.
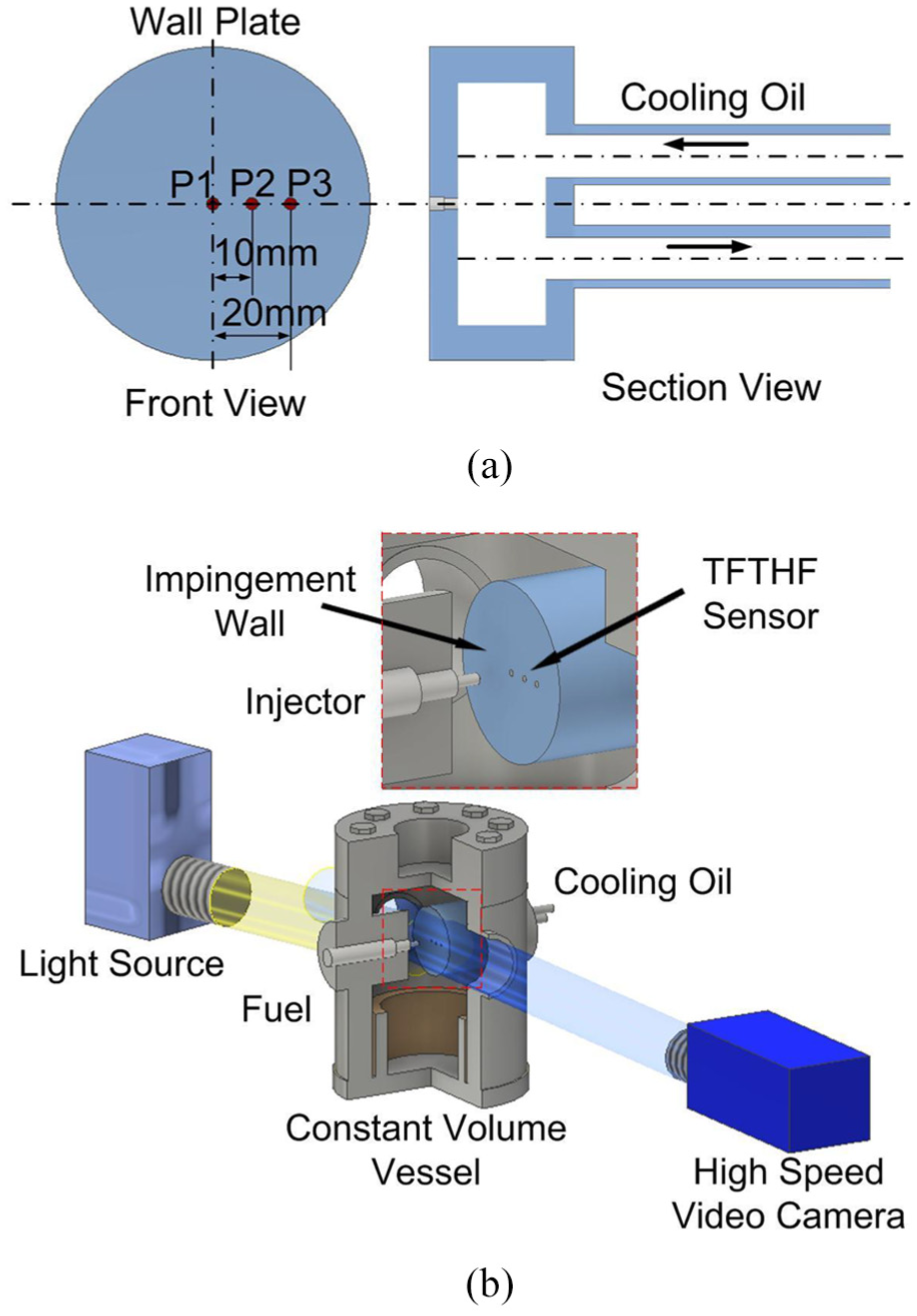
(a) Thin film thermocouple heat flux sensor arrangement and (b) optical set-up of high-speed video camera observation for spray/flame.
High-speed video camera observation
Figure 1(b) shows optical set-up of high-speed video camera observation and its arrangement. A high-speed color video camera was utilized to record the spray and flame behavior with frame rate of 20,000 frame per second (fps) at 320 × 448 pixels image resolution, which each represents 5 pixels per mm. To investigate the spray behavior (non-evaporating and evaporating conditions), the Mie scattering method was used in this study. The two-color method10,11 was applied to the luminous flame in order that the relation between diesel flame and wall heat loss could be found. We used two-color method to observe soot and local temperature distribution. Principle of two-color method utilizes radiation intensity from incandescent soot particles through the combustion process. Then, the radiation of two different wavelengths is detected and the flame temperature and soot formation are found, provided a number of assumptions are made. The soot concentration is represented and estimated by KL factor, which is derived from the Hottel and Broughton’s model.
Hottel-Broughton equation for estimating soot particles


If there are two specific wavelengths λ1 and λ2 that are measured simultaneously, the value KL which is proportional to the integrated soot concentration can be eliminated

Provided that the black body temperatures Ta1 and Ta2 at two specific wavelengths λ1 and λ2, which can be obtained according to the calibration data, are known, the actual temperature and the KL value can be calculated. A standard light illuminant was used for the calibration of the two-color method. Data analysis was performed by nac Image Technology’s “Thermias” as two-color pyrometry software. As a result, the flame temperature and KL factor were two-dimensional with line-of-sight information.
Heat flux measurement
To obtain the instantaneous local heat flux on the wall surface, three Alumel/Chromel Thin Film Thermocouple Heat Flux Sensors (TFTHFSs) (Medtherm 10702B) were applied as shown in Figure 1(a). The locations of three TFTHFSs are designated as follows: Position 1 (center of wall impingement), Position 2 (10 mm from center), and Position 3 (20 mm from center). Steady component of the heat flux, however, was neglected. The equation employed for instantaneous local heat flux, total heat loss, and affected areas can be found in our previous report. 8
Furthermore, so as to predict heat transfer coefficient (α) by CFD (computational fluid dynamics) precisely, we need accurate α experimentally. Steady state heat transfer coefficient is expressed in equation (4), but this relation is also applicable for the transient heat transfer

where Twall is instantaneous local temperature and qwall is transient local heat flux, both of them are obtained from TFTHFS measurement. Tg is gas temperature. To find an accurate α, we need to determine the gas temperature. However, gas temperature during combustion varies both spatially and temporally and it is difficult to determine adequate value. Whereas, gas temperature at non-combustion is almost constant throughout the injection. According to our CFD calculation, however, vaporized spray temperature near the wall surface was around 60 K lower than the ambient temperature at evaporation condition. It decreased to 804, 808, and 810 K for injection pressures of 80, 120, and 180 MPa, respectively. Therefore, we used predicted spray temperature as a mainstream temperature for heat transfer calculation. The CFD solver CONVERGE software was used in this study. Turbulence model employed was renormalization group (RNG) k-ε turbulence model, with wall film and wall heat transfer models by O’Rourke and Amsden. Modeling, initial, and boundary conditions were conducted same as an experimental study. Then, to validate the results, comparison with experiment was made. After validating, we were able to use the data for calculation.
We explained in the previous report 8 that the local heat flux increase came from convection by turbulent spray arrival in both combustion and non-combustion cases. Convection is dominant for the wall heat transfer by impinging spray flame. In non-combustion case, we used temperature near the wall obtained by simulation at non-combustion condition as the gas temperature for the calculation. By this approximation, we were able to find relatively precise value of α. In combustion condition, there exists large temperature gradient distributed in flame according to previous report. 8 Then, we used mean flame temperature that was obtained from two-color method analysis as gas temperature.
For the relation between Nusselt number (Nu) and Reynolds number (Re), Kuboyama et al. 12 applied turbulent heat transfer equation of the pipe internal flow, which is assumed to be applicable for heat transfer in diesel engine, where the Nu is a function of Re and Pr (Prandtl number)

where Nu, Re, and Pr are defined as the following equations (6)–(8). m and n are defined based on the laminar or turbulent heat transfer. L is characteristic length, λ is thermal conductivity, ρ is density, U is characteristic velocity at each position, μ is viscosity, and Cp is specific heat. We used a distance between the nozzle tip and the wall as the characteristic length


We cleaned the wall surface at every experiment condition change, since built-up deposits on the wall from combustion process affect the measurement accuracy according to Woschni and Huber. 13
Test conditions
Table 1 shows the detail conditions of this experiment. We performed the test at three principal conditions to identify the relation between spray flame and heat flux, and to understand effects of injection factors. The test conditions were selected as “non-evaporating spray” consisting of N2 gas at room temperature, “non-combusting spray” consisting of N2 gas at high temperature, and “combusting spray” consisting of air at high temperature. To maintain the gas density uniform throughout all conditions, that is, 16 kg/m3, ambient pressures was held at 1.4 MPa for non-evaporating spray and 4.1 MPa for others.
Experimental conditions.

Measurement conditions were determined based on actual operation of small-size diesel engines. In order to self-ignite the fuel, pressure and temperature were set at those of compression top dead center in low load operation for the combustion test. The impinging distance between the nozzle tip to the wall were set at 30, 40, and 50 mm. The all impingement distance tests were conducted using a nozzle of 0.133 mm hole diameter at three injection pressures, that is, 80, 120, and 180 MPa.
Results and discussion
Injection rate
Fuel injection patterns influence the combustion, hence emission formation. 14 Zeuch method yielded more accurate results for measuring injected volume than Bosch. 15 Accordingly, injected fuel quantity was calibrated by Zeuch method injection rate meter. Injection rate measurement results are averaged 10 times using a single-hole injector under 80, 120, and 180 MPa as shown in Figure 2. In order to maintain the same fuel quantity, injection durations were changed by the pressures.

Injection rates.
Non-combustion spray behavior and wall heat transfer at different injection pressures
In this section, behaviors of the impinging spray and its heat transfer at non-evaporation and non-combustion with different injection pressures are discussed. Effects of the three injection pressures, that is, 80, 120, and 180 MPa, were studied under impingement distance of 40 mm.
Spray behaviors
Figure 3 presents non-evaporation wall impinging spray images under different injection pressures at room temperature. Sprays travel from the top to the bottom of each image and impinge on the wall. The photos revealed that higher injection pressure made the spray faster, thus leading to shorter impingement timing and enhancing spray development. Then, there became larger spray spreading to the circumferential area of the flat wall.
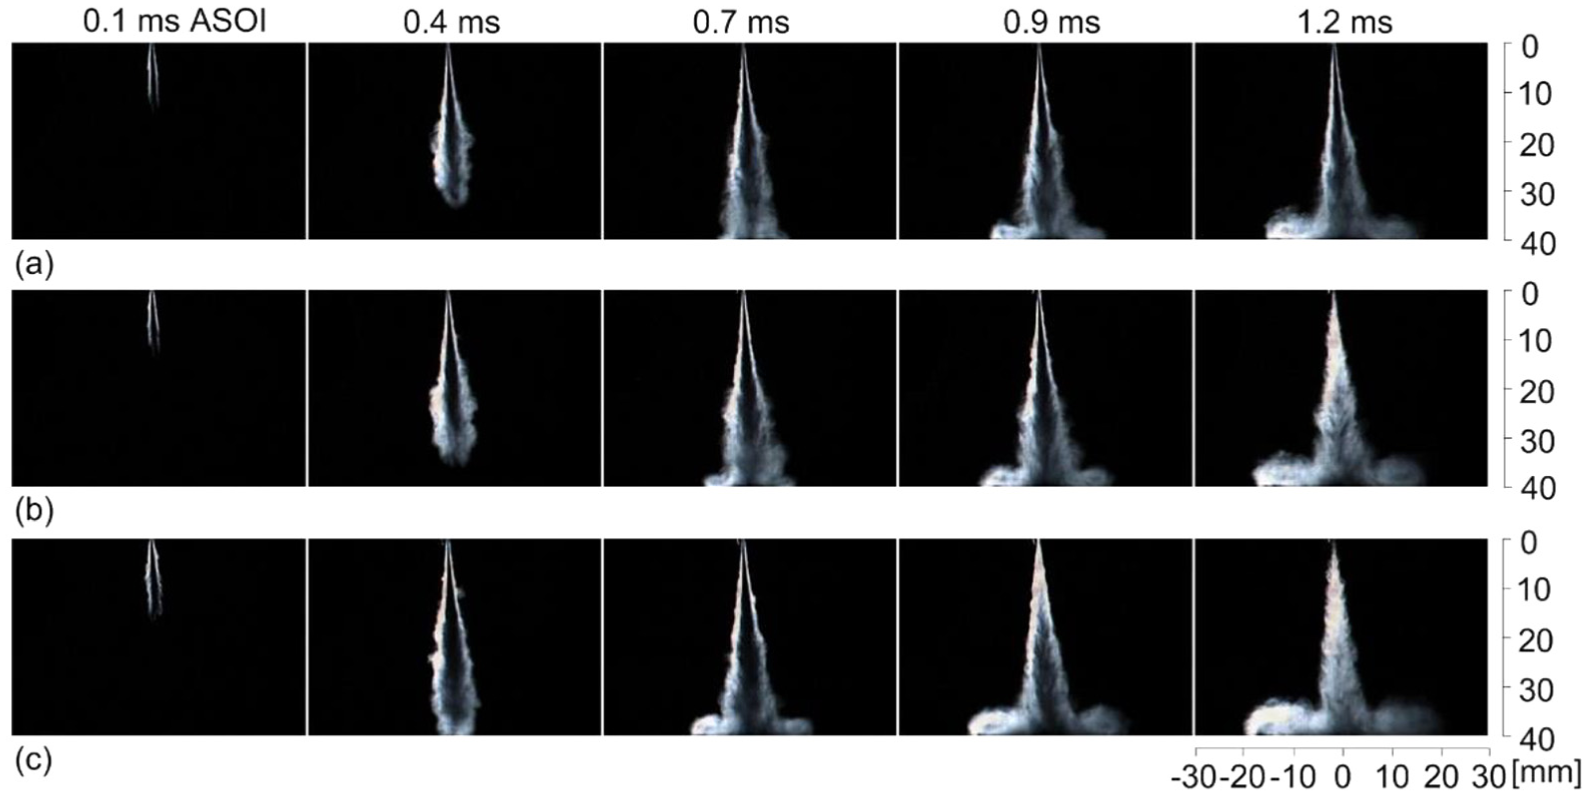
Non-evaporating wall impinging spray at different injection pressure, impingement distance Dimp = 40 mm: (a) Pinj = 80 MPa, (b) Pinj = 120 MPa, and (c) Pinj = 180 MPa.
Non-combustion evaporating spray images under the three injection pressures at high temperature (873 K) can be seen in Figure 4. The white intensity demonstrates liquid spray concentration. The spray approximately evaporated before impinging to the wall. In case of injection pressure of 80 MPa, liquid fuel existed until later compared with those of other pressures. As shown in the injection rate graph (Figure 2), lower injection pressure requires longer injection duration. The figure shows that 120 and 180 MPa images show smaller dense liquid (white) areas compared with 80 MPa. This means that an increase in velocity with higher injection pressure leads to more effective atomization. As it apparent from Figure 4(c) at 0.7 ms after start of injection (ASOI), some fuel droplets spread on the wall, which accounts for why some fuel droplets impinge earlier on the wall.
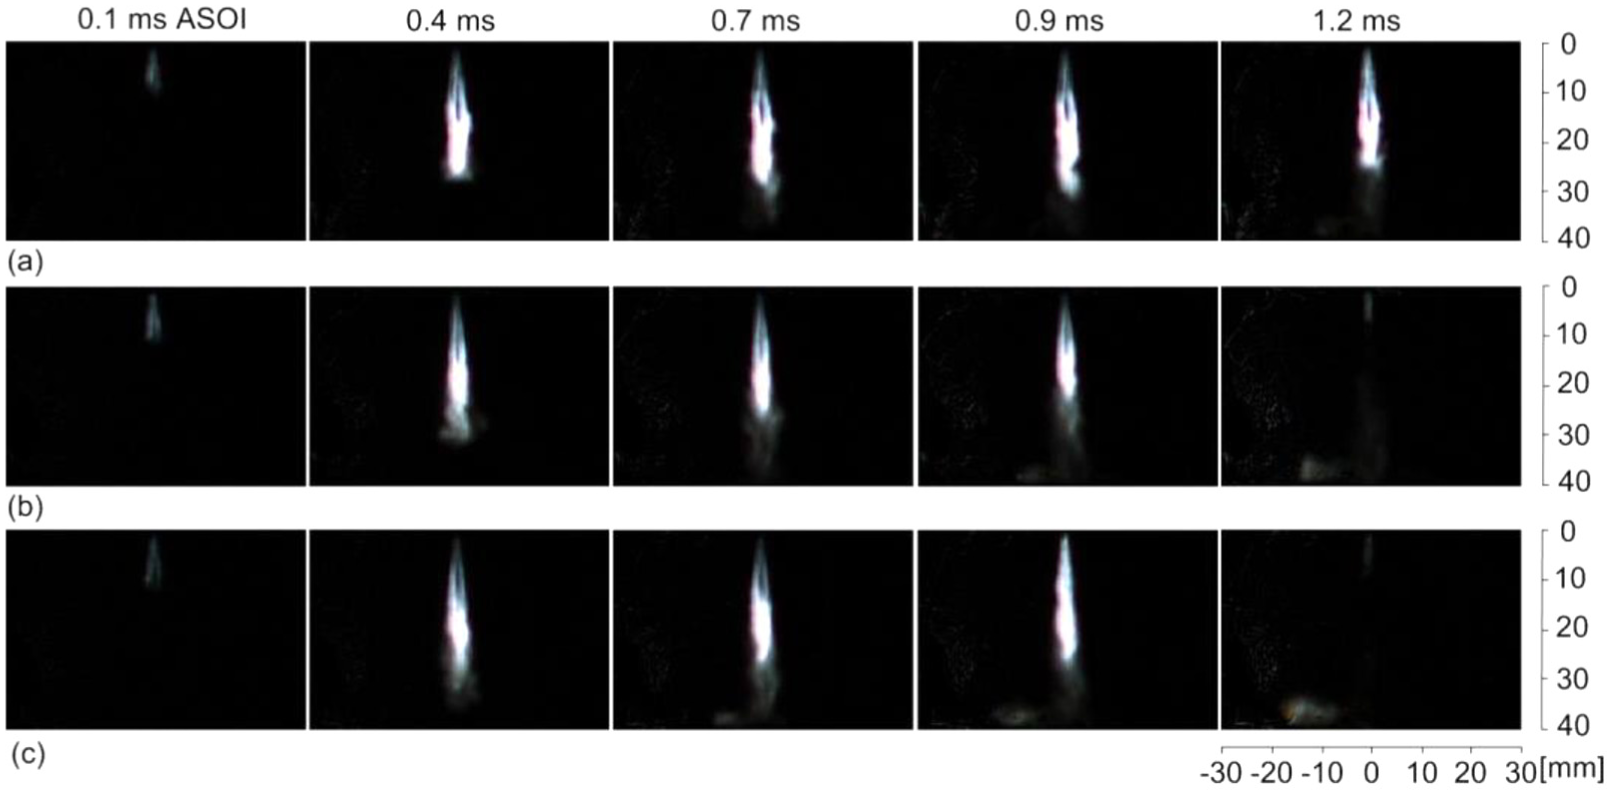
Evaporating wall impinging spray (liquid component) at different injection pressures, impingement distance Dimp = 40 mm: (a) Pinj = 80 MPa, (b) Pinj = 120 MPa, and (c) Pinj = 180 MPa.
Figure 5 shows spray tip penetration in vertical axis on the left-side graph and liquid length plot in vertical axis on the right-side graph. Filled and open markers represent before and after the spray impingement on the wall, respectively. The penetration pattern of each injection pressure is different in respect of before or after impingement on the wall with different injection duration. In Figure 5, we can see that the higher injection pressure made further spray tip penetration. If the injection pressure rises, the spray droplet velocity increases. As a consequence, it makes fuel momentum increase, which results in earlier impingement timing and larger spray tip penetration.
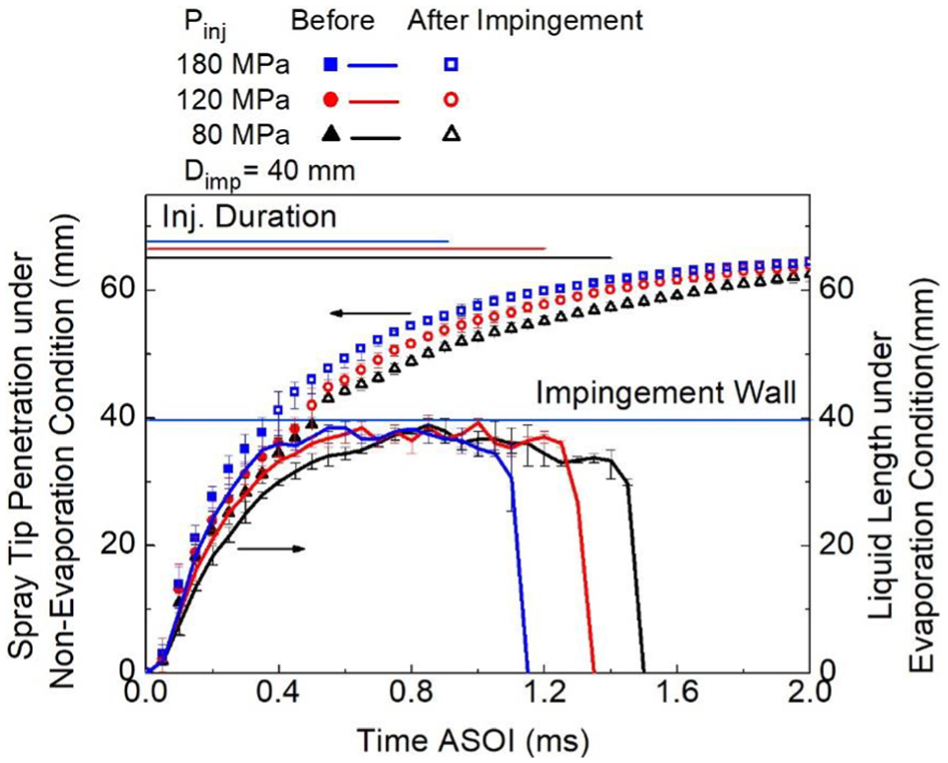
Spray tip penetration and liquid length of evaporation at different injection pressures, impingement distance Dimp = 40 mm.
Liquid phase fuel, that is, the liquid penetration length, was obtained from the non-combustion evaporation images. The lengths were obtained same way as it was in non-evaporating spray using image processing. A threshold intensity of 10% was employed for the image on a scale of 0 to 255. The liquid length linearly increased with time for a few hundred-microsecond ASOI. Higher injection pressure leads to a faster penetration velocity; however, they reached similar distance at a maximum. The maximum liquid penetration lengths were around 35–40 mm. Liquid length with slight fluctuation remained constant even though fuel continued to be injected. During this quasi-steady period, liquid penetration length was nearly constant at all injection pressure even though their injection rate profiles were different. This implies accelerated evaporation occurred at the spray tip. This phenomenon suggests that the higher injection pressure leads to enhanced evaporation rate for wider area. The average mixture temperature decreased by evaporation. As a result, heat fluxes at non-combustion increased much lower than combustion case. After the quasi-steady period ended, the liquid length immediately dropped just after the end of injection (EOI).
Heat flux on the wall surface
To examine the effects of the injection pressure, heat fluxes in non-combustion condition were measured. Temporal variation of the local heat fluxes and the total heat fluxes can be seen in Figure 6. Figure 6(a)–(c) shows local heat fluxes at the positions at 80, 120, and 180 MPa. As explained in the previous report, 8 the unsteady wall heat transfer occurred due to the spray impingement on the wall. This is true for these results. By increasing injection pressure, starts of local heat flux increase became earlier, which were associated with the increased spray velocity. That is to say, the higher pressure leads to the earlier turbulent convection. Figure 6(d) shows the total heat fluxes were calculated by multiplying their affecting areas to them as mentioned in the previous report. 8 Higher injection pressure made total local heat flux increase earlier with a maximum value of 2.11 kW as shown in Figure 6(d). It increased the total heat flux due to higher velocities as a consequence of an increased fuel injection rate. These higher velocities led to combustion gas flow toward wider wall area. This was evident by local heat flux at Position 3, which starts to increase earlier as shown in Figure 6(c). As mentioned in the previous report, the area was influential factor for the temporal variations of averaged total heat flux.

Temporal variation of local heat flux and total heat flux at non-combustion, impingement distance Dimp = 40 mm: (a) Pinj = 80 MPa, (b) Pinj = 120 MPa, (c) Pinj = 180 MPa, and (d) total heat flux.
Combustion flame behavior and wall heat transfer at different injection pressures
In this section, behaviors of the impinging flame and how combustion affects the wall heat transfer under the different injection pressures were studied. Effects of the three injection pressures, that is, 80, 120, and 180 MPa, were studied under impingement distance of 40 mm.
Combustion flame behavior
Information of temperature distribution of impinging spray flame is important for the heat transfer analysis. Figure 7 presents the distributions of flame temperature at various injection pressures using two-color method analysis, which was realized with natural luminosity of flame. The color distribution scale varying from dark to bright indicates temperature. By comparing the temperature distributions with different injection pressures, it presented that the injection pressure of 80 MPa had the highest temperature. Accordingly, increasing flame temperatures can be explained as follows. At lower injection pressure of 80 MPa, more flame natural luminosity was observed, which was related to temperature and soot volume fractions. In this condition, soot is dramatically higher, which is contributed by less air entrainment with decrease in spray atomization and fuel air-mixing and therefore bringing it to local high equivalent ratio. The correlation of high temperature with local high equivalent ratio is commonly discussed as being accounted for soot production. In contrast, natural flame intensity for an injection pressure of 180 MPa was reduced. High injection pressure leads more air entrainment with improving spray atomization and premixing between fuel and air due to high velocity that reduces soot formation.

Flame temperature distribution at different injection pressures, impingement distance Dimp = 40 mm: (a) Pinj = 80 MPa, (b) Pinj = 120 MPa, and (c) Pinj = 180 MPa.
Comparing with non-evaporating spray images in Figure 3, flame temperature occurs a few hundred microseconds after the spray impingement. It is evident from Figure 7 that flame temperature appeared earlier with higher injection pressure. This result suggests that higher injection pressure has better mixing due to more rapid mixture formation. In all conditions, combustion occurred just after the spray impingement on the wall and it began before the end of the fuel injection. Furthermore, comparing the photographs of non-combustion in Figure 4 and combustion flame temperature in Figure 7, it can be seen that the flame temperature part by combustion existed in the vapor area. The combustion occurred in the vapor area near the center of wall impingement. The area provided suitable equivalence ratio and temperature for ignition. 16
Figure 8(a) and (b) shows temporal change of integrated luminosity and mean temperature each. From (a), we could find the higher the injection pressure was, the smaller and shorter the luminosity became, because the flame natural luminosity comes primarily from soot incandescence and chemiluminescence. At the diesel engine, soot incandescence is dominated by the thermal radiation from soot particles in flame with a broadband emission spectrum. The most well-known one is that higher injection pressure leads to lower soot formation because higher velocities cause a longer lift-off length. These phenomena indicate that impact of increasing injection pressure is to promote greater premixing between fuel and air during ignition delay, which is more air entrainment with improving spray atomization. Moreover, longer lift-off length due to higher velocity leads to reduction in soot formation. Mean temperatures at injection pressures of 120 and 180 MPa were lower than that of 80 MPa as shown in (b). It can be concluded that the high injection pressure with shorter injection duration leads to premixed combustion, which results in reduced luminosity.

Integrated flame luminosity and mean temperature at different injection pressures, impingement distance Dimp = 40 mm: (a) integrated flame luminosity and (b) mean temperature.
Heat flux on the wall surface
Unsteady temporal variation of local heat flux values of flame impingement on the wall and integrated flame luminosity under each injection pressure is shown in Figure 9(a)–(c). Spray impinging and ignition timing have been also plotted on the graph. Luminosities increased from near the ignition timings at all injection pressures. Time histories of local heat fluxes were different at three measurement locations (Positions 1, 2, and 3). These differences can be attributed to spatial non-uniformity of spray and flame flow. Spray flows radially after impingement and arrives at each position at different timings. This causes heat flux fluctuation. Local heat flux at Position 1 started to increase earlier, followed by Position 2 and 3 in all conditions. The observed increase in local heat flux at Position 1 could be interpreted as being a result of effect of convection when a turbulent of evaporating spray impinges to the wall. Then, the large effect of combustion gas velocity was responsible for start of the local heat flux peak at Position 2. Besides, local heat flux at Position 3 was significantly lower than others since both wall friction and momentum loss due to turbulent mixing took place.

Temporal variation of local heat flux, integrated flame luminosity, and total heat flux at combustion, impingement distance Dimp = 40 mm: (a) Pinj = 80 MPa, (b) Pinj = 120 MPa, (c) Pinj = 180 MPa, and (d) total heat flux.
The effect of injection pressure in relation to local heat flux could be found from the graphs as follows: at lower injection pressure of 80 MPa, the local heat fluxes of Position 1 increased simultaneously with the ignition. One possible explanation is that the convection by turbulence from spray impinging takes time to reach the wall as can be seen in Figure 5. On the contrary, by increasing injection pressure, a higher peak value of local heat flux was detected at all positions because increased flame velocity is caused by an increased injection rate. These increasing flame velocities were toward wider wall area, which is responsible for increased local heat flux at Position 3.
Figure 9(d) presents the total heat flux under different injection pressures. As shown in the graph, all of the waves had two peaks, that is, there were two stages for the local heat transfer. Initially, the local heat flux was increased by turbulence of impingement spray. Then, heat transfer by flow along the wall, which started after impingement, took place.
A comparison of the transferred heat at each area under different injection pressures between combustion and non-combustion is shown in Figure 10. This figure shows transferred heat in vertical axis on the left-side graph and ratio of heat loss to total combustion heat in vertical axis on the right-side graph. Left and right inside the graph indicate non-combustion and combustion condition. The higher the injection pressure was the larger the heat loss on the wall in combustion condition. However, in non-combustion condition, it can be seen that it has a small amount of the effect. The flame velocity, which relates to heat transfer coefficient that will be explained in the next figure, increased with the injection pressure and led to hot gas flow spreading to the circumferential area of the flat wall. Comparing non-combustion and combustion, around 30% of the transferred heat through the wall was transferred by the convection of non-combustion evaporating spray. Of total combustion heat loss, the ratio to the wall was shown in the graph 10. It comprises approximately 12%–14% of total combustion energy.

Comparison of the areal transferred heat and ratio of heat loss to total combustion heat between non-combustion and combustion at different injection pressures, impingement distance Dimp = 40 mm.
α is one of the decisive factors that influence the heat transfer loss through wall. Temporal local heat transfer coefficients, which were calculated by equation (4) with the measured heat flux at non-combustion and combustion conditions at different injection pressures, are shown in Figure 11. For gas temperature at non-combustion, we used temperature near the wall, which was obtained by the simulation. The gas temperature at combustion used in the convective α equation was obtained from two-color method analysis. The graph shows that the peak values differ at both conditions because of not only turbulent convection by gas flow but also radiation that varies locally and temporally. Furthermore, in this condition, the combustion flame is mostly developed around the location somewhat distant from the impingement center. Consequently, the location of Position 2 had a higher value than that of others in all injection pressures. However, the graphs showed that both combustion and non-combustion conditions have similar waveforms and order of heat transfer coefficient at all the positions and injection pressures. This indicates that, in combustion, flow induced by the injected spray is dominant for the heat transfer to the wall. Both graphs show that the local heat transfer coefficient increased proportionally in all positions with injection pressures. It means higher injection pressure, which increases momentum and velocity of the fuel spray, is one of the significant influential factors on the α. In other words, higher injection pressure leads to larger local heat flux value as shown in Figures 6 and 9. Similarly, the dominant factor of heat loss variation under injection pressure could be the α differences caused by the spray flame flow changes. 17 If the heat transfer coefficient at the non-combustion condition fully contributed to the total heat transfer in Figure 10, spray motion contributed 30%–40% for the total transferred heat under the combustion condition.

Comparison of local heat transfer coefficient between non-combustion and combustion at different injection pressures, impingement distance Dimp = 40 mm: (a) non-combustion and (b) combustion.
Combined effect of impingement distance and injection pressure on heat transfer
In this section, we will discuss the heat loss through the wall determined by combined conditions of impingement distance and injection pressure. Figure 12 presents the combined effect of impingement distance/injection pressure (Dimp/Pinj) on the transferred heat and ratio to the total combustion heat. Three injection pressures, that is, 80, 120, and 180 MPa were studied under each impingement distance of 30, 40, and 50 mm. The combined effect can be explained as follows:
The transferred heat significantly increased at injection pressure of 180 MPa and increased dramatically especially when combined with longer impingement distance.
On the contrary, there were small differences in them except 180 MPa by the distances.
The ratio of heat loss through the wall accounted for about 10%–17% of total combustion energy.

Comparison of the areal transferred heat at combined impingement distance/injection pressure.
The heat loss phenomenon under the combined effect of Dimp/Pinj conditions may be related to the liquid spray impingement on the wall. Figure 13 presents the evaporating wall impinging spray at combined Dimp/Pinj under the same injected fuel quantity, which was taken just before the EOI each. Figure 13(a) shows liquid fuel adhered in all the pressure conditions due to small impingement distance. In general, liquid film on a wall surface tended to decrease with increased injection pressure, 18 because the impinged spray spreads to wider area and the distribution of the spray is more uniform as the injection pressure rises. However, these photographs look similar in all injection pressures due to the same amount of injected fuel. This means that the transferred heat decrease at the distance of 30 mm under injection pressures in Figure 12 was influenced by liquid fuel adhered on the wall. Moreover, Figure 13(a)–(c) at 180 MPa injection pressure shows the short impingement distance could not avoid liquid impingement on the wall. Consequently, the lower wall temperature due to liquid impingement influences combustion temperature in the near wall region, which led to the decelerating wall heat transfer.

Evaporating wall impinging spray (liquid component) at combined impingement distance/injection pressure under same injected fuel quantity: (a) Pinj = 80 MPa, (b) Pinj = 120 MPa, and (c) Pinj = 180 MPa.
As to the combined effect, the transferred heat was increased by combination of the longer distance with the higher pressure; we studied the following combinations, that is, 30/80, 30/180, and 50/180 (mm/MPa) each. These conditions can represent the effect of both injection pressures and impingement distances. Figure 14(a)–(c) shows temporal changes of non-steady local heat flux and integrated luminosity with the combination of Dimp/Pinj conditions. The combination showed far lower integrated flame luminosity at higher injection pressure than that of lower injection pressure. This means more complete combustion with sufficient oxygen was achieved. Comparison of injection pressure in the combined effect is presented in Figure 14(a) and (b). In the previous section, the effect of injection pressure was explained in detail. However, since the distance of 30 mm under injection pressures could not avoid liquid impingement on the wall, it is interesting to clarify the phenomenon in local heat flux history. By comparing the combination of 30/80 and 30/180 as shown in the Figure 14(a) and (b), local heat flux peak value was achieved by combination of 30/80. On the contrary, due to increasing injection pressure related to increasing velocity, local heat flux waveform at all positions had almost similar peak value at combination of 30/180. Consequently, the flame gas flow of outer area became faster and led to the higher total heat flux comparing with the combination of 30/80 as shown in Figure 14(d). Regarding comparison in Figure 14(a) and (b), increasing injection pressure did not affect more on local heat flux at impingement distance of 30 mm. It was plausible that cooling effect from liquid fuel adhered on the wall could have influenced the slow heat transfer rate. Besides, liquid fuel adhered on the wall caused the local heat flux waveform at Position 1 had valley after increasing.

Temporal variation of local heat flux, integrated flame luminosity, and total heat flux at combined impingement distance/injection pressure: (a) Dimp/Pinj = 30/80, (b) Dimp/Pinj = 30/180, (c) Dimp/Pinj = 50/180, and (d) total heat flux.
Comparison of impingement distance in the combined effect is presented in Figure 14(b) and (c). Combination of 50/180 showed that the heat fluxes rose more steeply and higher. Moreover, start points of the steep rise at Position 1 and 2 became simultaneous with the combination. This was probably the convection by turbulence from spray impinging, which took time to reach the wall due to longer impingement distance. As a result, it reached to the wall simultaneously with the ignition which had a major impact on the local heat flux values. However, combination of 30/180 had a lower local heat flux due to a large liquid spray impingement to the wall. It could be explained with Figure 15 that liquid component of the spray reached to the wall only at impingement distance of 30 mm. This liquid impingement influenced the combustion temperature in the near wall region and then led the slow rate of wall heat transfer. For reducing heat loss through the wall, liquid spray impingement was effective.

Liquid lengths of evaporating spray at combined impingement distance/injection pressure.
Figure 14(d) shows total local heat flux at combination effect. The result showed that a maximum total heat flux value of 16.2, 11.6 and 7.2 kW for combined effect of 50/180, 30/180, and 30/80. According to the combined effect, it can be concluded that the high injection pressure is more influential to total heat flux at longer impingement distance.
Heat transfer correlations at different impingement distance and injection pressures
According to the above explanations, the spray flame flow has considerable effect on heat loss through the wall. Then, we studied relation between Re number and Nu number. As shown in equation (7), Re number requires characteristic flow velocity. However, it was not possible to estimate the velocity by commonly used measurements, so we utilized waveforms of the heat flux. The waveforms had clear peaks, which seemed to have resulted from combustion flame motion. If the peaks were similar in different positions, by comparing peak by peak, we could obtain flamelet velocities along the wall as shown in Figure 16.
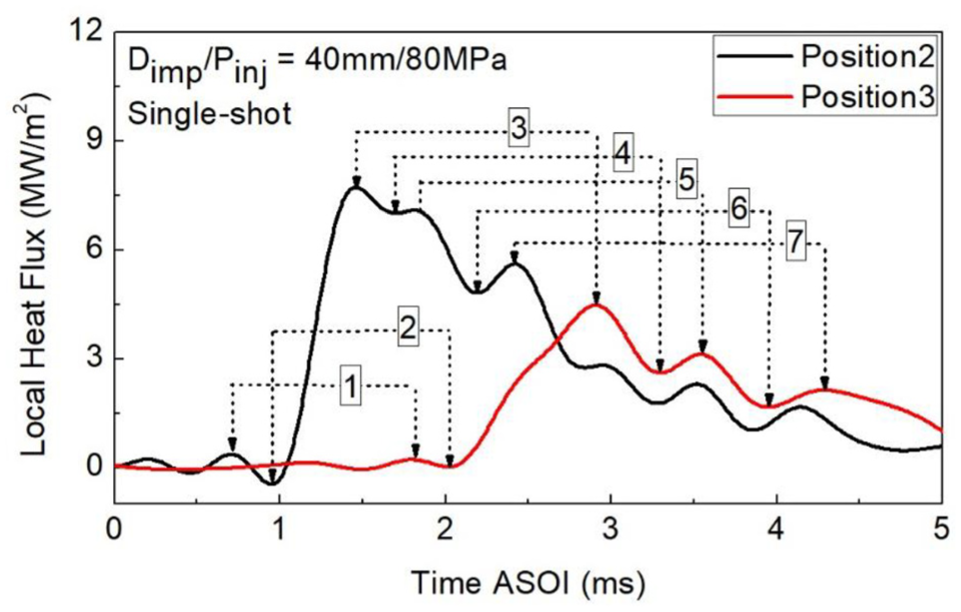
Relation of heat flux wave forms between the two points.
Figure 17 shows characteristic velocities at the different injection pressures by the method. Injection pressures of 80 and 120 MPa showed similar velocity, while 180 MPa had higher velocity compared with others. This result seemed reasonable, as is reported by some researches,1,2,19 at which the local flame velocity increased with high injection pressure. Then, we used these values for calculating Re number.

Flamelet velocity at different injection pressure, impingement distance Dimp = 40 mm.
Figure 18 shows relation between Re number and Nu number in all positions at different injection pressures. For Re number calculation, impingement distance is selected as a representative length, that is, 40 mm, whereas those shown in Figure 16 were used for characteristic velocity. For Nu number calculation, thermodynamic properties of air were taken into account. It can be seen from the figure the relation between Nu number and Re number approximates one line, regardless of the impingement distance and injection pressure conditions. It was found that Nu number was directly proportional to Re number of 0.8 power for the combined case.

Relation between Reynolds number and Nusselt number at combined impingement distance/injection pressure.
Conclusion
The effects of injection pressure and the combined effects of impingement distance/injection pressure on the combustion wall heat transfer under diesel engine-like conditions were investigated. The main points of this work are summarized as follows.
Convection by spray motion contributes to the total transferred heat through the impingement wall as does the higher injection pressure. The portion which was attributed to spray motion reached around 30% at injection pressure of 180 MPa.
Local heat transfer coefficients were calculated by using measured heat flux and temperature in both combustion and non-combustion conditions. The results showed that both combustion and non-combustion conditions had similar waveforms of heat transfer coefficient at all the positions. This largely determines that induced flow by the spray is dominant for the heat transfer to the wall in combustion case.
A new method for determining characteristic velocity to calculate Re number has been proposed. By using the value, it was found that the Nu number was proportional to the Re number of 0.8 power.
Footnotes
Appendix 1
The characteristic velocity for the Reynolds number is obtained from the single-shot heat flux waveform. Flamelet velocity is determined according to local combustion flame motion near the wall, which has direct impact on local heat flux waveform characteristic. It was assumed that the waveform had clear peaks as a consequence of combustion flame motion. The calculation method of flamelet velocity is as follows: first, the distance between Position 2 and Position 3 was 10 mm, denoted as characteristics length. Position 2 and Position 3 were chosen with consideration that positions had a more stable velocity compared to that of Position 1, at which it was in a state of stagnation. Next, time value can be detected from measuring the change in waveform between Position 2 and Position 3, as depicted by numbers 1 to 7 inside square as shown in Figure 16. According to the time difference between Position 2 and Position 3 (e.g. number 1), we obtained time value to calculate characteristic velocity.
Handling Editor: Joaquin De La Morena
Declaration of conflicting interests
The author(s) declared no potential conflicts of interest with respect to the research, authorship, and/or publication of this article.
Funding
The author(s) disclosed receipt of the following financial support for the research, authorship, and/or publication of this article: In order to conduct this research, financial support was granted by Mazda Motor Corporation.