
Abstract
In order to propose an optimised construction plan and prevent and control the possible occurrence of cracks in concrete structures during construction, a detailed simulation of construction stages is required. The temperature and thermal stresses during the construction of a double-hole, double-deck concrete tunnel structure were analysed in this study, in which the analysis of the early-aged behaviour of a structure was performed considering actual construction conditions, and the cracking conditions were predicted. It was found that the temperature trends obtained from the simulated results were in good agreement with actual data, which indicates the reliability of the simulation results. In addition, the distribution of thermal stresses in the structure indicated that the tunnel structure was at risk of cracking at a number of stress concentration areas under the construction conditions. A parameter analysis of different factors, including the initial concrete temperature (25°C, 30°C, and 35°C), formwork stripping time (48 h, 72 h, and 96 h), and the construction season ambient temperature (summer and winter), was conducted. The formwork stripping time did not have a significant influence. It is recommended that the initial concrete temperature should be controlled to below 30°C during construction.
Keywords
Introduction
Mass concrete is of importance in a variety of modern civil engineering projects, specifically in water conservancy and hydropower construction. 1 A mass concrete structure has large cross-sections and will generate a great amount of heat during concrete hydration, which could result in significant temperatures and changes in the volume of the internal concrete. As the temperature at the outer surface of concrete is close to the ambient temperature and it is smaller than the temperature inside the concrete, temperature differences between the internal and external surfaces could cause temperature gradients resulting in significant tensile stresses in the concrete that will produce cracks in the concrete structure.2,3 As crack formation leads to structural damage and affects durability, stability, and sustainability of the concrete structures, thermal stresses cannot be ignored in the construction stage.
The factors that affect the cracking of concrete are not only the internal hydration heat of concrete, but also the initial concrete temperature, material properties, the geometry, and the restraints of the structure, as well as external factors including ambient temperature, humidity, and external loads.4–8 For controlling the structural cracks, accurate measurement of the hydration heat and the choice of suitable concrete hydration heat models are critical. 9 An appropriate hydration heat model can accurately predict the energy of the hydration heat, which can help analyse the temperature in the structure. 10
Numerous researchers have analysed the thermal stresses generated in concrete. Noorzaei et al. 11 conducted a thermal stress analysis on the Kinta dam based on the Taylor–Galerkin method and predicted the spatial position of cracks. Li et al. 12 conducted temperature control and anti-crack measures for high altitude areas with large temperature difference and strong constraint using finite element method. Hu et al. 13 conducted real-time monitoring along with a numerical modelling system for a detailed investigation on the temperature changes and thermal energy changes of two engineering projects. Xu et al. 14 reported the internal confinement of mass concrete and indicated that mass concrete generated cracks not only because of the thermal stresses during the initial stages of pouring but also from differences in thermal properties between various components, such as expansion coefficients and heat transfer performance. Qiu Y and Zhang G 15 reported that the multi-stage cooling and early cooling mode can better improve the crack resistance of concrete.
A number of researchers have conducted thermal stress analyses of concrete structures through finite element packages. Zhang et al. analysed the thermal stress of an intake tower using Ansys for the finite element analysis. The most unfavourable position was found to be the junction of the old and new concrete of the water tower, which is also the place with the greatest temperature gradient. 16 Zhang et al. analysed the thermal stresses of a tunnel during construction using Ansys software. It was reported that the temperature difference between the inside and outside of a tunnel attained a maximum after 3 days of pouring, which should result in high thermal stresses and proneness to generate cracks in concrete. 17
In order to study the influence of the external environment on structures, Krkoška and Moravčík analysed the thermal stresses in a box foundation of a bridge. It was suggested that the structure generated thermal stresses in the vertical direction, which would result in cracks in the structure. 18 With the diversification of materials, the influence of temperature on structures should also be different. Kodur et al. conducted a thermal stress analysis for high-performance concrete using Abaqus software. It was proposed that the thermal stresses had a significant influence on the performance of this material; however, it could be decreased by adding thermal insulation blankets and steel mesh. 19 Schutter and Vuylsteke analysed the thermal stress of J-type wharf using the HEAT software. They proposed that it was possible to reduce the impact of pouring on the casting by changing a number of factors, such as the initial concrete temperature, the ambient temperature, and adding cooling pipes and the content of cement in the concrete to reduce the thermal stresses and generation of cracks. 20 Wang et al. 21 performed a thermal stress analysis of reinforced concrete piers using Femmasse MLS software and proposed reasonable construction suggestions. It was reported that the effect of formwork stripping time on the structure was not significant.
For computing the temperature evolution in concrete, a heat source model including the data of adiabatic temperature increases is required. There are a number of ways to test the adiabatic temperature increases. Evuskoff et al. 22 used data mining methods to determine the adiabatic temperature increase in concrete, and the experimental data and simulation results were in good agreement. Zou et al. 23 studied the hydration process of concrete using a Fabry–Perot optical fibre temperature sensor.
Although there have been studies regarding thermal stresses in various structures, it was found from a literature review that there have only been limited studies on a multi-story tunnel. In this study, a systematic study from a structural point of view is conducted for a two-storey tunnel construction, in which temperature and thermal stresses are analysed. The tunnel is located in the Qianhai area in Shenzhen. The adiabatic temperature increase data, which are determined using concrete samples from the construction site, was used as the heat source. The heat transfer coefficient of timber formwork was also measured. To validate the proposed modelling, an example of a pier foundation pillar in the literature was investigated, and a good agreement was obtained. The actual construction process of the tunnel is then simulated in detail. Temperature sensors were arranged on the construction site to monitor the temperature changes in the structure in real time and the data were compared with the numerical simulation results. Finally, a parameter analysis is performed for factors including the initial concrete temperature (25°C, 30°C, and 35°C), formwork stripping time (48 h, 72 h, and 96 h), and the construction season ambient temperature (summer and winter).
Basic formulation
Modelling the thermal stress problem typically involves two types of problems: heat transfer, and mechanical thermal stresses. In this study, the weakly coupled process is considered, which means that the temperature field affects the stress field, whereas the stress field does not affect the temperature field. Femmasse MLS 24 is used for the numerical simulation. 25
For considering the thermal effect, the heat conduction equation and the heat source model are involved. The heat conduction equation is as follows

where Ct is the heat capacity;
It is known that the mechanical behaviour of concrete is related to the concrete age. Based on the actual concrete mix ratio, the expression of maturity and its relationship with concrete strength can be predicted by the simplified weighted maturity method by Xing and Han.
26
The concrete compressive strength

where the concrete maturity can be expressed as a function of temperature T and time t as follows

where
It can be seen from equations (2) and (3) that the concrete strength evolution curve can be determined through the value of maturity. Afterwards, the tensile strength and Young’s modulus were determined from the magnitude of the compressive strength.
Fitting of the tensile strength

where a = 0.3 is a factor varying between 0.2 and 0.4.
Fitting of the Young’s modulus Ec from the compressive strength evolution following BYFORS, 24 as

In order to describe the creep behaviour of concrete materials, the Maxwell chain model was used. The total stress follows from the summation of all Maxwell units, and it reads
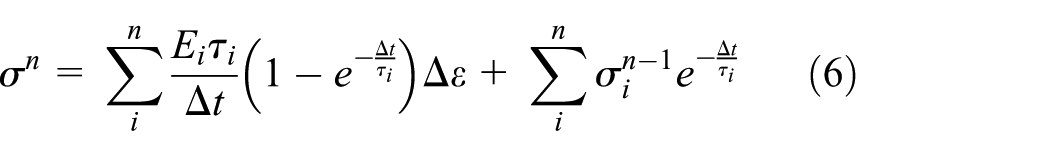
where
The coefficient of thermal expansion is 1.2e-5 (1/C), depending on the degree of hydration. Since the effect of concrete shrinkage usually plays an important role on cracking, this article considered the hygral and plastic shrinkage model. The incremental hygral shrinkage is defined as 24

where
The incremental plastic shrinkage is defined as 24

where
Case validation
This study used the basic model provided by the Femmasse software. 24 In order to verify the computational model, the temperature field of a pier foundation pillar with dimensions 5.5 × 2.2 m was considered. 27 The geometry of the model and point A were shown in Figure 1(a). The initial concrete temperature of the column was 20°C, and the surface of the column was exposed to air convection. The bottom of the column was adiabatic. For the mechanical boundary condition, the bottom plane used fixed constraints. The column concrete is C50, and the cement was PO 42.5. The density is 2437.6 kg/m3, the compressive strength after 28 days was 56 MPa. The 7-day hydration heat was 306 kJ/kg. The temperature change after 7 days at point A was compared with the simulation results. In this study, the core model was used for the heat source. The thermal diffusion effect was considered in the hydration heat value. The ambient temperature of Li and Shao was used in the modelling. 27 The temperature evolution at point A obtained by modelling in this study was compared with the experimental one, as shown in Figure 1(b). It can be seen that the trend of the temperature curve in the first 7 days was consistent, and only marginal differences were observed after the peak value. The reasons for this could be errors in the ambient temperature, or the reinforcement in the concrete absorbing a percentage of the heat, which led to a smaller measured value. From this example, it can be concluded that the computational model is reliable.

Model geometry and temperature evolution of point A: (a) model geometry (mm) and (b) temperature evolution.
Project overview and the experiments
Project overview
The construction site studied is in the first section of the Qianhai Municipal Engineering Project in Shenzhen City. It runs through the north–south trunk road in the Qianhai area. The structure is a double-hole, double-deck tunnel, which is located in the reclamation area. Figures 2 and 3 show the construction site and the section of the tunnel. The tunnel side wall and the middle plate are 1 m thick, while the roof and the bottom plate is 1.2 m and 1.4 m thick, respectively. Because of the volume, this structure can be defined as mass concrete. 1 The construction of this structural section is divided into five stages, in which the simulation is determined by the order of construction time. The material properties change continuously with time at different stages, while the latter stage inherits the outer boundary conditions, loads, and the history of temperature/heat of the previous stage. The first stage is the construction of the base plate that takes 7 days. The second stage is the casting and curing of the side wall and the middle wall of the first floor for 10 days after stage one. The third stage is the construction of the middle plate which takes 7 days. The fourth stage is the construction of the side and the middle wall of the second floor, which have the same geometry as the first floor. This stage takes 10 days. The fifth stage is the construction of the top plate, which is 1.2 m thick and is backfilled after curing for 14 days.

Construction site in Qianhai area.

Geometry of tunnel section (cm).
Thermal conductivity of timber formwork
Timber formworks were used in the construction of the tunnel structure. In order to accurately simulate the heat transfer of concrete hydration heat, the adiabatic temperature increase of concrete, which was tested experimentally, was used. The thermal conductivity metre used was a NETZSCH HFM436/1E (Germany), as shown in Figure 4. The measurement was conducted in accordance with ASTM C518.
28
The size of the timber formwork was
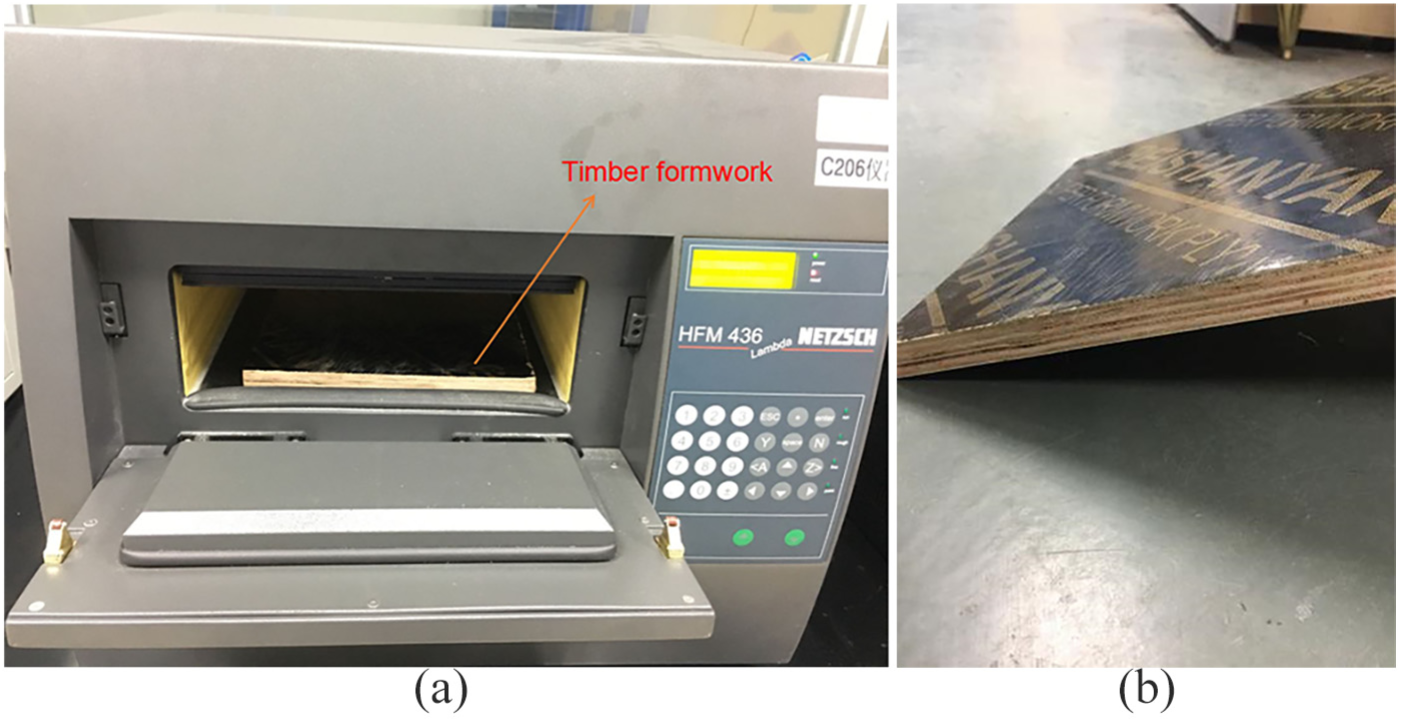
Measurement of heat transfer coefficient of timber formwork: (a) thermal conductivity metre and (b) timber formwork.
The procedure was as follows. First, the sample was placed between two boards with different temperatures in the thermal conductivity metre. Four temperature points, 10°C, 25°C, 30°C, and 40°C, were used in the test, while the temperature difference between the upper and lower boards was maintained at 20°C. When a thermal balance was attained, the sample should maintain a temperature gradient between the upper and lower surfaces. The thermal conductivity was then calculated.
The average temperature, the temperature increment between the upper and lower boards, thermal conductivity, thermal resistance, and the temperature gradient values for the four setpoints are presented in Table 1. The values of thermal conductivity and thermal resistance reflect the thermal conductivity of the timber formwork. The average thermal resistance value of the four temperature points was used to determine the thermal resistance R of the timber formwork, which was 0.14. The reciprocal value of the thermal resistance is 7.36 W/(m2·K), which is used in the simulation. Based on the average of four values recorded using the instrument, the thermal conductivity of timber formwork was taken as 0.12 W/(m·K).
Thermal conductivity of timber formwork.

Adiabatic temperature rise in concrete
Regarding the heat transfer problem, the heat source of concrete was determined from the adiabatic temperature rise, which was measured by a TY-ATRD (Shenzhen Concrete Construction Technology Co., Ltd.). The mix proportions of the concrete are presented in Table 2. The cement was PO 42.5 (Sinoma Cement Co., Ltd.). The sand and the stones were from West River and Zhongshan, respectively. Admixture 1 is fly ash from the Mawan Power Plant and admixture 2 is expansive agent UEA-W (Guangdong Yuesheng Special Building Materials Co., Ltd.). The polycarboxylate superplasticiser was WS-PC (Shenzhen Wushan Co., Ltd.).
Concrete mix proportions.

A sample of 30 L of fresh concrete was taken in an adiabatic barrel from the construction site, as shown in Figure 5(a). It was placed in the TY-ATRD within 30 min. A 10-cm-long heat-resistant copper tube, which was sealed at one end, was inserted in the centre of the barrel. Heat transfer oil was then added and a thermal sensor was placed in the tube. The experiment was conducted over a period of 7 days.

Concrete sample for construction and the adiabatic evolution of concrete temperature: (a) concrete sample and (b) adiabatic evolution of concrete temperature.
The adiabatic temperature increase curve for the concrete is shown in Figure 5(b), where it can be seen that the temperature increase trend was significant in the early stages. After 4 days, the increase in concrete temperature decreased gradually, which indicates that the hydration reaction was intense in the first 4 days, and the heat generated was significant. After the initial rapid temperature increase, the hydration process became weaker in the later stages, resulting in less heat generation, although there was still an upwards trend.
Computational model
Material properties
For the numerical simulation of the tunnel shown in Figure 3, the material properties were determined in advance. The basic parameters are as follows: heat capacity 2500 kJ/m3 K; thermal conductivity coefficient 2.4 W/(m·K); and thermal expansion coefficient 1.2×10⁻⁵ /°C. The heat source data were derived from the adiabatic temperature increase experiments in the previous section.
Geometry and boundary conditions
The geometry of the tunnel structure is shown in Figure 3. The total width and height are 30 m and 16.5 m, respectively. The overall framework comprises reinforced concrete structures. The simulation was divided into the five stages as well. The ambient temperature was provided by the Meteorological Bureau of Shenzhen, as shown in Figure 11(a).
The thermal conductivity of the timber formwork is 0.12 W/(m·K), and the thermal resistance is 0.14 m2·K/W. The top surface of the structure is free heat exchange, the perimeter and bottom surface are the internal surface, which was covered by the formwork boundaries, and the outer boundary is set to the ambient temperature. Under the bottom plate is clay, with a significantly greater thermal resistivity, in which adiabatic conditions were applied. For the mechanical boundary, the dead load of the concrete weight was considered. The fixed surface support was applied around the bottom of the base plate, and no live load or constraint are applied to the rest of the structure.
Analysis of construction stages
Because of the geometry and the boundary conditions of the tunnel, plane strain is considered in this numerical simulation. A total of 1444 quadrilateral elements and 1704 nodes are meshed for the finite element model. The concrete that properties vary with time was used in this study. The joint between new and old concrete was modelled using shared nodes and boundaries in different construction stages. The computation of new and old concrete is carried out using the constitutive equation for different time periods. From experience, cracks typically occur in the longitudinal direction of the side wall in the tunnel. Therefore, a point located at a vertical distance of 2 m in the middle of a side wall is the focus of the analysis and is referred to as point 1 (as shown in Figure 3). It can be known from Figure 11(b) that the double-hole, double-deck tunnel has a small stress value in the XY direction, whereas it is most likely to cause cracks in the structure in the Z-direction. In what follows, temperature, plane principal stress, and the stress component in the Z-direction (longitudinal direction) will be discussed.
Construction stages
Regarding the actual working conditions of the tunnel construction, a series of temperature sensors were set up both inside and on the surface of the concrete. The initial concrete temperature was 28.3°C. As previously mentioned, a total of five construction stages were performed. The ambient temperature of the five stages is shown in Figure 11(a). The computed temperature at point 1 is compared with the measured temperature. To ensure the concrete strength at early age, the formwork stripping time was 96 h after casting, and stage 2 began after 7 days.
Figure 6 shows the distribution of temperature and the stress component σZ of the base plate at 59 h when the maximum temperature was attained. At that point, the maximum temperature difference between the inside and outside was 34.49°C, which should form a significant temperature gradient. It can be seen in Figure 6(b) that there was a low stress level inside the base plate, and a greater stress value was seen at the outer surface of the base plate. The maximum tensile stress in the Z-direction is 7.015 MPa. This significant stress level could cause cracks at the point of stress concentration. As the stress was concentrated, there should only be a negligible effect on the overall structural safety. The stress values of the upper and lower surfaces of the plate are mostly in the brown area, the average stress value of this area is 4.540 MPa, and the average tensile strength of concrete is 3.200 MPa. The large tensile stress may lead to cracking in this area.

Distribution of temperature and stress component σZ of base plate at 59 h (Stage 1): (a) temperature distribution and (b) distribution of stress component σZ.
The second construction stage includes the side and middle walls of the first floor. The side wall is 6.7 m high and 1 m thick, and the middle wall is 6.7 m high and 0.9 m thick. The formwork stripping time is 96 h. From experience, cracks are likely to occur on the side walls. In order to allow the concrete to attain a greater strength to withstand the self-weight of the structure after demoulding, it is appropriate to start pouring the middle plate after 10 days.
Figure 7 shows the distribution of temperature and the stress component σZ of the structure at 223 h. As can be seen in Figure 7(a), the temperature in the base plate, as well as the outside of the wall, is small, whereas the temperature inside the side and middle wall is significant. The maximum temperature attained is 62°C and the maximum temperature difference between the inside and outside is 27.75°C. As can be seen in Figure 7(b), the magnitude of the stress gradually increases from the inside to the outside, though this difference is not large. Among them, the average value of

Distribution of temperature and stress component
In the third construction stage, the 1-m-thick middle plate was poured. As the load on the middle plate is significant, in order to ensure the concrete strength, the formwork stripping time was longer than that for the base plate and the side wall. After the concrete attained a certain strength at 14 days, the formwork was demoulded. As for the first two construction stages, the second side wall was cast 7 days after the end of the middle plate casting.
As can be seen in Figure 8(a), the peak temperature was at 458 h in the middle plate. The temperature change in the middle plate decreases gradually from inside to outside. The maximum temperature difference between the inside and outside of the structure is 25.62°C. It can be seen in Figure 8(b) that the stress distribution is relatively average, and the stress values are not excessive. The reason for this could be that the temperature gradient in the middle plate is smaller. The maximum tensile stress, which appears at the corner, is 6.803 MPa. However, a relatively large area in the middle and upper parts of the wall are red and brown, which indicates greater stresses where cracks could occur.

Distribution of temperature and stress component
The fourth construction stage is pouring the side and middle walls of the second floor, which began 7 days after the pouring of the third stage. The net height is 6.7 m, and the side and middle walls are 1 m and 0.9 m thick, respectively. The fifth construction stage is the roof with a thickness of 1.2 m. The fourth and the fifth stages are similar to the second and the third stages, respectively, with the only difference being that it is backfilled after 14 days. Figures 9 and 10 show the distribution of temperature and the stress component
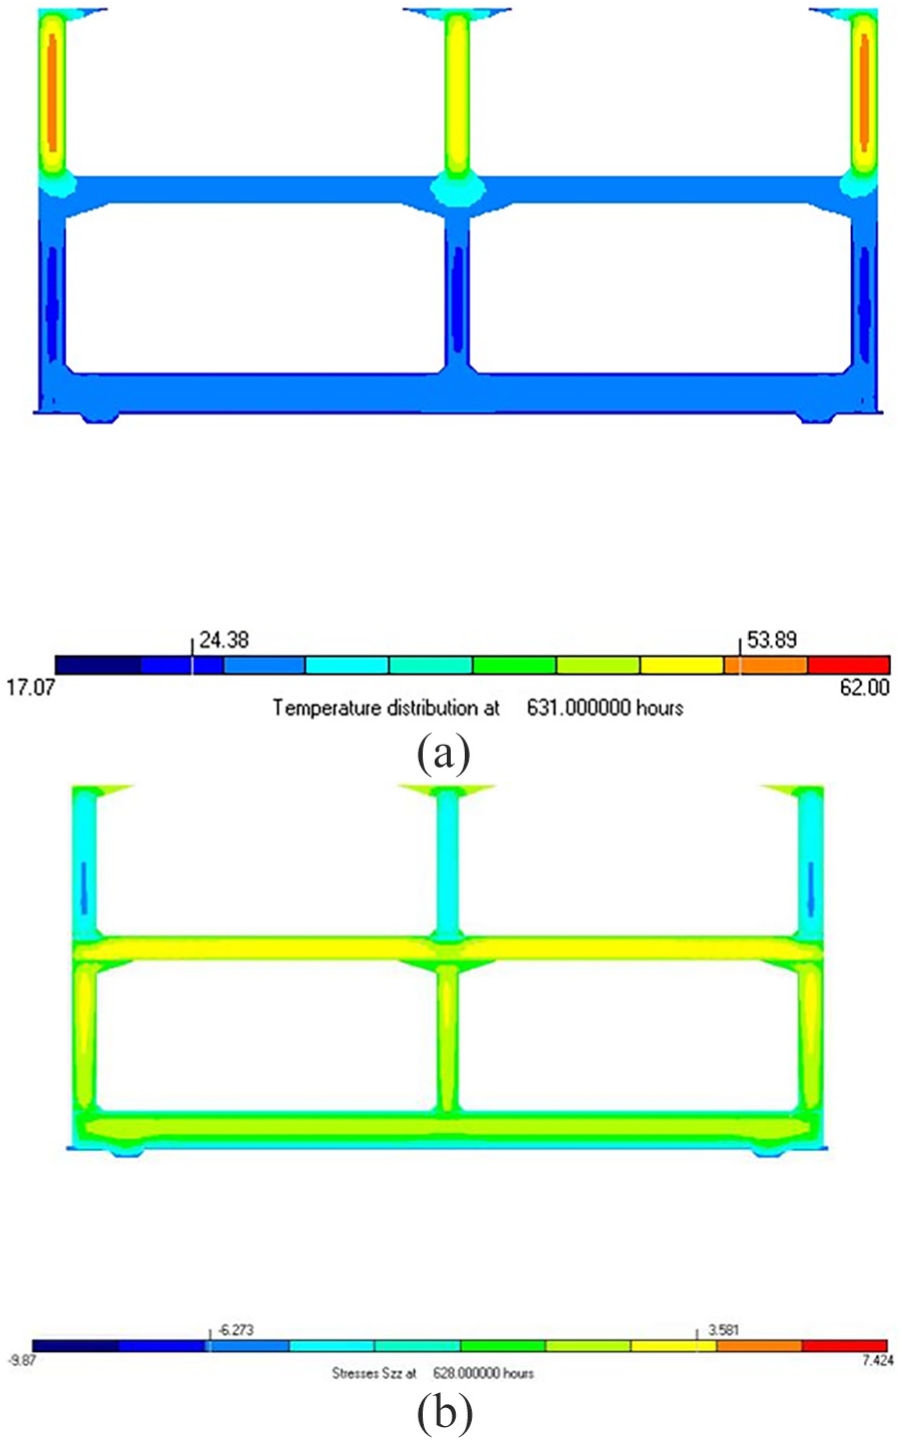
Distribution of temperature and stress component

Distribution of temperature and stress component σz of structure at 866 h (Stage 5): (a) temperature distribution and (b) distribution of stress component σZ.
From Figure 9(a), the temperature gradient on both side walls changes significantly, decreasing from inside to outside. However, the temperature inside the middle wall in the second floor is smaller than in the two side walls. The reason for this is that the hydration heat value in the middle wall had not yet reached the peak value and the formed temperature gradient is small. It can be seen in Figure 9(b) that the distribution of thermal stresses is also relatively average. The temperature difference between the inside and outside in the second floor at 631 h is 29.51°C, and the maximum tensile stress is 3.581 MPa. This indicates that cracks will not appear in the side wall of the second floor.
It can be seen in Figure 10(a) that the temperature of the roof plate also gradually decreases from inside to outside, and formed a clear temperature gradient. As can be seen from Figure 10(b), the greatest stress value is located in the side and middle walls of the second floor. The maximum temperature difference between the inside and outside of the roof at 866 h is 29.94°C, and the maximum tensile stress is 6.283 MPa. The stress values in the other areas are all relatively small, and cracks are less likely to occur. It is seen that the temperature gradients in the walls of the second floor of the tunnel are insignificant. However, the significant gradients of the stresses generated in the middle part and on the surface of the walls. It is noted that not only the role of thermal stress but also the shrinkage and moisture transport inside the concrete were considered. And the constraint from the upper roof and the middle plate also has an effect. Therefore, the change in temperature gradient should not be the only cause of the stress distribution.
Discussion of the results
From construction experience, cracks are prone to generate at 0.5–2 m high on the side wall, where point 1 is shown in Figure 3. From the above numerical results, it is also found that the thermal stresses are greater in the side wall. The evolution of the temperature, the plane principal stress, and
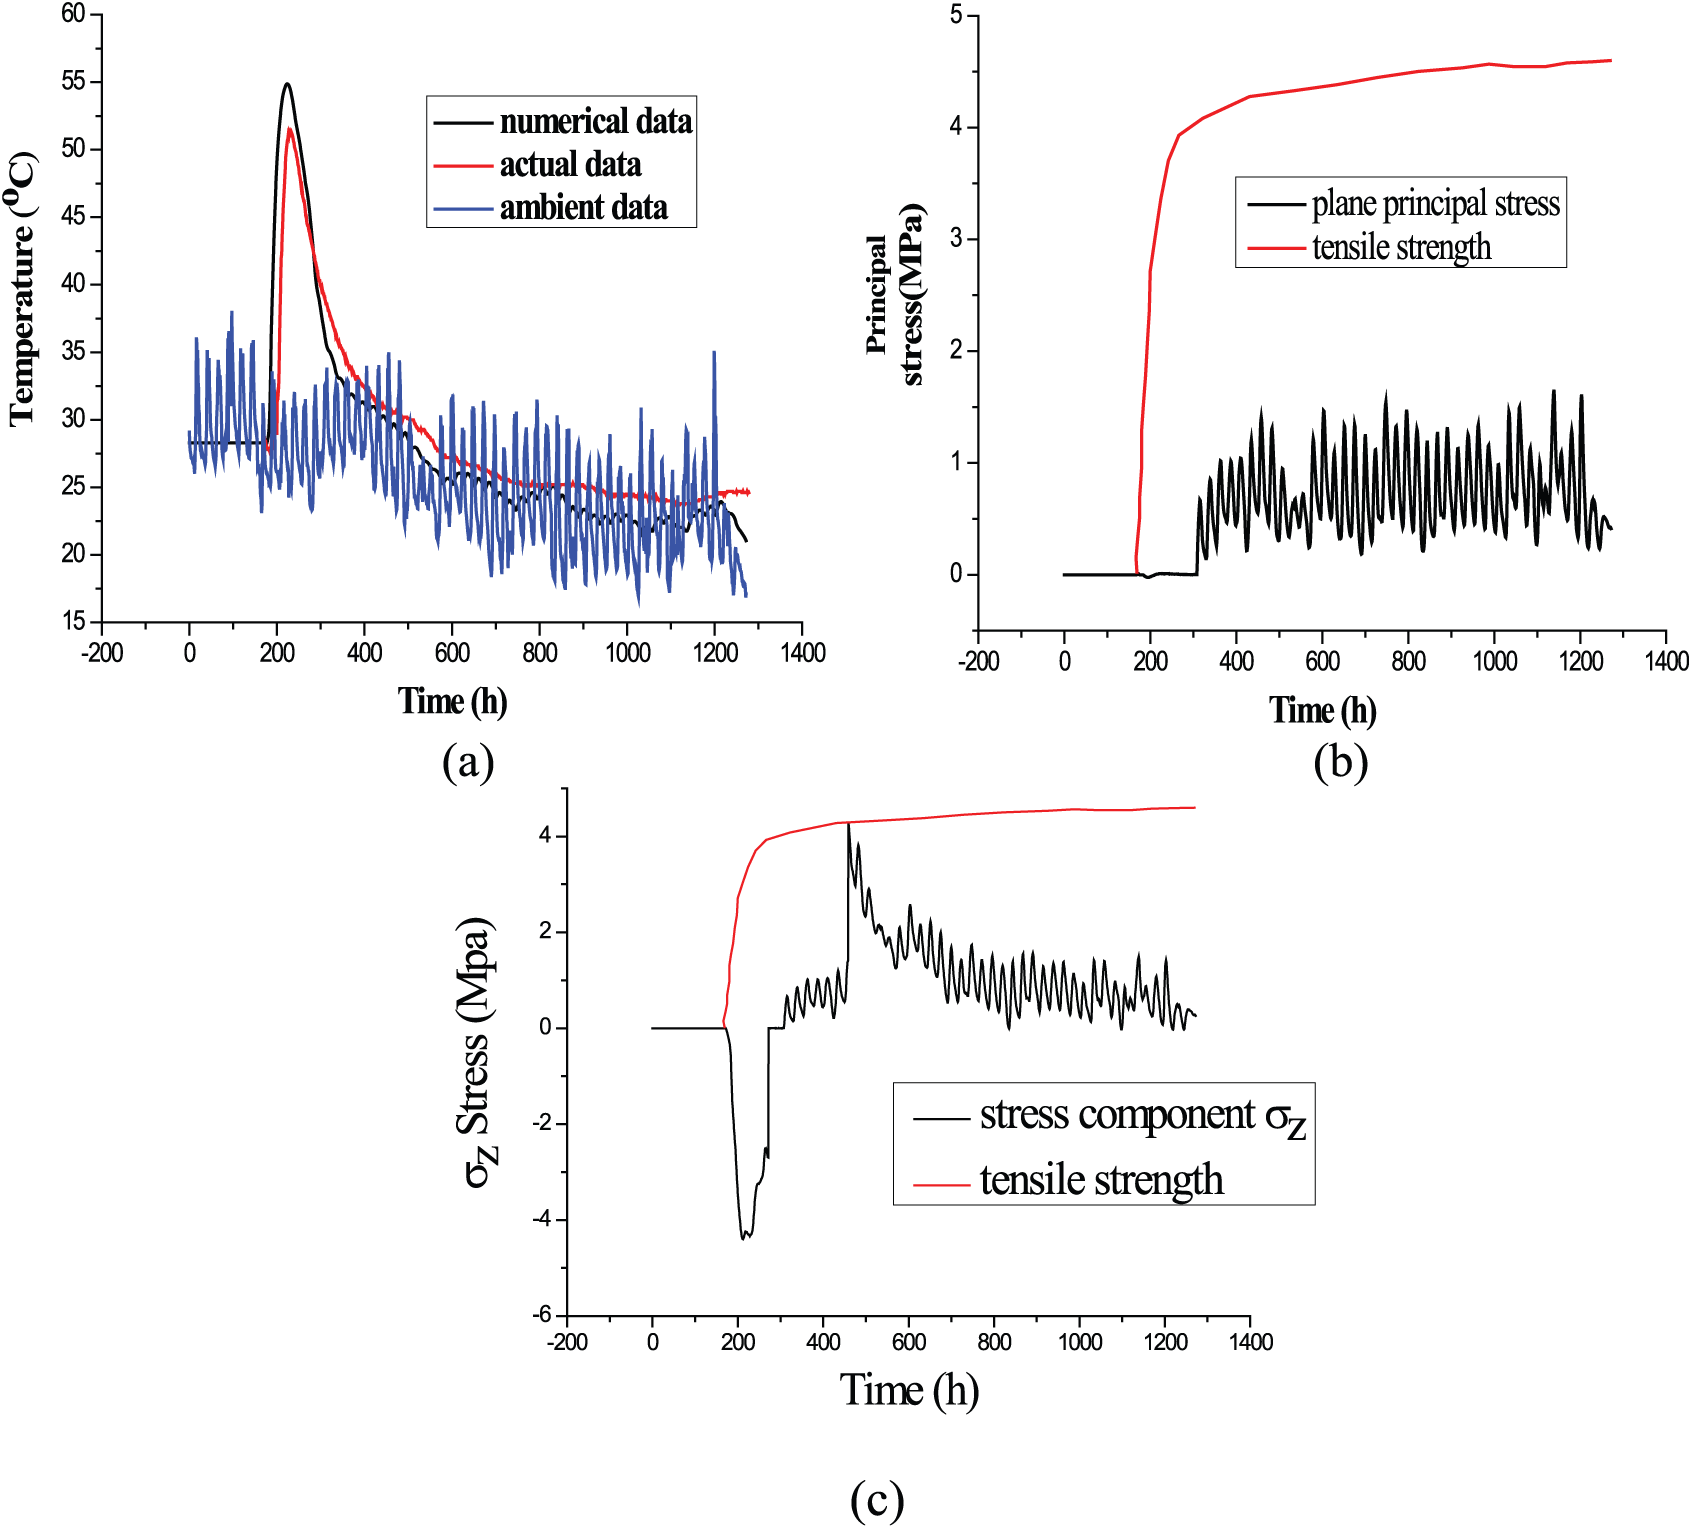
Evolution of temperature, plane principal stress, and σz at point 1: (a) temperature evolution, (b) evolution of plane principal stress, and (c) evolution of stress component σz.
Because of the effect of early hydration heat, the temperature of the structure had been increasing for approximately 3 days. After this, the bulk of the hydration heat had been released, and the temperature attained a maximum and began to decrease. On day 9, the temperature in the structure approached the ambient temperature. In Figure 11(a), the temperatures measured at the construction site are compared with the simulation results. It can be seen that the simulation results, although they are marginally greater, are in good agreement with the measured temperature. A possible reason for this is that the hydration heat model in the simulation adopts the adiabatic temperature increase from the experiment, in which there could be a number of inconsistencies on the hydration time of concrete. It is known that the concrete was transported for a while before the experiment, which could lead to a delay when measuring the adiabatic temperature increase. In addition, the ambient temperature data from the Bureau of Meteorology could differ from the actual conditions at the construction site. Because of the above, the simulated result is marginally greater than the actual value. Therefore, because the difference is satisfactorily small and the trends of the both curves are essentially identical, the simulation results should be significant in providing a reference value in stress computations.
The temperature field in this process induced thermal stresses in the structure. It can be seen from Figure 11(b) that the plane principal stress of point 1, which is located in the middle of the side wall, remained relatively small. The wave shape of the stress reflects the day and night cycles. As the temperature is greater inside the structure at the early stage of concrete hydration and expansion is restrained, the interior of the concrete exhibited primarily compressive stresses. As the temperature gradually decreases, the tensile stresses generated cancelled out the partial compressive stress previously generated. It can be seen from Figure 11(b) that the value of the residual principal tensile stress does not exceed the ultimate tensile strength.
The tensile stress in the Z-direction in the tunnel structure cannot be ignored. Figure 11(c) shows the stress evolution in the Z-direction. The red curve represents the evolution of the concrete tensile strength. Due to technical means, there is a lack of measured stress data. The computed values are considered reasonable since the computational model was verified and the obtained temperature was in good agreement. In the initial stages of concrete hydration, the value of compressive stress is significant. As the temperature gradually decreases, the previous compressive stresses are offset by the internal tensile stress, and the tensile stress in the Z-direction is significantly greater than the in-plane tensile stress, which approximately reaches the tensile strength of the concrete, although the structure in the Z-direction remains safe. Overall, the tensile stresses in the Z- direction are significantly greater than the in-plane tensile stresses. Therefore, the stresses in the Z-direction will be focus on.
Parameter analysis
In order to propose an optimal solution for tunnel construction, nine construction schemes were discussed for different initial concrete temperatures (25°C, 30°C, and 35°C), formwork stripping times (48 h, 72 h, and 96 h), and ambient temperature (summer/winter). The effects of these parameters on the structure are analysed by investigating the temperature and the stress in the Z-direction. Point 1, as shown in Figure 3, is considered.
Effect of formwork stripping time
To investigate the effect of formwork stripping time, three cases, 48 h, 72 h, and 96 h, are considered under an initial concrete temperature of 25°C. The evolution of temperature and the stress in the Z-direction at point 1 in the side wall of the tunnel structure are shown in Figure 12.

Evolution of temperature and σz at point 1: (a) temperature evolution and (b) evolution of stress component σz.
It can be seen that, under the same initial concrete temperature with different formwork stripping times, the three temperature evolution curves exhibit essentially the same trends, and the differences are only observed in the formwork stripping period, after which the temperatures decrease to a stable value after the peaks. The maximum temperatures were 51.917°C, 52.46°C, and 52.46°C for formwork stripping times of 48 h, 72 h, and 96 h, respectively. It is intuitive that, there is not much difference between the temperature curves for the three formwork stripping times (48 h, 72 h, and 96 h), in which 96 h gives a slightly higher value of temperature than the other two. It is also found that, when the temperature stabilises, its variation in all three cases is consistent with the ambient temperature.
From Figure 12(b), it can be seen that the period affected by the formwork stripping time on the thermal stress is greater than that by the temperature field. In this case, the later the formwork is demoulded, the greater the tensile thermal stresses obtained. The maximum stress in the Z-direction at 48 h, 72 h, and 96 h of formwork stripping times are 3.679 MPa, 3.8029 MPa, and 3.8706 MPa, respectively, which are all smaller than the concrete tensile strength of 4.29 MPa at this time. From Figure 12(b), it can be found that the tensile strength was almost identical in the three formwork stripping times. This indicates that no cracks will initiate in this area. When the temperature stabilises, the stress also decreases, and the difference between the three cases is not discernible. Therefore, the effect of formwork stripping time on thermal stresses in the structure is not significant.
Effect of initial concrete temperature
Figure 13(a) and (b) shows the evolution of the temperature and the stress in the Z-direction, respectively, of point 1 for three initial concrete temperatures of 25°C, 30°C, and 35°C under a formwork stripping time of 48 h.

Evolution of temperature and σz at point 1: (a) temperature evolution and (b) evolution of stress component σz.
As can be seen in Figure 13(a), the temperature curves in the three cases are consistent in the initial stages of concrete hydration. When the initial concrete temperature increases, the maximum temperature also increases, and the maximum temperatures at 25°C, 30°C, and 35°C are 51.917°C, 56.37°C, and 61.296°C, respectively. After the peaks, the temperatures gradually decrease and the descending trends of the three cases were in good agreement with the actual conditions.From Figure 13(b), it is found that there is a significant difference between the stress values in the Z-direction for different initial concrete temperatures. In the initial stage of concrete pouring, a compressive stress is generated, with similar values in all three cases. Over time, the temperatures decrease, and the tensile stresses increase, attaining a peak value after approximately 4 days. The stresses then gradually decrease. In the period before the stress peak, the greater the initial concrete temperature, the greater the stress value. The maximum stresses in the Z-direction at 25°C, 30°C, and 35°C were 3.6719 MPa, 4.402 MPa, and 5.1017 MPa, respectively. When the initial concrete temperature is 35°C, the tensile strength is 4.027–4.3178 MPa in the period 431–464 h. It can be seen that the actual stress values exceeded the internal tensile stress value. For an initial concrete temperature of 30°C, the internal tensile stress of the concrete was 4.316 MPa after 457 h, and it can be seen in Figure 13(b) that the actual stress attained a maximum value of 4.402 MPa. When the initial concrete temperature is greater than 30°C, cracks could initiate in the side wall of the tunnel. In the period after the stress peak, the difference between the stresses for initial temperatures of 25°C, 30°C, and 35°C is small.
Effect of ambient temperature
The effect on structural durability and safety is not only because of the hydration heat of the concrete, the formwork stripping time, and the initial concrete temperature, but also the temperature differences between day and night ambient temperatures of the different construction seasons.
In this study, the measured ambient temperature at a nearby site in Nanshan, Shenzhen, in summer and winter, is taken as an example. Under the same conditions, the ambient temperatures of different seasons are applied to calculate the temperature and stress variations inside the structure. From the simulated results, measures can be taken in a targeted manner to optimise the construction conditions during different periods.
The summer and the winter temperature history is shown in Figure 14(a), where the summer is from August 1 to September 23 and the winter from December 1 to January 23.

Evolution of temperature and σz of point 1 in summer and in winter: (a) temperature evolution and (b) evolution of stress component σz.
Figure 14(a) and (b) shows the evolution of temperature and stresses in the Z-direction, respectively, of point 1 in the side wall of the tunnel in summer and winter. Comparing the temperature in the structure in summer with that in winter, the temperature in the structure is significantly lower than that in summer, although in the early stage of hydration, there is no significant difference between the two, indicating that during the increasing stage of hydration heat, the temperature in the structure is not significantly affected by the outside environment. However, when it is close to the peak of hydration heat, the external environment has a greater impact, and the temperature in winter is smaller and the peak value of hydration heat is significantly smaller.
As can be seen in Figure 14(b), the stress levels in the Z-direction are greater, with the stress being greater in summer than in winter. The greater value of the stress is, in all probability, because of the greater summer ambient temperatures. The peak stress is 4.3314 MPa at 444 h, which is greater than the tensile strength 4.28 MPa, and, in this case, cracks are prone to initiate in the concrete structure. However, in winter, the maximum tensile stress is 4.27 MPa at 444 h, which is smaller than the tensile strength 4.29 MPa. From the perspective of thermal stress, the possibility of cracks inside the tunnel structure during winter construction is small.
When compared with the factors considered above, the initial concrete temperature has a significant influence on the thermal stresses in the structure. Therefore, it should be controlled, and it is recommended that the initial concrete temperature should not exceed 30°C to suppress cracking in the side wall of the structure.
Conclusion
In this study, numerical simulations of construction stages of an actual engineering project, the Qianhai tunnel, were conducted, in which temperature and thermal stress problems were considered.
First, the actual working conditions of five construction stages were considered. The temperature and stress distribution in each stage were analysed in detail. It was found that the greatest stress representing the stress concentration typically occurs at the edge of the floor, which should not be significant on the behaviour of the overall structure. A location 2 m high in the side wall in the tunnel was focused on, where cracks could typically occur. From the simulation results, it was found that the stress values do not exceed the concrete tensile strength, which means no cracks would be generated there.
In order to optimise the construction process, a parameter analysis was conducted that considered the effects of formwork stripping time, initial concrete temperature, and ambient temperature. It was obtained that (1) the impact of formwork stripping factors on the structure is not significant. Since the drying shrinkage was not considered in this study, the result may be slightly different from that when the drying shrinkage is considered. In that case the formwork removal may reduce the amount of evaporable water that would contribute to hydration and provoke early-age drying shrinkage, which may reduce the compressive and tensile strength in concrete. (2) The thermal stress of concrete increases with increasing initial concrete temperature. Under high initial concrete temperatures, the stresses could attain values where cracks could be prone to occur in the structure; (3) thermal stresses generated inside the structure are significant in summer and internal cracks could be generated.
Therefore, strictly controlling the initial concrete temperature during construction in summer should be able to suppress cracks in the structure. It is recommended that the initial concrete temperature should be controlled to below 30°C during construction. The formwork stripping time can be adjusted depending of the evolution of the concrete strength.
Footnotes
Handling Editor: Roozbeh Rezakhani
Declaration of conflicting interests
The author(s) declared no potential conflicts of interest with respect to the research, authorship, and/or publication of this article.
Funding
The author(s) disclosed receipt of the following financial support for the research, authorship, and/or publication of this article: The work presented in this article was supported by the General Programme of the National Natural Science Foundation of China (No.51478272, U1301241) and the Science and Technology Foundation for the Basic Research Plan of Shenzhen City (JCYJ20160422095146121).